. 2021 Mar 19;12(1):1781.
doi: 10.1038/s41467-021-21867-0.

CRISPRi screens reveal a DNA methylation-mediated 3D genome dependent causal mechanism in prostate cancer

Affiliations

CRISPRi screens reveal a DNA methylation-mediated 3D genome dependent causal mechanism in prostate cancer

Musaddeque Ahmed et al. Nat Commun. .

Abstract

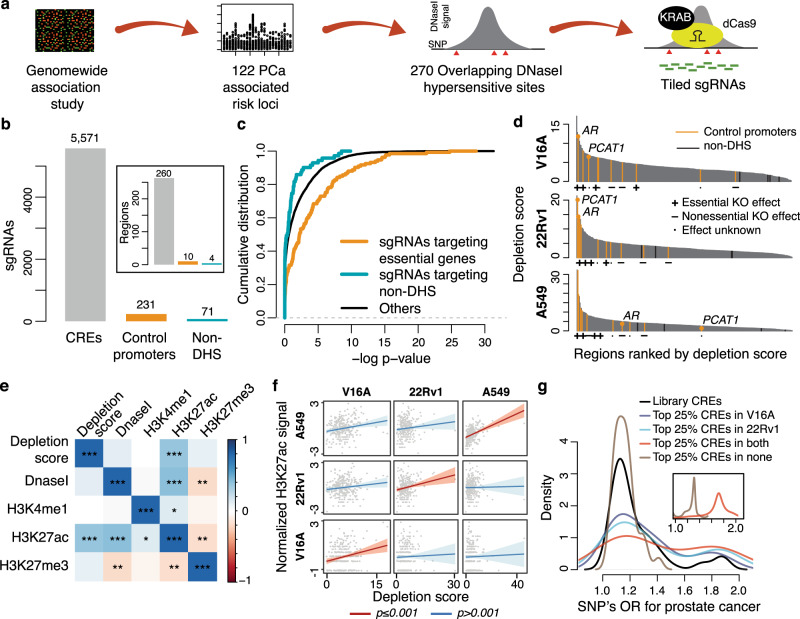
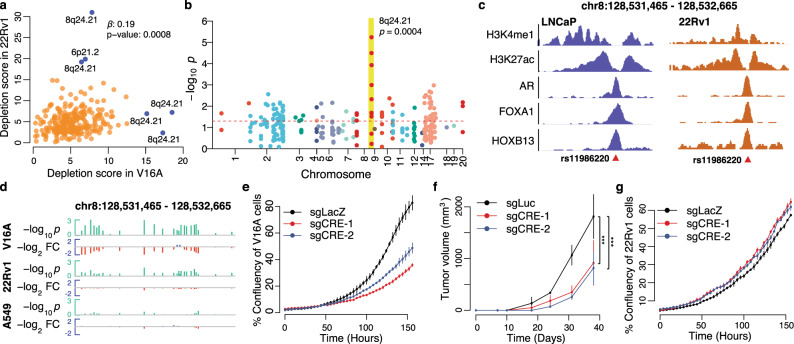
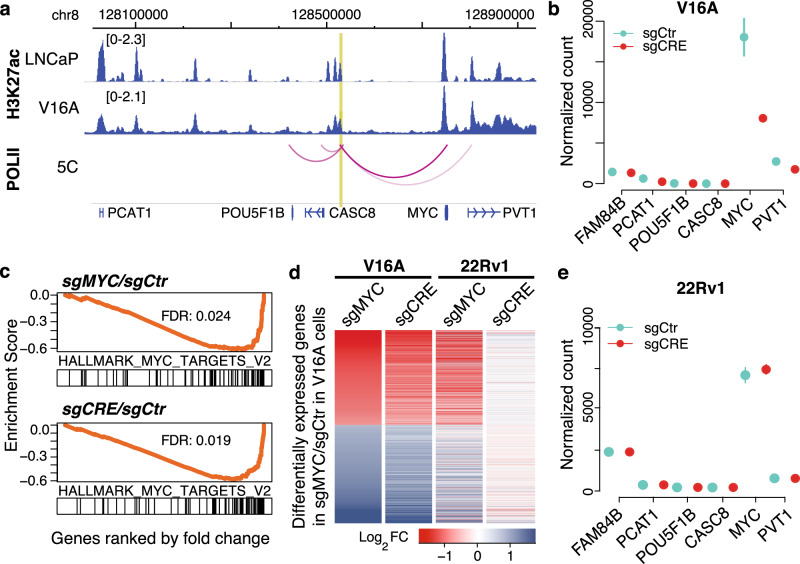
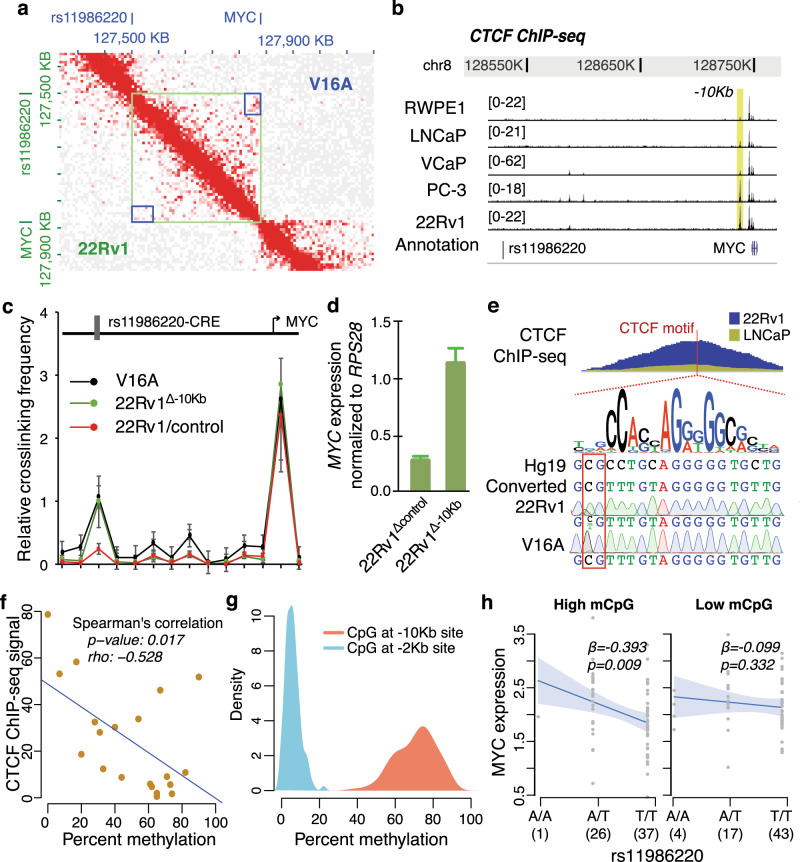
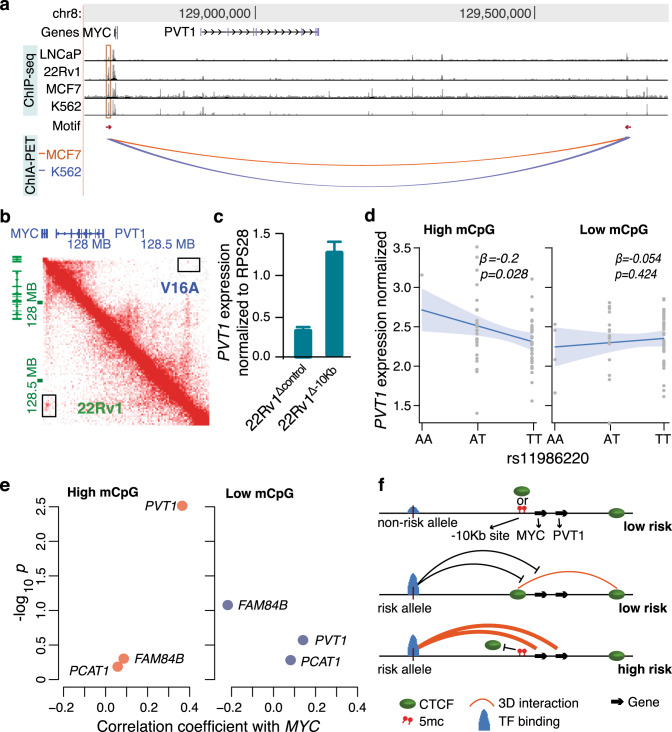
Prostate cancer (PCa) risk-associated SNPs are enriched in noncoding cis-regulatory elements (rCREs), yet their modi operandi and clinical impact remain elusive. Here, we perform CRISPRi screens of 260 rCREs in PCa cell lines. We find that rCREs harboring high risk SNPs are more essential for cell proliferation and H3K27ac occupancy is a strong indicator of essentiality. We also show that cell-line-specific essential rCREs are enriched in the 8q24.21 region, with the rs11986220-containing rCRE regulating MYC and PVT1 expression, cell proliferation and tumorigenesis in a cell-line-specific manner, depending on DNA methylation-orchestrated occupancy of a CTCF binding site in between this rCRE and the MYC promoter. We demonstrate that CTCF deposition at this site as measured by DNA methylation level is highly variable in prostate specimens, and observe the MYC eQTL in the 8q24.21 locus in individuals with low CTCF binding. Together our findings highlight a causal mechanism synergistically driven by a risk SNP and DNA methylation-mediated 3D genome architecture, advocating for the integration of genetics and epigenetics in assessing risks conferred by genetic predispositions.


Conflict of interest statement

Felix Y. Feng is co-founder of PFS Genomics and serves on the Scientific Advisory Board of SerImmune.

Figures

Fig. 1
Fig. 1. CRISPRi screening of prostate cancer risk CREs.
a Schematic of rCRE selection and sgRNA design. b Distribution of sgRNAs targeting rCREs or control regions. The barplot in the inset indicates the number of regions in the library. c The cumulative distribution of depletion p-values of sgRNA targeting control promoter regions that are essential for growth in Achilles DepMap project (orange), sgRNAs targeting non-DNaseI hypersensitive sites (green), and sgRNAs targeting rCREs (black). Depletion p values were estimated using the tool MAGeCK (see ‘Methods’). d rCREs ranked by their depletion scores in three cell lines. Promoters of two prostate-specific oncogenes, AR and PCAT1, are labeled. The panels below the plots indicate the knockout effects of the control genes on respective cell growth as observed in Achilles DepMap project. e Correlation of LNCaP ChIP-seq signals of several histone marks with the depletion score in LNCaP-derived V16A cells. P values are estimated using Spearman’s correlation test. The colors of the box correspond to the correlation coefficient and the * corresponds to the statistical significance of correlation test. *, p ≤ 0.05; **, p ≤ 0.01; ***, p ≤ 0.005. f Linear regression between H3K27ac ChIP-seq signals and CRISPRi depletion score in cell line-specific manner. The solid lines denote the best fit for the regression model and the shaded areas denote 95% confidence interval. P value is calculated using linear regression analysis. g Distribution of odds ratio for PCa conferred by the risk SNPs within library rCREs. The black line denotes OR of risk SNPs in rCREs in the library; the colored lines denote top 25% rCREs when ranked by their depletion scores in PCa cell lines. The inset plot demonstrates the OR distribution by risk SNPs in bottom 75% rCREs (brown) and top 25% rCREs in both V16A and 22Rv1 cells (red) normalized by the overall OR distribution of all library risk SNPs. The inset axes are the same as the main plot axes.
Fig. 2
Fig. 2. The essential rCREs are enriched in 8q24.21 region.
a Depletion score of rCREs in V16A and 22Rv1 cells. The blue points indicate the outlier rCREs in linear regression between the cell lines. The regression coefficient, β, and the p value are calculated using linear regression analysis between the depletion scores after removing the six outliers. b The essential rCREs are overrepresented in the 8q24.21 region in V16A cells (p = 0.0004, Chi-sq test). Each circle denotes a library rCRE. The size of the circle is relative to the depletion fold change. See Supplementary Fig. 2 for other cell lines. c ChIP-seq signals of histone modifications and three important transcription factors in the rCRE region of chr8:128531465–128532665 in LNCaP and 22Rv1 cells. Risk SNP rs11986220 is located close to the center of transcription factors binding site. d Overview of p value and fold change at day 16 compared to day 0 of the individual sliding windows targeting the rCRE chr8:128531465–128532665. The green bars indicate –log2 p values; the red bar indicates fold change of sgRNAs in day 16 compared to day 0. FC fold change. Depletion p values and fold changes were estimated using the tool MAGeCK (see ‘Methods’). e Growth of V16A cells in vitro upon suppression of chr8:128531465–128532665 by two independent sgRNAs using dCas9-KRAB system. Data are represented as Mean ± s.d. (n = 2). f Tumor growth in a V16A-inoculated mouse xenograft upon injection of respective sgRNAs. Data are represented as Mean ± s.d. (n = 3). P values were estimated using ANOVA test. *** denotes a p value of 0.007. g Growth of 22Rv1 cells upon suppression of this rCRE using the same sgRNAs by dCas9-KRAB system. Data are represented as Mean ± s.d. (n = 2). Source data are provided as a Source Data file.
Fig. 3
Fig. 3. The rCRE chr8:128531465–128532265 regulates MYC in V16A but not in 22Rv1 cells.
a The top two tracks demonstrate the H3K27ac ChIP-seq signal in LNCaP and V16A cells. The arc track represents the interactions between this rCRE and neighboring promoter regions as determined by ENCODE POLII 5C data in LNCaP cells. The intensity of the arc color represents the interaction strength. The bottom track represents the RefSeq gene annotation. The chromosomal positions are of the genome assembly Hg19. b Expression of neighboring genes as determined by RNA-seq upon repression of the rCRE chr8:128531465–-128532665 by dCas9-KRAB in V16A cells. The data are shown in mean ± s.d. (n = 2). Source data are provided as a Source Data file. c Gene set enrichment analysis shows that the hallmark MYC target genes (MSigDB H collection) are most overrepresented among the genes downregulated by repression of the MYC promoter (upper panel) or rs11986220-CRE (lower panel). See Supplementary Fig. 3 for overall gene set enrichment analysis. d Changes in transcriptome-wide gene expression upon repression of the rCRE (by sgCRE) and the MYC promoter region (by sgMYC) in V16A and 22Rv1 cells. Only the genes differentially expressed (FDR < 0.1 and fold change >1.5, negative binomial test) upon MYC promoter repression (sgMYC) in dCas9-KRAB V16A cells are shown. The genes are sorted by fold change in V16A cells. FC fold change. e Expression of neighboring genes as determined by RNA-seq upon repression of the rCRE by dCas9-KRAB in 22Rv1 cells. The data are shown in mean ± s.d. (n = 2). Source data are provided as a Source Data file.
Fig. 4
Fig. 4. Methylation-dependent variable CTCF binding at –10 Kb locus regulates MYC eQTL.
a Hi-C interaction map in 8q24.21 region in V16A (top-right triangle) and 22Rv1 cells (bottom-left triangle). The green square denotes the rs11986220-containing rCRE and MYC-promoter boundary and the blue square indicates the interaction points between these loci. b CTCF ChIP-seq signals in PCa cell lines between the rs1198220-containing rCRE and MYC promoter. The yellow bar denotes the CTCF binding site 10 Kb upstream of MYC promoter (–10 Kb site) which accumulates almost fourfold more CTCF deposition in 22Rv1 cells compared to LNCaP cells. c Interaction across chromatin regions between the rCRE and MYC promoter as determined by 3C assay. The data are shown in mean ± s.d. (n = 3). d Quantification of MYC transcripts by qPCR in 22Rv1 cells upon CRISPR/Cas9-mediated deletion of the –10 Kb CTCF site. Error bars denote standard error of mean (n = 2). e The top track indicates CTCF ChIP-seq profile in two cell lines and the position of CTCF binding motif (red bar). The motif logo is shown on the second track. The sequences shown are of the reference genome and bisulfite converted genome. The bottom two tracks show Sanger’s sequencing data upon bisulfite conversion in V16A and 22Rv1 cells. The red box denotes the differentially methylated CpG dinucleotide. f Correlation between the methylation level of this CpG and CTCF ChIP-seq signal at this locus in ENCODE cells. Each circle denotes a cell line and the blue line indicates the regression coefficient. See also Supplementary Fig. 4. g Distribution of methylation level of CpGs in –10 Kb and –2 Kb sites in 128 prostate tissues as determined by the whole-genome bisulfite sequencing. h Association between rs11986220 genotype and MYC expression in prostate tissues dichotomized by high (left panel) and low (right panel) level of methylation of the CpG in –10 Kb CTCF binding motif. The lines indicate the best fit for the regression models and the shaded areas indicate 95% confidence interval. The regression coefficient, β, and the p value are calculated using linear regression analysis. Source data are provided as a Source Data file.
Fig. 5
Fig. 5. CTCF binding at –10 Kb site regulates both MYC and PVT1.
a CTCF binding landscape downstream of MYC. The top four tracks show CTCF ChIP-seq signals in four cancer cell lines. The –10 Kb site is highlighted in red. The motif track shows a canonical CTCF-binding motif. The direction of the arrow indicates the orientation of the motif. The arcs show CTCF interactions between two CTCF binding sites in two cell lines as determined by ENCODE CTCF ChIA-PET data. b The Hi-C interaction map in V16A (top right triangle) and 22Rv1 (bottom left triangle) cells in this region. The interaction point in black rectangle denotes the interaction between two CTCF sites as shown in panel (a). c Quantification of PVT1 expression in 22Rv1 cells upon deletion of –10 Kb site by CRISPR/Cas9. Error bars denote standard error of mean (n = 2). P value is estimated using t test. d Association between rs11986220 genotype and PVT1 expression in prostate tissues dichotomized by high (left panel) and low (right panel) level of methylation of the CpG in CTCF binding motif at –10 Kb site. The lines indicate the best fit for the regression models and the shaded areas indicate 95% confidence interval. The regression coefficient, β, and the p value are calculated using linear regression analysis. e Pearson’s correlation coefficient between the expression of MYC and neighboring genes in prostate tissues dichotomized by the methylation level of the CpG. See Supplementary Fig. 5a for expression of neighboring genes. f Schematic of regulation of causal mechanism by methylation-dependent CTCF binding at –10 Kb site. Source data are provided as a Source Data file.

Similar articles

Cited by

References

    1. Sridharan S, Dal Pra A, Catton C, Bristow RG, Warde P. Locally advanced prostate cancer: current controversies and optimisation opportunities. Clin. Oncol. 2013;25:499–505. doi: 10.1016/j.clon.2013.04.004. - DOI - PubMed
    1. Schumacher FR, et al. Association analyses of more than 140,000 men identify 63 new prostate cancer susceptibility loci. Nat. Genet. 2018;50:928–936. doi: 10.1038/s41588-018-0142-8. - DOI - PMC - PubMed
    1. Dadaev T, et al. Fine-mapping of prostate cancer susceptibility loci in a large meta-analysis identifies candidate causal variants. Nat. Commun. 2018;9:2256. doi: 10.1038/s41467-018-04109-8. - DOI - PMC - PubMed
    1. Hazelett DJ, et al. Comprehensive functional annotation of 77 prostate cancer risk loci. PLoS Genet. 2014;10:e1004102. doi: 10.1371/journal.pgen.1004102. - DOI - PMC - PubMed
    1. Shui IM, et al. Prostate cancer (PCa) risk variants and risk of fatal PCa in the National Cancer Institute Breast and Prostate Cancer Cohort Consortium. Eur. Urol. 2014;65:1069–1075. doi: 10.1016/j.eururo.2013.12.058. - DOI - PMC - PubMed

Publication types

MeSH terms

Substances