. 2021 Mar 19;12(1):1751.
doi: 10.1038/s41467-021-21798-w.

Clonal architecture in mesothelioma is prognostic and shapes the tumour microenvironment

Affiliations

Clonal architecture in mesothelioma is prognostic and shapes the tumour microenvironment

Min Zhang et al. Nat Commun. .

Erratum in

  • Author Correction: Clonal architecture in mesothelioma is prognostic and shapes the tumour microenvironment.
    Zhang M, Luo JL, Sun Q, Harber J, Dawson AG, Nakas A, Busacca S, Sharkey AJ, Waller D, Sheaff MT, Richards C, Wells-Jordan P, Gaba A, Poile C, Baitei EY, Bzura A, Dzialo J, Jama M, Le Quesne J, Bajaj A, Martinson L, Shaw JA, Pritchard C, Kamata T, Kuse N, Brannan L, De Philip Zhang P, Yang H, Griffiths G, Wilson G, Swanton C, Dudbridge F, Hollox EJ, Fennell DA. Zhang M, et al. Nat Commun. 2021 Jun 7;12(1):3569. doi: 10.1038/s41467-021-23867-6. Nat Commun. 2021. PMID: 34099722 Free PMC article. No abstract available.

Abstract

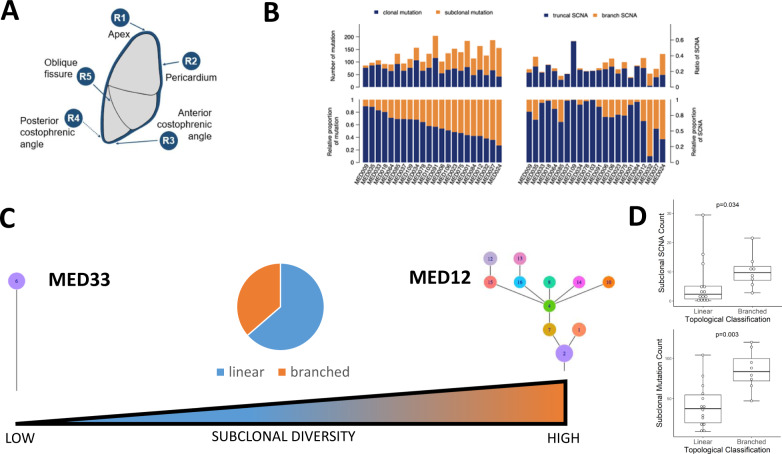
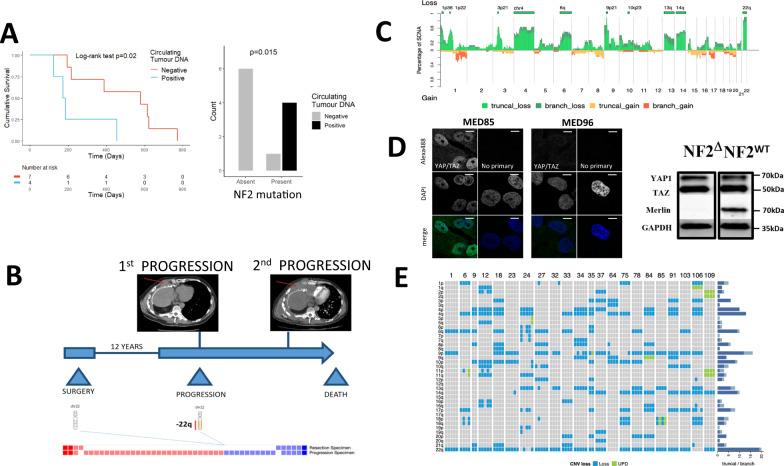
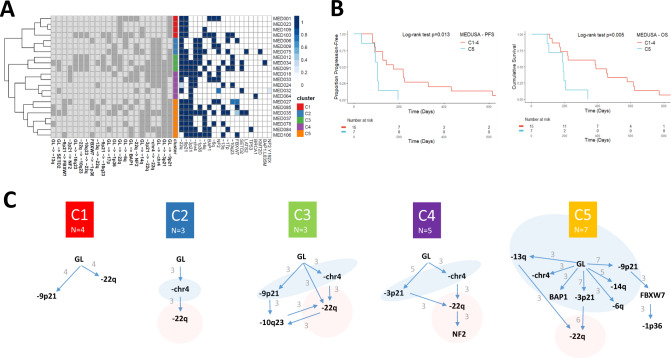
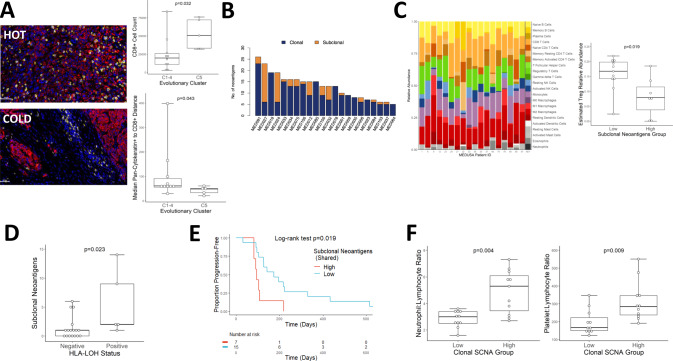
Malignant Pleural Mesothelioma (MPM) is typically diagnosed 20-50 years after exposure to asbestos and evolves along an unknown evolutionary trajectory. To elucidate this path, we conducted multi-regional exome sequencing of 90 tumour samples from 22 MPMs acquired at surgery. Here we show that exomic intratumour heterogeneity varies widely across the cohort. Phylogenetic tree topology ranges from linear to highly branched, reflecting a steep gradient of genomic instability. Using transfer learning, we detect repeated evolution, resolving 5 clusters that are prognostic, with temporally ordered clonal drivers. BAP1/-3p21 and FBXW7/-chr4 events are always early clonal. In contrast, NF2/-22q events, leading to Hippo pathway inactivation are predominantly late clonal, positively selected, and when subclonal, exhibit parallel evolution indicating an evolutionary constraint. Very late somatic alteration of NF2/22q occurred in one patient 12 years after surgery. Clonal architecture and evolutionary clusters dictate MPM inflammation and immune evasion. These results reveal potentially drugable evolutionary bottlenecking in MPM, and an impact of clonal architecture on shaping the immune landscape, with potential to dictate the clinical response to immune checkpoint inhibition.


Conflict of interest statement

The authors declare no competing interests.

Figures

Fig. 1
Fig. 1. Genomic intratumour heterogeneity in MPM.
A Pleural mesothelioma tissue sampling locations were consistent between patients involving the apex (region1, R1), the pericardium (R2), anterior costophrenic angle (R3), posterior costophrenic angle (R4) and the oblique fissure (R5). The rationale for selecting the anatomically sterotyped sites at the time of tissue sampling was to ensure maximum coverage of the tumour from superior to inferior; medial to lateral; and anterior to posterior. We chose the oblique fissure (R5) as this is common to both the right and left lung and could be a reliable anatomical site bilaterally. Spatial evolution of mesothelioma would be expected to be best reflected in samples at maximum distance from one another, reflecting the inherent intratumour heterogeneity. These regions are represented by the most superior region (R1) and the inferior (R3 and R4). B Inter-patient and intratumour heterogeneity in the MEDUSA22 cohort. Histograms summarising the variance in clonal versus subclonal mutations (left) compared with somatic copy number alterations (SCNAs, right). Left top, relative number of mutations, left bottom, proportion of mutations ranked by clonal mutation proportion ranging from maximum (left) to minimum (right). Right top, ratio of truncal SCNA versus branch SCNA. Right bottom, relative proportion of SCNA ranked as for mutations. C Spectrum of subclonal diversity in the MEDUSA22 cohort, ranging from linear topology (MED33 left) to branched (MED12 right). Centre, Pie chart showing the relative proportion of patients in the MEDUSA22 cohort classified as either linear (64%) or branched (36%). D Box plots showing the positive correlation between topology classified as either linear or branched, and subclonal SCNA count (two-sided Mann–Whitney U test p = 0.034, left) and subclonal mutation count (two-sided Mann–Whitney U test p = 0.003, right). n = 22 patients. Both box plots denote medians (centre lines), 25th and 75th percentiles (bounds of boxes), and minimum and maximum (whiskers).
Fig. 2
Fig. 2. NF2/22q loss correlates with detectable ctDNA and late progression in MPM.
A Left. Kaplan-Meier plot showing the relative survival of patients with detectable, clonal driver mutations present in the circulating tumour DNA (ctDNA). Overall survival was significantly lower for patients positive for ctDNA (Two-sided Log-rank test p = 0.020; hazard ratio 5.20; 95% confidence intervals: 1.12, 24.09). Right. Column chart showing that patients who had detectable ctDNA (black column) were more likely to have a NF2 mutant tumour (two-sided Fisher’s exact test p = 0.015; Odds ratio is infinite because all ctDNA-positive tumours were NF2 mutants; 95% confidence intervals: 1.27, infinite). n = 11 patients. B Longitudinal sampling of tissue from a patient taken at the time of radical pleurectomy decortication (this patient was not enroled into MEDUSA). Array based SCNA analysis was conducted showing subclonal loss of 22q at first progression with a higher SCNA burden, ~12 years following surgery. Subsequent progression was associated with drug resistance (CT scan top right). The squares at the base show copy number losses in blue and gains/amplifications in red. The time from final progression to death was 29 days. C Stacked mountain plot summarising clonal versus subclonal losses (above, green) compared with gains (orange/truncal, red/branch) below. This figure shows the relative frequency (y axis) of copy number losses compared with gains along the whole-exome (x axis) averaged across the cohort of patients. D Nuclear YAP expression in a cell line derived from patient MED85 harbouring deletion of NF2, compared with wild-type NF2 (MED96) showing non-nuclear YAP expression (right panel). Confocal images: FV1000 (Olympus), ×60 objective, ×4 zoomed scale bars = 10 μm. E Heatmap summarising arm level losses in the MEDUSA22 cohort by chromosome (left column). The clonal (blue) versus subclonal (grey) frequency of arm level losses per chromosome are shown in the histogram on the right.
Fig. 3
Fig. 3. Defining evolutionary trajectories and their prognostic significance in MPM.
A Heatmap showing the evolutionary clusters inferred by transfer learning and hierarchical classification. In the middle of the heatmap, five evolutionary clusters are defined and are vertically colour coded, with cluster 1 (C1) in red, C2 blue, C3 green, C4 purple and C5 orange (shown in the key on the right). On the left side of the heatmap, individual evolutionary transitions (i.e. mutational events including both SCNAs and mutations) are shown on the lower axis. The abbreviation GL corresponds to germline. Any transition occurring more than three patients is considered a repeated evolutionary transition. On the right the presence or absence of a mutation or copy number loss is shown. On the right, the probability of an event is presented by the shade of blue, with probability = 1 being dark blue. B Kaplan-Meier curves showing (left) shorter progression-free (two-sided Log-rank test p = 0.013; hazard ratio 3.52; 95% confidence intervals: 1.22, 10.13) and (right) lower overall survival (two-sided Log-rank test p = 0.005; hazard ratio 4.43; 95% confidence intervals: 1.42, 13.77) of C5 MPMs compared to other evolutionary clusters (C1–C4). n = 22 patients. C Inferred evolutionary trajectories involving repeated transitions in more than three patients. Somatic events that are exclusively early clonal (germline (GL) transitions) are encompassed by a light blue area. Conversely, exclusively late clonal transitions are highlighted in red. The specific number of patients exhibiting repeated transitions is shown as numbers against the directed edges (transitions).
Fig. 4
Fig. 4. Clonal architecture shapes the immune microenvironment in MPM.
A Left. Representative immunofluorescence micrographs contrasting cluster C2 CD8+ exclusion (“COLD”, MED75) with a highly infiltrated C5 tumour (“HOT”, MED35). Yellow: CD8; Red: Pan-Cytokeratin; Blue: DAPI (nuclei). Original magnification ×400. Scale bars represent 50 μm. Right. Higher CD8+ T-cell infiltration associated with evolutionary cluster C5 by cell count (Two-sided Mann–Whitney U test p = 0.032) and Pan-Cytokeratin to CD8 distance (two-sided Mann–Whitney U test p = 0.043). n = 15 patients. Both box plots denote medians (centre lines), 25th and 75th percentiles (bounds of boxes), and minimum and maximum (whiskers). B Histogram showing the relative number of neoantigens across the MEDUSA22 cohort, colour coded as either clonal (blue) or subclonal (orange) ranked from maximum (left) to minimum (right). C Left. Stacked column chart summarising the relative proportion of tumour infiltrating leucocytes enumerated by digital cytometry using CIBERSORT. Right, box plot showing a significantly higher Treg abundance in MPMs with lower neoantigen diversity (two-sided Mann–Whitney U test p = 0.018). n = 18 patients. Box plot denotes median (centre line), 25th and 75th percentiles (bounds of box), and minimum and maximum (whiskers). D Box plot showing increased neoantigen intratumour heterogeneity (ITH) in patients with evidence of HLA LOH (two-sided Mann–Whitney U test p < 0.023). n = 22 patients. Box plot denotes median (centre line), 25th and 75th percentiles (bounds of box), and minimum and maximum (whiskers). E Kaplan-Meier plot showing significantly lower mortality for patients with a higher burden of subclonal (shared) neoantigens (two-sided Log-rank test p = 0.019; hazard ratio 3.14; 95% confidence intervals: 1.16, 8.51). n = 22 patients. F Box plots showing a significant interaction between clonal SCNA burden versus neutrophil-lymphocyte ratio (NLR, left, two-sided Mann–Whitney U test p = 0.004) and platelet-lymphocyte ratio (PLR, right, two-sided Mann–Whitney U test p = 0.009). n = 22 patients. Both box plots denote medians (centre lines), 25th and 75th percentiles (bounds of boxes), and minimum and maximum (whiskers).

References

    1. Wagner JC, Sleggs CA, Marchand P. Diffuse pleural mesothelioma and asbestos exposure in the North Western Cape Province. Br. J. Ind. Med. 1960;17:260–271. - PMC - PubMed
    1. Odgerel CO, et al. Estimation of the global burden of mesothelioma deaths from incomplete national mortality data. Occup. Environ. Med. 2017;74:851–858. - PMC - PubMed
    1. Kircheva DY, et al. Specimen weight and volume: important predictors of survival in malignant pleural mesothelioma. Eur. J. Cardiothorac. Surg. 2016;49:1642–1647. - PubMed
    1. Baas P, et al. First-line nivolumab plus ipilimumab in unresectable malignant pleural mesothelioma (CheckMate 743): a multicentre, randomised, open-label, phase 3 trial. The Lancet. 2021;397:375–386. - PubMed
    1. Yap TA, Aerts JG, Popat S, Fennell DA. Novel insights into mesothelioma biology and implications for therapy. Nat. Rev. Cancer. 2017;17:475–488. - PubMed

Publication types

Substances