. 2021 Mar 19;12(1):1749.
doi: 10.1038/s41467-021-21883-0.

The transcriptional landscape of Shh medulloblastoma

Patryk Skowron #  1   2   3 Hamza Farooq #  1   2   3 Florence M G Cavalli #  1   3 A Sorana Morrissy #  4   5   6 Michelle Ly  1   2   3 Liam D Hendrikse  1   3   7 Evan Y Wang  1   3   7 Haig Djambazian  8   9 Helen Zhu  7   10 Karen L Mungall  11 Quang M Trinh  10 Tina Zheng  12 Shizhong Dai  13 Ana S Guerreiro Stucklin  1   3 Maria C Vladoiu  1   2   3 Vernon Fong  1   3 Borja L Holgado  1   3 Carolina Nor  1   3 Xiaochong Wu  1   3 Diala Abd-Rabbo  10 Pierre Bérubé  8 Yu Chang Wang  8 Betty Luu  1   3 Raul A Suarez  1   3 Avesta Rastan  1   3   14 Aaron H Gillmor  4   5   6 John J Y Lee  1   2   3 Xiao Yun Zhang  1 Craig Daniels  1   3 Peter Dirks  1   3   15   16 David Malkin  7   17 Eric Bouffet  3   17 Uri Tabori  3   14   17 James Loukides  3 François P Doz  18 Franck Bourdeaut  18 Olivier O Delattre  19 Julien Masliah-Planchon  20 Olivier Ayrault  21 Seung-Ki Kim  22 David Meyronet  23 Wieslawa A Grajkowska  24 Carlos G Carlotti  25 Carmen de Torres  26 Jaume Mora  26 Charles G Eberhart  27 Erwin G Van Meir  28 Toshihiro Kumabe  29 Pim J French  30 Johan M Kros  31 Nada Jabado  32 Boleslaw Lach  33   34 Ian F Pollack  35 Ronald L Hamilton  36 Amulya A Nageswara Rao  37 Caterina Giannini  38 James M Olson  39 László Bognár  40 Almos Klekner  40 Karel Zitterbart  41 Joanna J Phillips  42   43 Reid C Thompson  44 Michael K Cooper  45 Joshua B Rubin  46 Linda M Liau  47 Miklós Garami  48 Peter Hauser  48 Kay Ka Wai Li  49 Ho-Keung Ng  49 Wai Sang Poon  50 G Yancey Gillespie  51 Jennifer A Chan  6 Shin Jung  52 Roger E McLendon  53   54 Eric M Thompson  54 David Zagzag  55 Rajeev Vibhakar  56 Young Shin Ra  57 Maria Luisa Garre  58 Ulrich Schüller  59   60   61 Tomoko Shofuda  62 Claudia C Faria  63   64 Enrique López-Aguilar  65 Gelareh Zadeh  66   67 Chi-Chung Hui  1   16 Vijay Ramaswamy  1   3   7   17 Swneke D Bailey  68   69 Steven J Jones  11   70   71 Andrew J Mungall  11 Richard A Moore  11 John A Calarco  72 Lincoln D Stein  16   73 Gary D Bader  16   74 Jüri Reimand  7   10   16 Jiannis Ragoussis  8   9 William A Weiss  12   42   75 Marco A Marra  11   70 Hiromichi Suzuki  76   77 Michael D Taylor  78   79   80   81   82   83
Affiliations

The transcriptional landscape of Shh medulloblastoma

Patryk Skowron et al. Nat Commun. .

Abstract

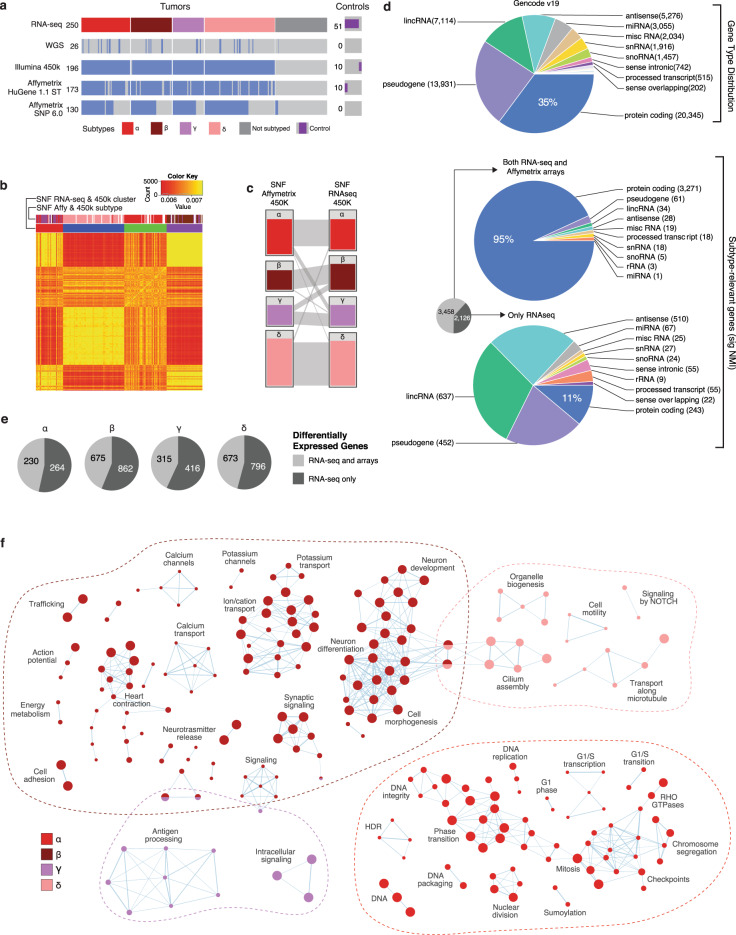
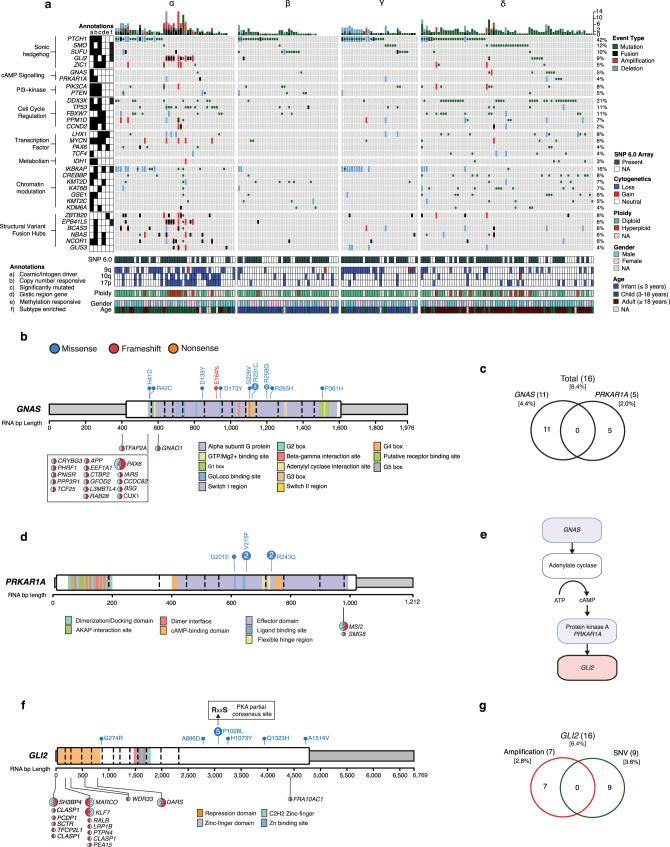
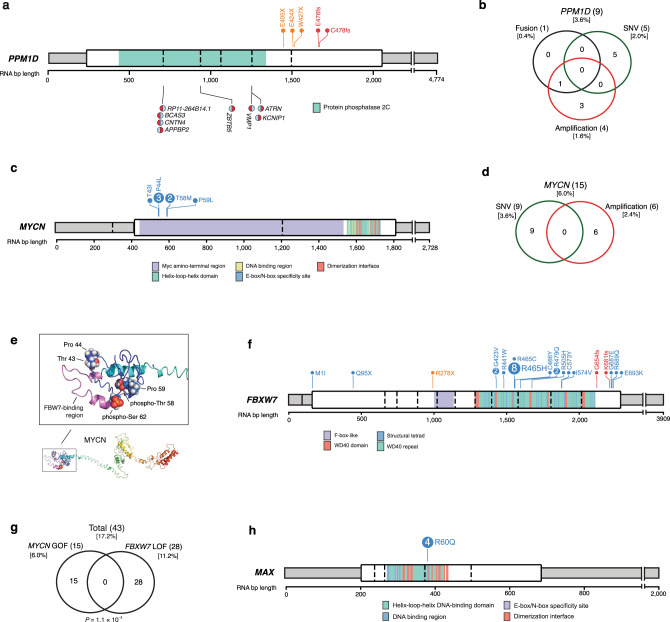
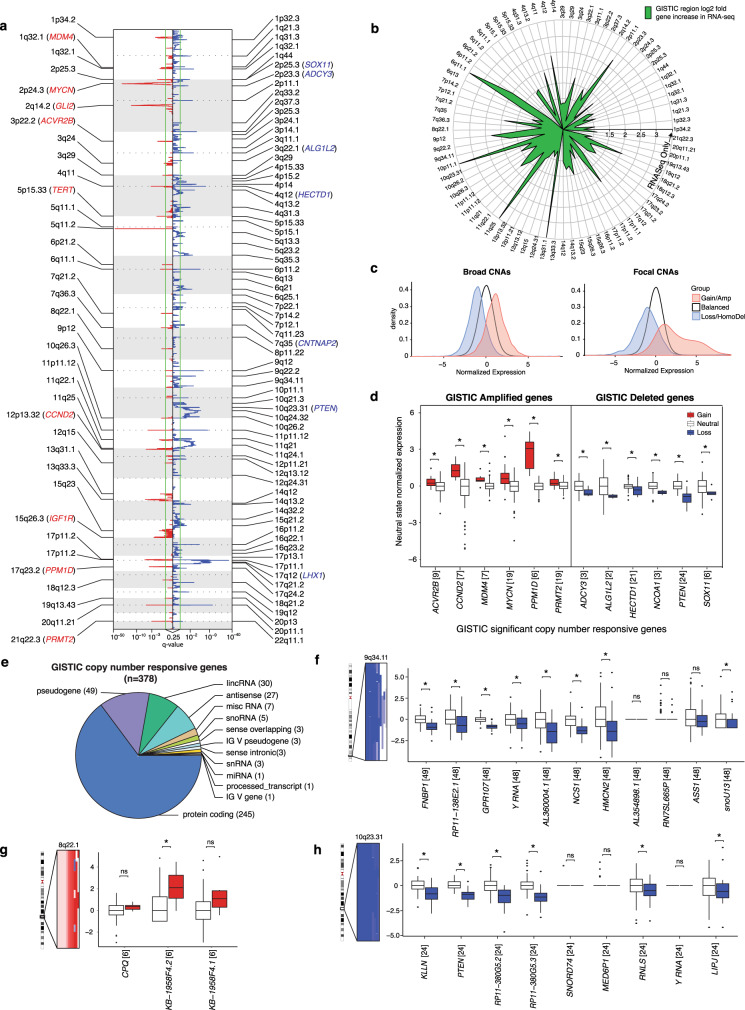
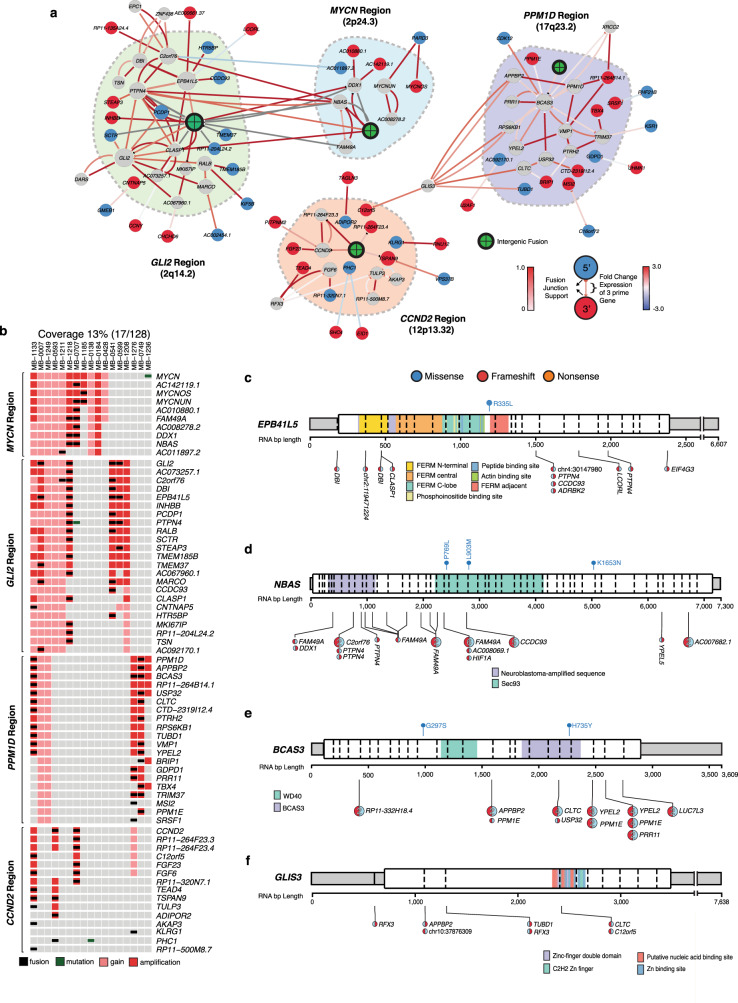
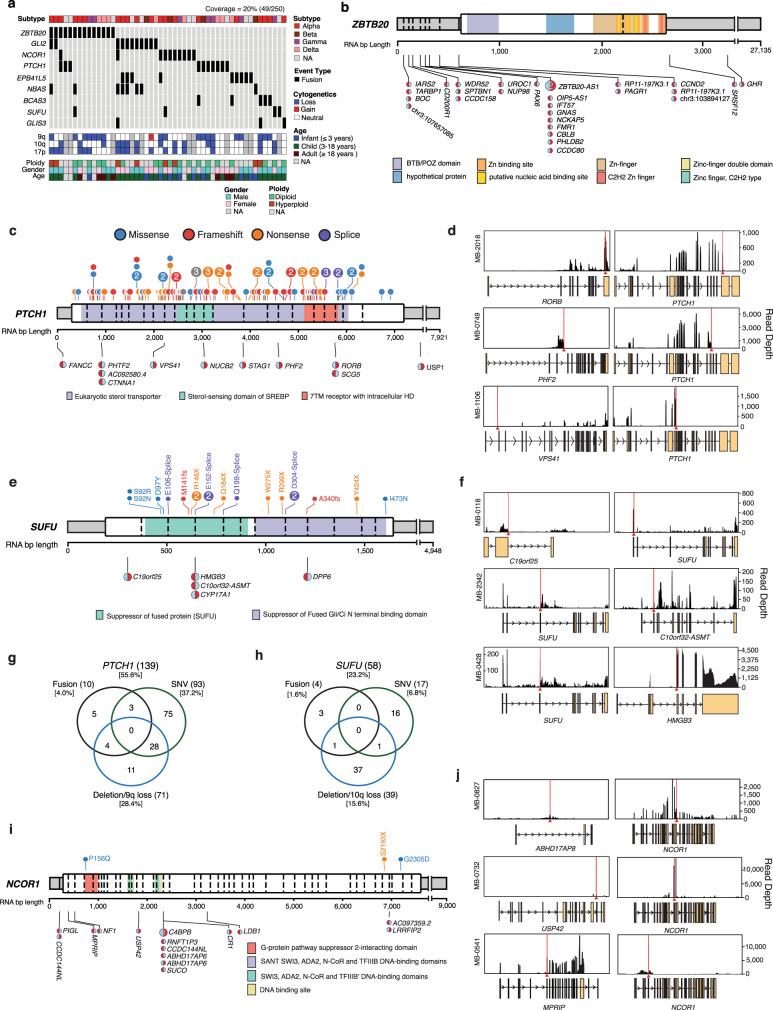
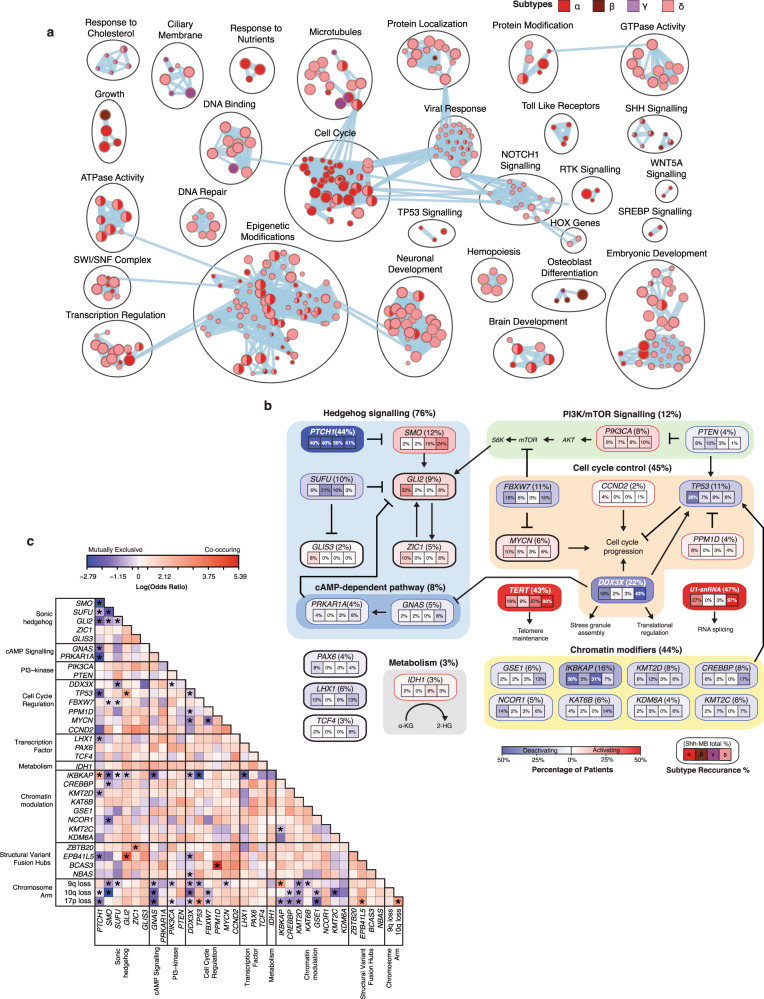
Sonic hedgehog medulloblastoma encompasses a clinically and molecularly diverse group of cancers of the developing central nervous system. Here, we use unbiased sequencing of the transcriptome across a large cohort of 250 tumors to reveal differences among molecular subtypes of the disease, and demonstrate the previously unappreciated importance of non-coding RNA transcripts. We identify alterations within the cAMP dependent pathway (GNAS, PRKAR1A) which converge on GLI2 activity and show that 18% of tumors have a genetic event that directly targets the abundance and/or stability of MYCN. Furthermore, we discover an extensive network of fusions in focally amplified regions encompassing GLI2, and several loss-of-function fusions in tumor suppressor genes PTCH1, SUFU and NCOR1. Molecular convergence on a subset of genes by nucleotide variants, copy number aberrations, and gene fusions highlight the key roles of specific pathways in the pathogenesis of Sonic hedgehog medulloblastoma and open up opportunities for therapeutic intervention.


Conflict of interest statement

The authors declare no competing interests.

Figures

Fig. 1
Fig. 1. Importance of the non-coding transcriptome in Shh-MB.
a Overview of Shh-MB RNA-seq samples and overlapping data sources. b Heatmap of the sample-to-sample fused network (SNF) by cluster (k = 4, n = 250). Sample similarity is represented by red (less similar) to yellow (more similar) coloring inside the heatmap. c Subtype clusters obtained by Similar Network Fusion (k = 4) using Affymetrix expression + 450 K methylation and RNA-seq + 450 K methylation (n = 196). Relationships between clustering methods are indicated by gray bars between columns. d Biotype distribution amongst all genes (top) as compared to genes that differentiate subtypes (significant normalized mutual information (NMI) from SNF RNA-seq + 450 K methylation), in both RNA-seq and microarray datasets (middle) or restricted to only the RNA-seq dataset (bottom). e Differentially expressed genes per subtype (RNA-seq). Genes found only with RNA-seq data are indicated. f Enrichment map of biological processes and pathways in Shh-MB subtypes. Each node represents a pathway or process and connecting lines represent common genes between them. Nodes with many shared genes are grouped together and labeled with a biological theme. The color of the nodes refers to the subtype(s) in which the process is enriched. The size of the node is proportional to the number of genes in the process.
Fig. 2
Fig. 2. cAMP-dependent pathway alterations converge on GLI2 activity.
a Oncoprint summaries of all fusion, mutation, and copy number data (n = 196). Subtypes are denoted above. NA, not available. b Gene-level summary of GNAS events. c Mutual exclusivity of GNAS and PRKAR1A LOF events. LOF events include mutations and homozygous deletions. d Gene-level summary of PRKAR1A events. e cAMP dependant signaling pathway schematic. Red indicates activating alterations while blue indicates inactivating alterations. f, g Gene-level summary of (f) GLI2 events and (g) their overlaps. Mutations in f are shown as lollipop diagrams above the gene schematic and fusion events are shown below. The 5 prime and 3 prime orientation of the fusion transcript is indicated by the color orientation. In cases where GLI2 is the 3 prime partners, the fusion lollipop is red on the right.
Fig. 3
Fig. 3. Alterations in cell cycle control genes.
a, b Gene-level summary of (a) PPM1D events and (b) their overlaps. c Gene-level summary of MYCN events. Only mutations in the canonical isoform NM_005378 are shown. d Overlap of MYCN fusion, amplification, and SNV events. e Structural model of MYCN highlighting positions affected by hotspot mutations (blue) near the FBWX7 protein binding region (purple), and phospho-degron positions (red). f Gene-level summary of FBXW7 events. g Mutual exclusivity of MYCN gain-of-function (GOF) and FBXW7 loss-of-function (LOF) events. P-value calculated using the DISCOVER package. GOF and LOF events include both high-level CNA and mutation events. h Gene-level summary of MAX events.
Fig. 4
Fig. 4. Somatic copy number aberrations in Shh-MB.
a GISTIC significant amplifications (red) and deletions (blue) observed in Shh-MB (n = 126). b Log2 fold increase of known annotated gene in GISTIC regions using RNA-seq compared to expression arrays. GISTIC regions with genes only found in the RNA-seq dataset have points on the outermost circle. c Normalized expression density across broad and focal CNAs. d Expression difference between copy number neutral and aberrant states in GISTIC region copy number responsive genes. Each gene was normalized by its neutral copy number state distribution. Numbers in square brackets denote the number of patients detected with the CNA. The lower and upper hinges in the boxplot correspond to the first and third quartiles while the center line represents the median. The upper and lower whisker extends from the nearest hinge to the smallest/largest value at most 1.5 times the interquartile range. Points outside this range are outliers and are plotted individually. e GISTIC copy number responsive gene types. fh Expression difference between copy number neutral and aberrant states in (f) 9q34.11, (g) 8q22.1, and (h) 10q23.31. Asterisks annotate significant copy number responsive genes (FDR < 0.05) calculated using a Kruskal-Wallis rank-sum test. Please refer to Supplementary Data 5 for exact P-values. The SNP 6.0 copy number segments are shown to the left of each graph. The expression of each gene was normalized by the expression median of the neutral copy number state.
Fig. 5
Fig. 5. Fusion networks within somatic recurrently amplified regions.
a The network of gene fusions in focally amplified regions. Node color signifies the most common orientation of the fusion gene, 5 prime (blue), 3 prime (red), or both (gray). The arrow and base color show the proportion of chimeric reads compared to wildtype supporting the fusion. The arrow line color shows the difference in expression of the 3 prime fusion partners compared to patients without the detected fusion. b Oncoprint of fusions depicted in focally amplified regions illustrated in a. cf Gene-level summary of (c) EPB41L5, (d) NBAS, (e) BCAS3, and (f) GLIS3 events. Refer to Fig. 2b for schema description.
Fig. 6
Fig. 6. Recurrent fusions in Shh-MB.
a Oncoprint of fusions detected in focally amplified regions and known Shh-MB tumor suppressors. NA, not available. b Gene-level summary of ZBTB20 events. Mutations are shown as lollipop diagrams above the gene schematic and fusion events are shown below. The 5 prime and 3 prime orientation of the fusion transcript is indicated by the color orientation. In cases where ZBTB20 is the 3 prime partners, the fusion lollipop is red on the right. c Gene-level summary of PTCH1 events. d Read depth diagrams of representative PTCH1 fusion events. e Gene-level summary SUFU events. f Read depth diagrams of representative SUFU fusion events. g Overlap of PTCH1 fusion, amplification, and mutation events. h Overlap of SUFU fusion, amplification, and mutation events. I Gene-level summary of NCOR1 events. j Read depth diagrams of representative NCOR1 fusion events.
Fig. 7
Fig. 7. Landscape of oncogenic alterations in Shh-MB.
a Enrichment map of biological processes and pathways affected by mutation or focal amplifications/deletions in Shh-MB subtypes. Each node represents a pathway or process and connecting lines represent common genes between them. Nodes with many common genes are clustered together and labeled with a biological theme. The node color refers to the subtype(s) in which the process is enriched. The size of the node is proportional to the quantity of genes in the process. Enriched processes were determined using g:Profiler (FDR < 0.05) and visualized in Cytoscape using the Enrichment Map app. b Percentage of altered genes and pathways integrating mutation, high-level copy number, and fusion data. Alteration frequencies are expressed as percentages of all cases per subtype (n = 196) in the boxes and total percentage across Shh-MB (n = 250) in parenthesis beside each gene name. Red indicates activating alterations while blue indicates inactivating alterations. TERT and U1-snRNA alternation percentages were obtained from earlier published studies,. c Co-occurrence (red) and mutual exclusivity (blue) among the major Shh-MB driver genes and chromosomal arm events (n = 250). Mutually exclusive P-values were calculated using the DISCOVER package with FDR < 0.01. Significant Co-occurring genes were found using a two-sided Fisher Exact-Test with FDR < 0.01 and odds ratio >1. Exact P-values can be found in Supplementary Data 8.

References

    1. Stucklin ASG, Ramaswamy V, Daniels C, Taylor MD. Review of molecular classification and treatment implications of pediatric brain tumors. Curr. Opin. Pediatr. 2018;30:3–9. doi: 10.1097/MOP.0000000000000562. - DOI - PubMed
    1. Taylor MD, et al. Molecular subgroups of medulloblastoma: the current consensus. Acta Neuropathol. 2012;123:465–472. doi: 10.1007/s00401-011-0922-z. - DOI - PMC - PubMed
    1. Cavalli FMG, et al. Intertumoral heterogeneity within medulloblastoma subgroups. Cancer Cell. 2017;31:737–754.e6. doi: 10.1016/j.ccell.2017.05.005. - DOI - PMC - PubMed
    1. Suzuki H, et al. Recurrent noncoding U1 snRNA mutations drive cryptic splicing in SHH medulloblastoma. Nature. 2019;574:707–711. doi: 10.1038/s41586-019-1650-0. - DOI - PMC - PubMed
    1. He X, et al. The G protein α subunit Gαs is a tumor suppressor in Sonic hedgehog−driven medulloblastoma. Nat. Med. 2014;20:1035–1042. doi: 10.1038/nm.3666. - DOI - PMC - PubMed

Publication types

LinkOut - more resources