. 2021 Mar 19;12(1):1747.
doi: 10.1038/s41467-021-21549-x.

Melanoma subpopulations that rapidly escape MAPK pathway inhibition incur DNA damage and rely on stress signalling

Affiliations

Melanoma subpopulations that rapidly escape MAPK pathway inhibition incur DNA damage and rely on stress signalling

Chen Yang et al. Nat Commun. .

Abstract

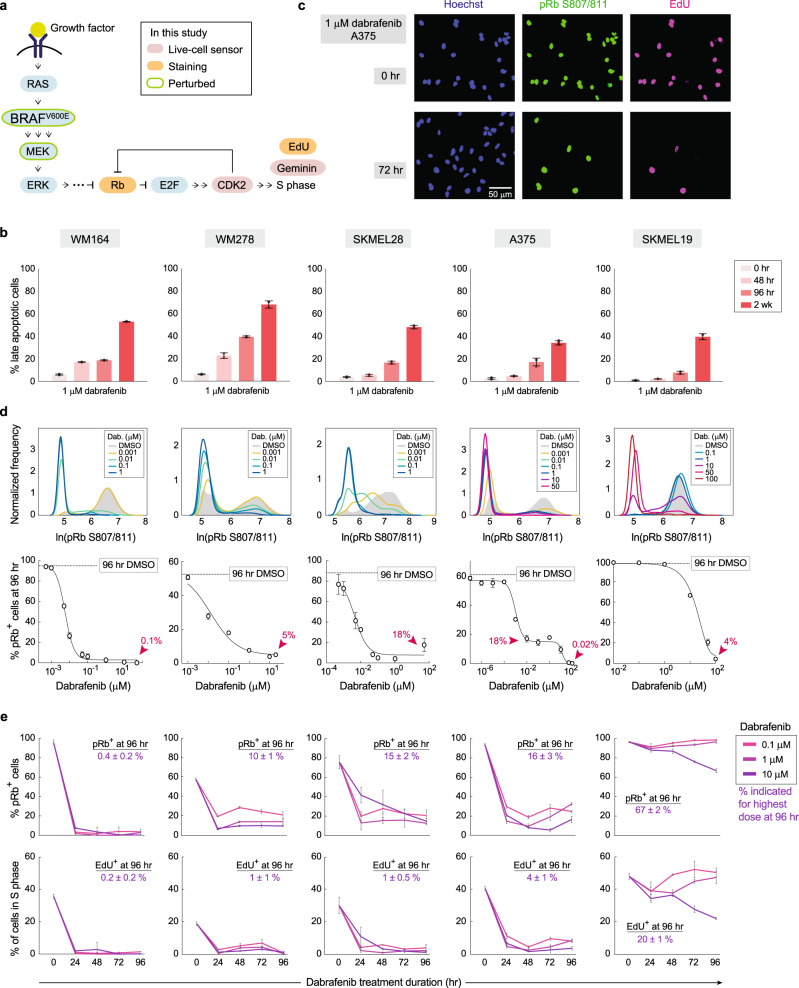
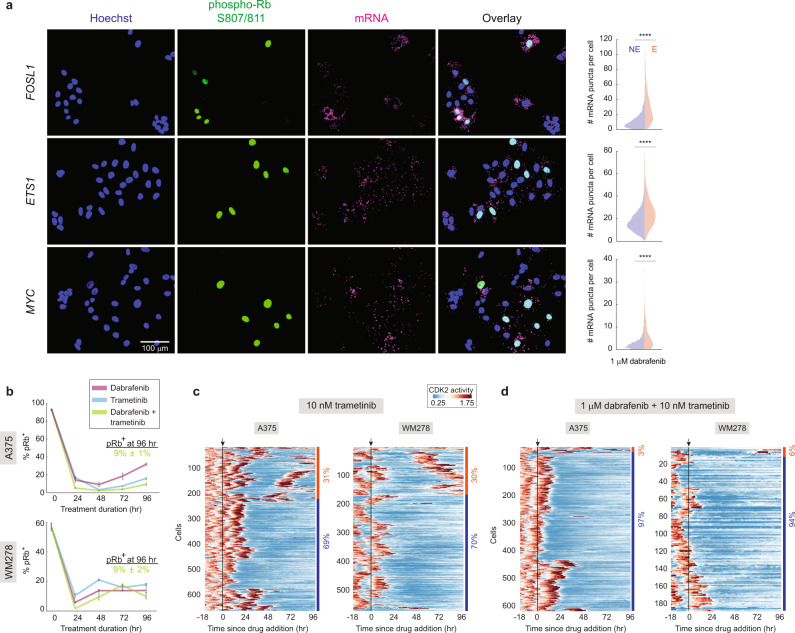
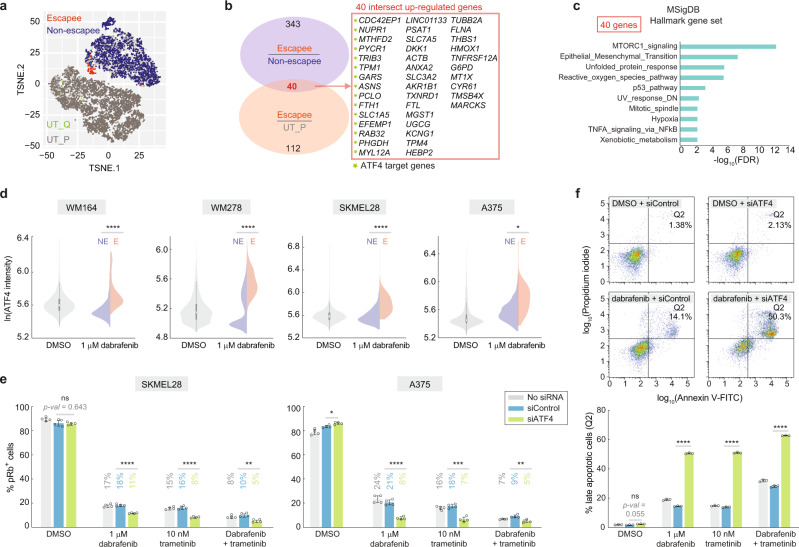
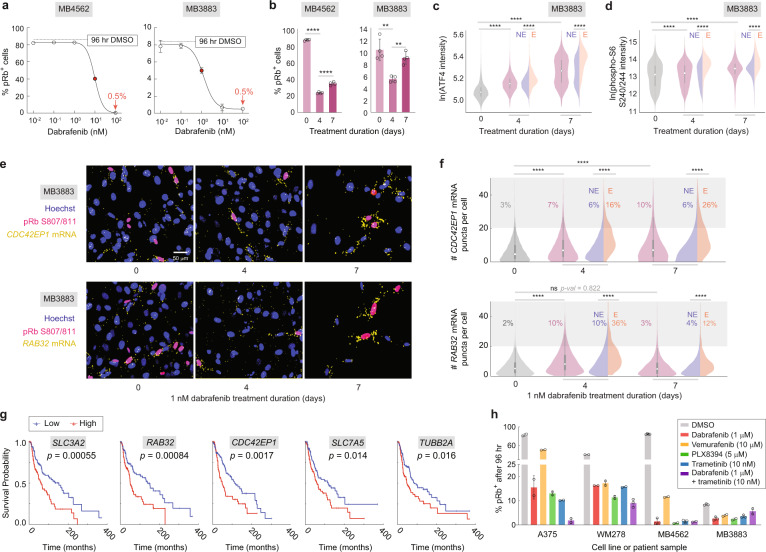
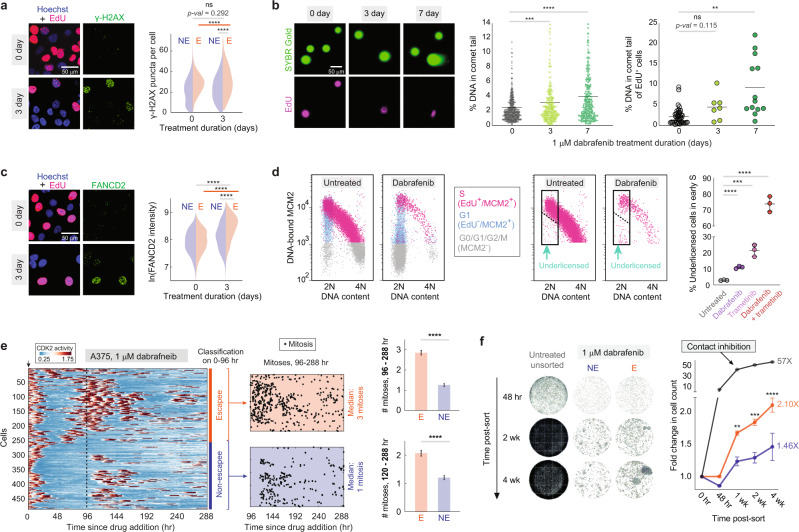
Despite the increasing number of effective anti-cancer therapies, successful treatment is limited by the development of drug resistance. While the contribution of genetic factors to drug resistance is undeniable, little is known about how drug-sensitive cells first evade drug action to proliferate in drug. Here we track the responses of thousands of single melanoma cells to BRAF inhibitors and show that a subset of cells escapes drug via non-genetic mechanisms within the first three days of treatment. Cells that escape drug rely on ATF4 stress signalling to cycle periodically in drug, experience DNA replication defects leading to DNA damage, and yet out-proliferate other cells over extended treatment. Together, our work reveals just how rapidly melanoma cells can adapt to drug treatment, generating a mutagenesis-prone subpopulation that expands over time.


Conflict of interest statement

The authors declare no competing interests.

Figures

Fig. 1
Fig. 1. Proliferation cannot be fully repressed in dabrafenib-treated melanoma cells.
a Schematic diagram of MAPK-dependent cell-cycle entry. b Apoptotic cell quantification by flow cytometric analyses of Annexin V-FITC and propidium iodide staining. Quantified replicates of late-apoptotic cells in 1-µM dabrafenib are shown for the indicated time points for five different melanoma cell lines. Error bars: mean ± std of at least two biological replicates, representative of two experimental repeats. c A375 cells treated with 1-μM dabrafenib for 0 or 72 h and stained for proliferation markers phospho-Rb and EdU, and with Hoechst to mark nuclei. d Probability density of phospho-Rb S807/811 intensity in five melanoma cell lines. Dose–response curves showing the percent pRb+ cells after 96 h of dabrafenib treatment, determined by immunofluorescence quantification. For A375, the untreated 96-h DMSO line falls at 60% (compared with 95% reported elsewhere in this study when cells were plated 24 h before fixation) because 96 h of unfettered growth on the plate results in partial contact inhibition. Error bars: as mean ± std of three replicate wells. e Percentage of pRb+ and EdU+ cells in five melanoma cell lines treated for the indicated drug doses and lengths of time; value of % positive cells is noted for the highest dose at 96 h. Error bars: mean ± std of three replicate wells. pRb+ and EdU+ cells were defined by Otsu’s thresholding. Source data are provided as a Source Data file.
Fig. 2
Fig. 2. A subpopulation of melanoma cells can rapidly and reversibly escape BRAF inhibition.
a Schematic of CDK2 sensor. Adapted from refs. ,,, with permission from Elsevier. b Representative single-cell traces of CDK2 activity in an untreated A375 cell (upper panel), and a 1-µM dabrafenib-treated escapee and non-escapee (lower panel). c Heatmap of single-cell CDK2 activity traces in 1-µM dabrafenib-treated A375 and WM278 cells. Each row represents the CDK2 activity in a single-cell over time according to the colormap. Apoptotic cells (Supplementary Fig. 1c) are not included in the heatmap. The percentages mark the proportion of cells with each behaviour. Arrow and black line mark the time of drug addition. d Schematic diagram of the drug holiday experimental setup described in the text. e Cell count over time as measured by time-lapse microscopy after a 24-h drug holiday; each condition was measured in triplicate and plotted individually.
Fig. 3
Fig. 3. The MAPK pathway is reactivated in escapees.
a Representative RNA-FISH images for FOSL1, ETS1 and MYC with phospho-Rb (S807/811) and Hoechst staining in A375 cells treated with 1-µM dabrafenib for 72 h. Split violin plots show the number of mRNA puncta in escapees (E) or non-escapees (NE). b Quantification of percentage of pRb+ cells in A375 and WM278 cells treated for the indicated durations with 1-µM dabrafenib or 10-nM trametinib alone or in combination. The percentage of pRb+ cells under the combined treatment at 96 h is noted. Error bars: mean ± std of three replicate wells. c, d Heatmap of single-cell CDK2 activity traces in 10-nM trametinib alone or combination of dabrafenib and trametinib, in A375 and WM278 cells. Each row represents the CDK2 activity in a single cell over time according to the colormap. Apoptotic cells are not included in the heatmap. The percentages mark the proportion of cells with each behaviour. Arrow and black line mark the time of drug addition. Source data are provided as a Source Data file.
Fig. 4
Fig. 4. scRNA-seq reveals upregulation of ATF4 stress signalling in escapees.
a Co-visualization of untreated (bottom left) and treated (top right) scRNA-seq datasets on a single t-SNE plot, showing escapees in orange and non-escapees in blue (see Supplementary Fig. 3d for classification of escapee and non-escapee). Untreated proliferative cells (UT-P) and quiescent cells (UT-Q) were coloured grey and green, respectively. Escapees can be identified as a small orange peninsula in the treated condition. b Venn diagram of differentially expressed genes as described in the text. Genes labelled with a green star are ATF4 target genes. c MSigDB hallmark gene set enrichment analysis of the 40 genes using the false-discovery rate cutoff of 0.05. d Violin plot showing ATF4 protein levels by immunofluorescence in four melanoma cell lines treated with 1-µM dabrafenib for 72 h. Split violin shows ATF4 levels in non-escapees (NE) and escapees (E) identified by phospho-Rb (S780) co-staining. Each population value is pooled from three replicate wells. e The percentage of pRb+ cells in the indicated conditions. Cells were treated for 72 h. Error bars: mean ± std of four replicate wells, representative of two experimental repeats. f Percentage of late-apoptotic A375 cells with or without ATF4 knockdown, after a 96-h treatment with the indicated drugs. Error bars: mean ± std of three biological replicates, representative of two experimental repeats. Source data are provided as a Source Data file.
Fig. 5
Fig. 5. Individual ATF4 target genes are involved in escape from dabrafenib-induced quiescence.
a Visualization of single-cell CDC42EP1 and RAB32 mRNA expression levels on the combined t-SNE plot showing increased expression in the peninsula containing escapees. b Representative RNA-FISH images for CDC42EP1 or RAB32 with phospho-Rb (S807/811) and Hoechst staining. c Violin plot showing the number of mRNA puncta for CDC42EP1 or RAB32 in A375 cells treated under the indicated conditions for 72 h. The percentage of cells with >20 mRNA puncta is indicated on the plot. Each population value is pooled from two replicate wells. d The percentage of pRb+ cells in the indicated conditions. A375 cells were treated for 72 h. Error bars: mean ± std of four biological replicates, representative of two experimental repeats. Source data are provided as a Source Data file.
Fig. 6
Fig. 6. Existence of escapees and upregulation of ATF4 target genes in clinical samples.
a Dose–response curves at 96 h of treatment in two ex vivo patient cultures, noting a residual 0.5% of pRb+ cells at the highest dose. Approximate IC50 values are displayed as red dots. Error bars: mean ± std of three replicate wells. b Percentage of pRb+ cells in the two patient samples treated with IC50 dose of dabrafenib for 4 or 7 days. Error bars: mean ± std of four replicate wells, representative of two experimental repeats. c, d Violin plots showing ATF4 and phospho-S6 (S240/244) levels by immunofluorescence in MB3883 patient cells treated with 1-nM dabrafenib for 0, 4 or 7 days. Escapees are identified by phospho-Rb (S780) or EdU co-staining for ATF4 or phospho-S6, respectively. Each population value is pooled from six replicate wells. e RNA-FISH images for CDC42EP1 and RAB32 with pRb (S807/811) and Hoechst staining, for MB3883 cells cultured in 1-nM dabrafenib for 0, 4 or 7 days. f Violin plots showing the number of CDC42EP1 or RAB32 mRNA puncta in MB3883 cells. The percentage of cells with >20 mRNA puncta is indicated on the plot. Each population value is pooled from two replicate wells. g Melanoma patient survival curves for 5 of 40 genes upregulated in escapees. p value: log-rank test. h Percentage of pRb+ cells in A375, WM278 and two ex vivo patient cultures treated with high doses of dabrafenib, vemurafenib, PLX8394, trametinib or dabrafenib plus trametinib for 4 days. Error bars: mean ± std of at least two replicate wells, representative of two experimental repeats. Source data are provided as a Source Data file.
Fig. 7
Fig. 7. Escapees are prone to DNA damage and outgrow non-escapees over extended drug treatment.
a Images of A375 cells treated with 1-µM dabrafenib for 72 h stained for EdU and γ-H2AX. Quantification of γ-H2AX puncta for escapees (E) and non-escapees (NE) is plotted as split violins. n = 2 biologically independent experiments. b Neutral comet assay in dabrafenib-treated A375 cells. Gels were co-stained for EdU incorporation. Plots indicate percent tail intensity over each entire comet, with mean values displayed as a horizontal line. Left panel: 0, 3 and 7 days, n = 708, 375 and 394 cells. Right panel: 0, 3 and 7 days, n = 40, 7 and 13 cells. c Images of A375 cells treated with 1-µM dabrafenib for 72 h stained for EdU and FANCD2. Quantification of FANCD2 intensity for escapees and non-escapees is plotted as split violins. n = 2 biologically independent experiments. d Flow cytometric analysis of DNA replication licensing determined by chromatin-bound MCM2 in A375 cells treated with BRAF and/or MEK inhibitors. Cells appearing under the dashed line show reduced MCM2 loading at the start of S phase. Right-most plot shows percent under-licensed cells relative to all early S phase cells; mean ± std of three replicate samples. e CDK2 activity heatmap for 482 dabrafenib-treated single cells tracked over 12 days. Cell behaviour was classified based on the first 96 h, and subsequent mitosis events are plotted as black dots. Bar plot quantifies the average number of mitoses per cell in the final 7 or 8 days of filming. Error bars: mean ± SEM. n (E; NE) = 248; 234 cells. f Escapees (Gem+) and non-escapees (Gem) cells were separated by FACS after a 72 h of 1-µM dabrafenib treatment and were then continuously cultured in 1-µM dabrafenib for 4 weeks. Representative wells for each condition at different time points are shown. Normalized cell count for each well was quantified and plotted for each condition; mean ± SEM of seven replicate wells. The p value summary represents the comparison between E and NE replicates by unpaired t-test. Source data are provided as a Source Data file.
Fig. 8
Fig. 8. Model describing how rapid, non-genetic drug adaptation can lead to bona fide drug resistance.
Dabrafenib-treated melanoma cells initially use non-genetic mechanisms, such as ATF4 stress signalling, to adapt to and escape from drug-induced quiescence. These early drug-adapted escapees incur DNA damage while cycling in drug, yet out-proliferate non-escapees over extended drug treatment. Thus, escapees are more likely than non-escapees to acquire the genetic mutations that lead to permanent drug resistance.

References

    1. Davies H, et al. Mutations of the BRAF gene in human cancer. Nature. 2002;417:949–954. doi: 10.1038/nature00766. - DOI - PubMed
    1. Massagué J. G1 cell-cycle control and cancer. Nature. 2004;432:298–306. doi: 10.1038/nature03094. - DOI - PubMed
    1. Hauschild A, et al. Dabrafenib in BRAF-mutated metastatic melanoma: a multicentre, open-label, phase 3 randomised controlled trial. Lancet Lond. Engl. 2012;380:358–365. doi: 10.1016/S0140-6736(12)60868-X. - DOI - PubMed
    1. Luebker SA, Koepsell SA. Diverse mechanisms of BRAF inhibitor resistance in melanoma identified in clinical and preclinical studies. Front. Oncol. 2019;9:268. doi: 10.3389/fonc.2019.00268. - DOI - PMC - PubMed
    1. Wagle N, et al. Dissecting therapeutic resistance to RAF inhibition in melanoma by tumor genomic profiling. J. Clin. Oncol. J. Am. Soc. Clin. Oncol. 2011;29:3085–3096. doi: 10.1200/JCO.2010.33.2312. - DOI - PMC - PubMed

Publication types