. 2021 Mar 19;12(1):1720.
doi: 10.1038/s41467-021-21961-3.

An endothelial activin A-bone morphogenetic protein receptor type 2 link is overdriven in pulmonary hypertension

Affiliations

An endothelial activin A-bone morphogenetic protein receptor type 2 link is overdriven in pulmonary hypertension

Gusty R T Ryanto et al. Nat Commun. .

Abstract

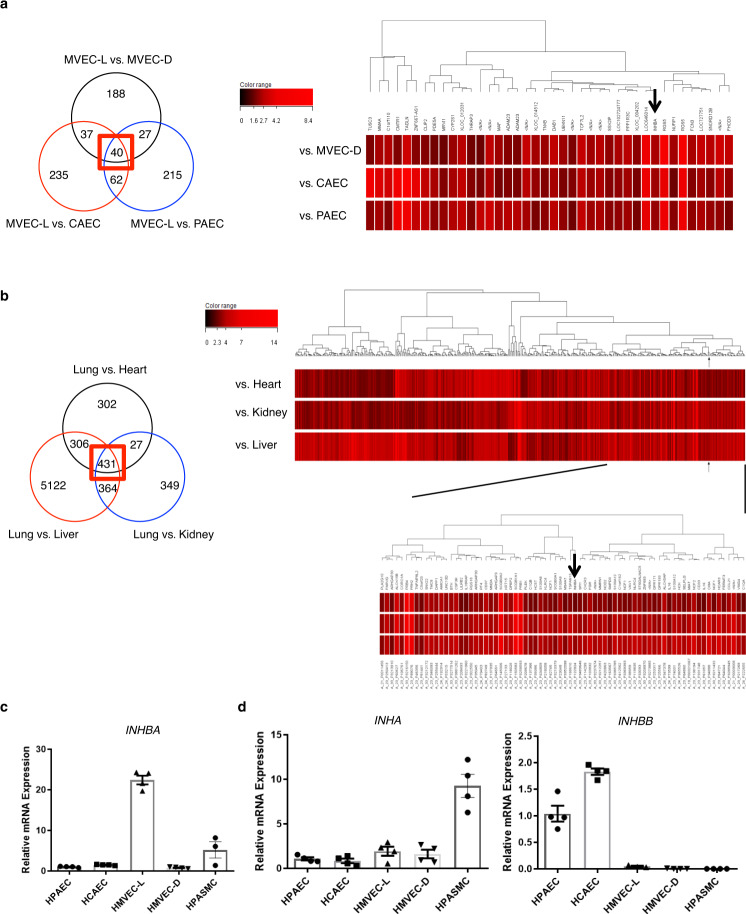
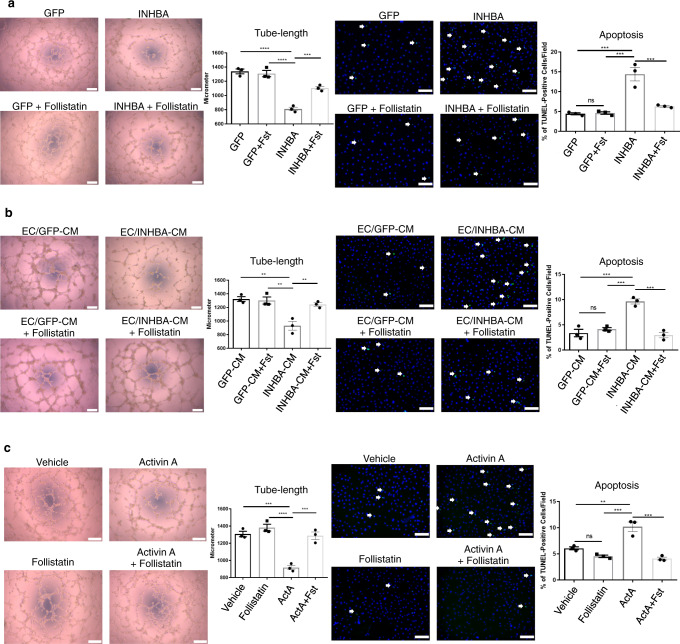
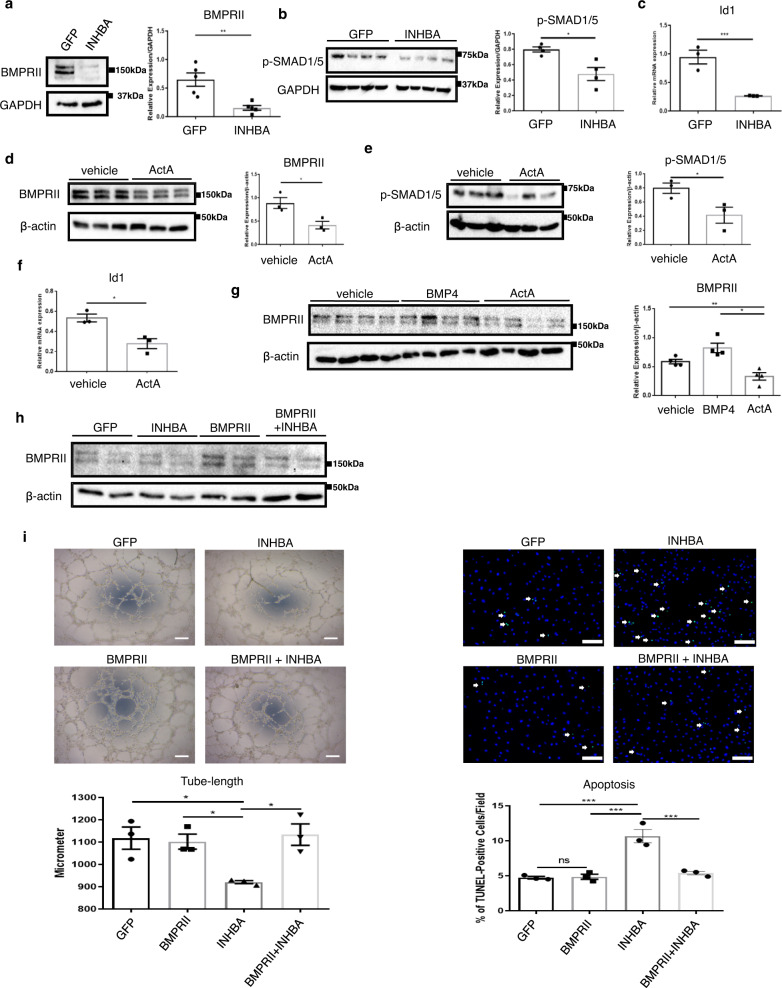
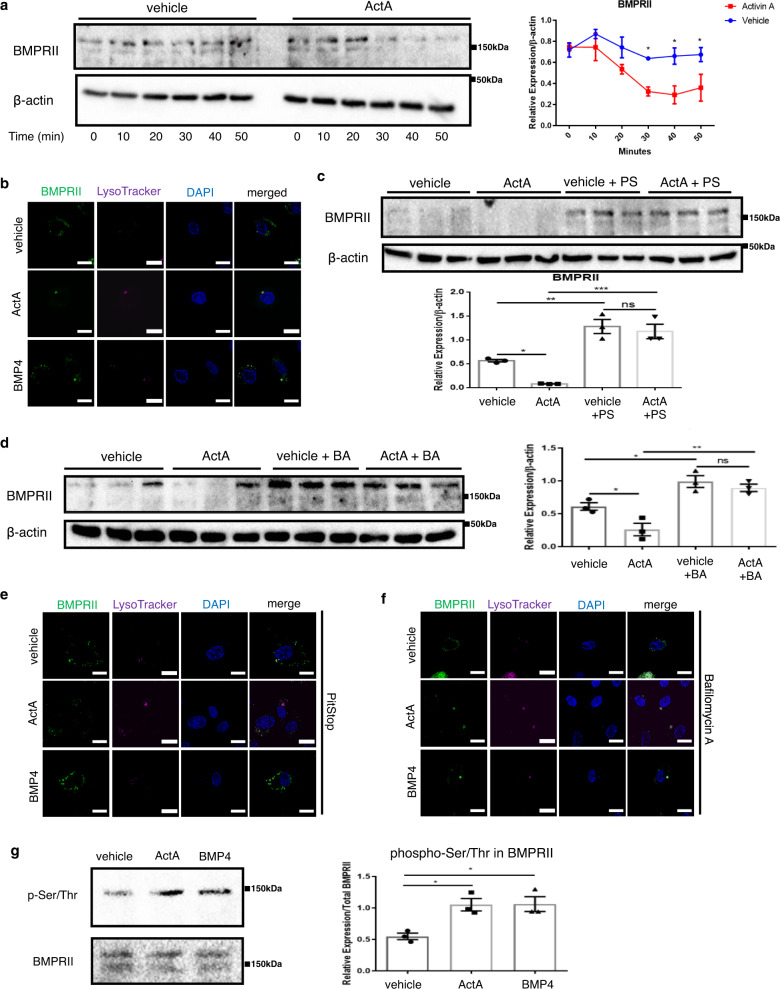
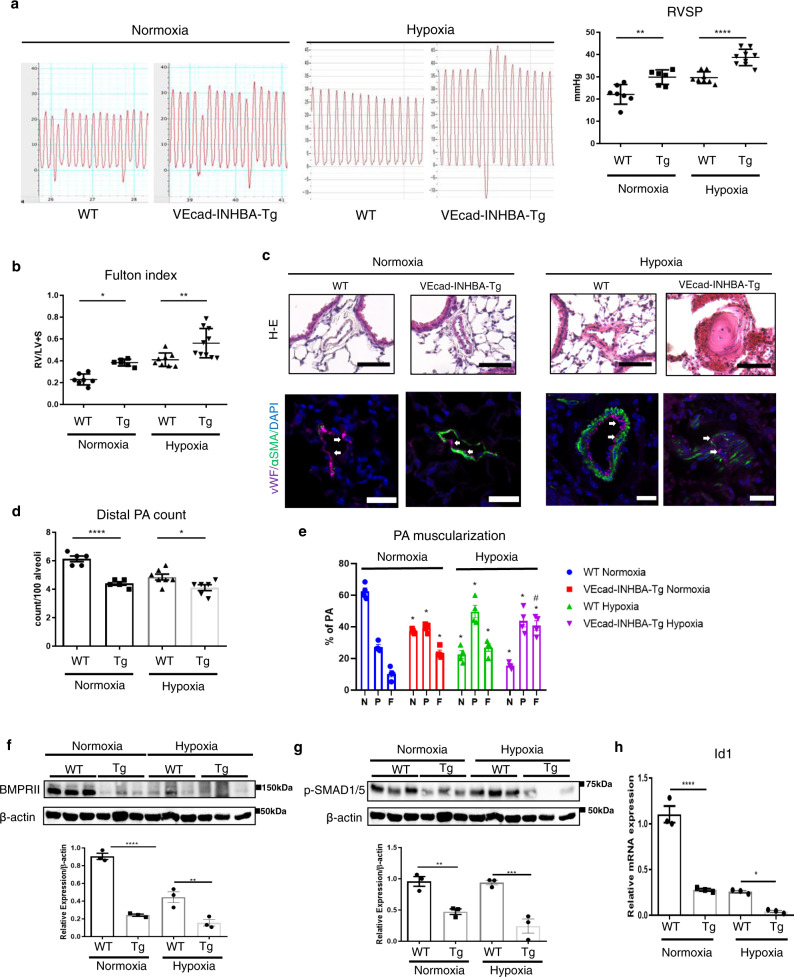
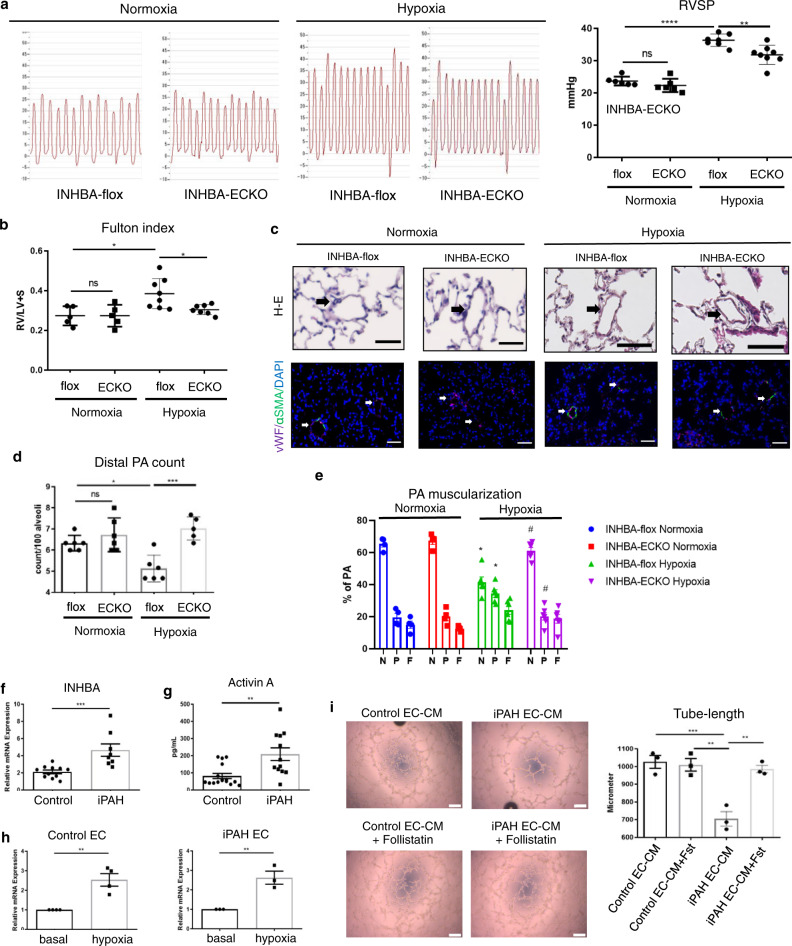
Pulmonary arterial hypertension is a progressive fatal disease that is characterized by pathological pulmonary artery remodeling, in which endothelial cell dysfunction is critically involved. We herein describe a previously unknown role of endothelial angiocrine in pulmonary hypertension. By searching for genes highly expressed in lung microvascular endothelial cells, we identify inhibin-β-A as an angiocrine factor produced by pulmonary capillaries. We find that excess production of inhibin-β-A by endothelial cells impairs the endothelial function in an autocrine manner by functioning as activin-A. Mechanistically, activin-A induces bone morphogenetic protein receptor type 2 internalization and targeting to lysosomes for degradation, resulting in the signal deficiency in endothelial cells. Of note, endothelial cells isolated from the lung of patients with idiopathic pulmonary arterial hypertension show higher inhibin-β-A expression and produce more activin-A compared to endothelial cells isolated from the lung of normal control subjects. When endothelial activin-A-bone morphogenetic protein receptor type 2 link is overdriven in mice, hypoxia-induced pulmonary hypertension was exacerbated, whereas conditional knockout of inhibin-β-A in endothelial cells prevents the progression of pulmonary hypertension. These data collectively indicate a critical role for the dysregulated endothelial activin-A-bone morphogenetic protein receptor type 2 link in the progression of pulmonary hypertension, and thus endothelial inhibin-β-A/activin-A might be a potential pharmacotherapeutic target for the treatment of pulmonary arterial hypertension.


Conflict of interest statement

The authors declare no competing interests.

Figures

Fig. 1
Fig. 1. Identification of inhibin-β-A as a gene highly expressed in lung microvasculature.
a Genes whose expression in MVECs-L was three times greater than in MVECs-D, CAECs, or PAECs were separately identified through the DNA microarray analysis. Venn diagram analysis of these genes was shown. Numbers indicate the number of genes included in the sets of the intersections. We focused on genes whose expression in MVECs-L was three times greater than in all of MVEC-Ds, CAECs, and PAECs (the center intersection surrounded by red box). The heat map of these particular genes was shown. Arrow indicates INHBA. b Genes whose expression in the lung was five times greater than in the heart, kidney, or liver were separately identified through the DNA microarray analysis. Venn diagram analysis of these genes was shown. Numbers indicate the number of genes included in the sets of the intersections. We focused on genes whose expression in the lung was five times greater than in all of the heart, kidney, and liver (the center intersection surrounded by red box). The heat map of these particular genes was shown. Arrow indicates INHBA. c, d Quantitative PCR analysis for inhibin-β-A (INHBA) (b), and inhibin-β-B (INHBB), and inhibin-α (INHA) (c) in ECs and SMCs isolated from various vascular beds (n = 4 biologically independent cells in each group). HPAEC human pulmonary artery EC, HCAEC human coronary artery EC, HMVEL-D human microvascular EC in dermis, HPASMC human pulmonary artery SMC. Data are presented as the mean ± SEM.
Fig. 2
Fig. 2. Excess INHBA/ActA-mediated angiocrine inhibits the angiogenic capacity in PAECs.
a Representative images and quantitation of tube length in a Matrigel tube-formation assay (n = 3 biologically independent values in each group) and apoptosis induced by serum starvation assessed by TUNEL staining (n = 3 biologically independent cells in each group) in PAECs transfected with either GFP or INHBA in the presence or absence of recombinant Follistatin (100 ng/mL). TUNEL-positive apoptotic cells are indicated by arrows. b Representative images and quantitation of a Matrigel tube-formation assay and apoptosis induced by H2O2 (200 μM/mL) in PAECs treated with conditioned medium (CM) derived from PAECs transfected with either GFP or INHBA in the presence or absence of recombinant Follistatin (100 ng/mL) (n = 3 biologically independent values in each group). TUNEL-positive apoptotic cells are indicated by arrows. c Representative images and quantitation of a Matrigel tube-formation assay (n = 3 biologically independent values in each group) and apoptosis (n = 3 biologically independent cells in each group) in PAECs treated with vehicle or ActA (20 ng/mL) in the presence or absence of recombinant Follistatin (100 ng/mL). TUNEL-positive apoptotic cells are indicated by arrows. Bars: 200 μm (tube-formation assays); 100 μm (apoptosis assays). ****P < 0.0001; ***P < 0.001; **P < 0.01; *P < 0.05. Exact P values are shown in the Source data file. Data are presented as the mean ± SEM. One-way ANOVA with Tukey’s post hoc test for multiple comparisons was used to compare the tube lengths and apoptotic cell counts between each group for all the figures.
Fig. 3
Fig. 3. Overabundance of INHBA/ActA impairs the EC function by reducing BMPRII.
a, b Representative immunoblots and densitometric analysis for BMPRII (a) (n = 5 biologically independent cells in each group) and phospho-SMAD1/5 (b) (n = 3 in each group) in PAECs transfected with either GFP or INHBA. c Quantitative PCR for Id1 in PAECs transfected with either GFP or INHBA (n = 3 biologically independent cells in each group). d, e Representative immunoblots and densitometric analysis for BMPRII (d) (n = 4 in each group) and phospho-SMAD1/5 (e) (n = 3 biologically independent cells in each group) in PAECs treated with either vehicle or ActA (20 ng/mL) for 6 h. f Quantitative PCR for Id1 in PAECs treated with either vehicle or ActA (n = 3 biologically independent cells in each group). g Representative immunoblots and densitometric analysis of BMPRII in PAECs treated with either vehicle, BMP-4 (20 ng/mL), or ActA (20 ng/mL) for 6 h (n = 4 biologically independent cells in each group). h Immunoblotting for BMPRII in PAECs transfected with either GFP, INHBA, BMPRII, or both INHBA and BMPRII. Similar results were obtained in three independent experiments. i Matrigel tube-formation assay (n = 3 biologically independent values in each group) and TUNEL staining for apoptosis (n = 3 biologically independent cells in each group) in PAECs transfected with either GFP, INHBA, BMPRII, or both INHBA and BMPRII. Arrows indicate TUNEL-positive apoptotic cells. Bars: 200 μm (tube-formation assay); 100 μm (apoptosis assay). ***P < 0.001; **P < 0.01; *P < 0.05; #, not significant (P > 0.05). Exact P values are shown in the Source data file. Data are presented as the mean ± SEM. Two-sided Student’s t-test was used to analyze the difference between each study group in all of the western blot quantitation procedures (a, b, d, and e) and quantitative PCR (c and f). One-way ANOVA with Tukey’s post hoc test for multiple comparison was used to analyze the differences between each study in all of the western blot quantitation procedures (g) and in tube lengths and apoptotic cell counts between each group (i).
Fig. 4
Fig. 4. ActA accelerates ligand-mediated BMPRII endocytosis and lysosomal degradation.
a Cycloheximide-chase assay for BMPRII in PAECs treated with either vehicle or ActA (20 ng/mL) (n = 3 biologically independent cells in each group). b Representative immunocytochemistry images for GFP-tagged BMPRII (in green color) in PAECs treated with either vehicle, BMP-4 (20 ng/mL), or ActA (20 ng/mL) for 30 min. Lysosomes were visualized using LysoTracker (in magenta color). Bars: 20 μm. Similar results were obtained in three independent experiments. c, d Immunoblots and densitometric analysis for BMPRII in PAECs pretreated with either PitStop (PS) (c) or bafilomycin A (BA) (d) for 2 h, followed by treatment with either vehicle or ActA for 30 min in the presence of cycloheximide (n = 3 biologically independent cells in each group). e, f Immunocytochemistry for GFP-tagged BMPRII (in green color) and lysosomes (in magenta color) in PAECs pretreated with either PitStop (e) or bafilomycin A (f), followed by treatment with either vehicle, BMP-4, or ActA. Bars: 20 μm. Similar results were obtained in four independent experiments. g Representative immunoblots and densitometric analysis for serine/threonine-phosphorylated BMPRII in PAECs treated with vehicle, BMP-4, or ActA (n = 3 biologically independent cells in each group). ***P < 0.001; **P < 0.01; *P < 0.05. Exact P values are shown in the Source data file. Data are presented as the mean ± SEM. Two-sided Student’s t-test was used to analyze the differences between the vehicle and ActA-treated groups at each time point (a). One-way ANOVA with Tukey’s post hoc test for multiple comparisons was used to analyze the differences between each study group in all of the western blot quantitation procedures (c, d, and g).
Fig. 5
Fig. 5. Target activation of INHBA in ECs exacerbates PH in association with impaired BMPRII signaling.
a Representative right ventricle pulse waves and RVSP in WT and VEcad-INHBA-Tg mice under either normoxic or 3-week hypoxic (10% O2) conditions (n = 7 biologically independent animals for normoxia WT; n = 6 for normoxia TG; n = 7 for hypoxia WT; n = 9 for hypoxia Tg). b Fulton’s index (right ventricular to left ventricular plus septum weight ratio) measurements in WT and VEcad-INHBA-Tg mice (n = 7 biologically independent animals for normoxia WT; n = 6 for normoxia TG; n = 8 for hypoxia WT; n = 10 for hypoxia Tg). c Representative images of hematoxylin and eosin and immunofluorescence staining with an EC marker (vWF; in magenta color) and SMC marker (α-SMA; in green color) with DAPI in the lungs of WT and VEcad-INHBA-Tg mice. Arrows indicate vWF-positive ECs. Bars: 50 μm. Similar results were obtained in five biologically independent samples. d, e Quantitation of the distal pulmonary artery (20–50 μm) count per 100 alveoli (d) (n = 5 biologically independent values for normoxia WT and normoxia Tg; n = 7 biologically independent values for hypoxia WT; n = 6 biologically independent values for hypoxia Tg) and muscularized distal pulmonary artery (e) (n = 4 biologically independent values in each group) in the lungs of WT and VEcad-INHBA-Tg mice. The number of no-muscularized (N), partially muscularized (P), and fully muscularized distal arteries were counted. f, g Immunoblots and densitometric analysis for BMPRII (f) and phospho-SMAD1/5 (g) in the lungs of WT and VEcad-INHBA-Tg mice (n = 3 biologically independent samples in each group). h Quantitative PCR for Id1 in ECs isolated from the lungs of WT and VEcad-INHBA-Tg (n = 3 biologically independent samples in each group). ****P < 0.0001; **P < 0.01; *P < 0.05; #, not significant (P > 0.05). Exact P values are shown in the Source data file. Data are presented as the mean ± SEM. Two-sided Student’s t-test was used to analyze the differences between the WT and VEcad-INHBA-Tg groups in the distal PA count (d), BMPRII and pSMAD1/5 western blot quantitation (f and g), and Id1 mRNA expression levels (h). One-way ANOVA with Tukey’s post hoc test for multiple comparisons was used to analyze the differences between each study group in the RVSP and Fulton index measurements (a and b). Two-way ANOVA with Tukey’s post hoc test for multiple comparisons was used to analyze the differences between each study group in the PA muscularization (e).
Fig. 6
Fig. 6. EC-specific deletion of INHBA ameliorates hypoxia-induced PH in mice.
a Representative right ventricle pulse waves and RVSP measurements in INHBA-flox and INHBA-ECKO mice under either normoxic or 3-week hypoxic (10% O2) conditions (n = 6 biologically independent animals in each group for normoxia; n = 7 biologically independent animals for hypoxia flox; n = 8 biologically independent animals for hypoxia ECKO). b Fulton’s index measurements in INHBA-flox and INHBA-ECKO mice (n = 5 biologically independent animals in each group for normoxia; n = 8 biologically independent animals for hypoxia flox; n = 7 biologically independent animals for hypoxia ECKO). c Representative images of hematoxylin and eosin staining and immunohistochemistry for an EC marker (vWF; in magenta color) and SMC marker (α-SMA; in green color) with DAPI in the lungs of INHBA-fox and INHBA-ECKO mice. Arrows indicate the distal PA. Bars: 50 μm. Similar results were obtained in five biologically independent samples. d, e Quantitation of the distal PA count per 100 alveoli (d) (n = 6 biologically independent values for normoxia flox, normoxia ECKO, and hypoxia flox; n = 5 biologically independent values for hypoxia ECKO) and muscularized distal PA (e) (n = 4 biologically independent values in each group for normoxia; n = 6 biologically independent values in each group for hypoxia) in the lungs of INHBA-flox and INHBA-ECKO mice. The number of no-muscularized (N), partially muscularized (P), and fully muscularized distal arteries was counted. f Quantitative PCR for INHBA mRNA expression levels in ECs isolated from the lungs of patients with iPAH and healthy control subjects (n = 10 biologically independent cells for control; n = 9 biologically independent cells for iPAH). g ActA concentration in the culture medium of ECs isolated from the lungs of patients with iPAH and healthy control subjects (n = 17 biologically independent cells for control; n = 12 biologically independent cells for iPAH). h Quantitative PCR for INHBA mRNA expression levels in ECs isolated from the lungs of patients with iPAH (n = 3 biologically independent cells in each group) and healthy control subjects (n = 4 biologically independent cells in each group) with or without hypoxia (1% O2) exposure for 24 h. i Tube-formation assay in PAECs treated with conditioned medium derived from iPAH-ECs or control ECs in the presence or absence of Follistatin (100 ng/mL) (n = 3 biologically independent values in each group). Bars: 200 μm. ****P < 0.0001; ***P < 0.001; **P < 0.01; *P < 0.05; #, not significant (P > 0.05). Exact P values are shown in the Source data file. Data are presented as the mean ± SEM. Two-sided Student’s t-test was used to analyze the differences between the groups in the distal PA count (d and e). One-way ANOVA with Tukey’s post hoc test for multiple comparisons was used to analyze the differences between each study group in the RVSP, Fulton index measurements, and tube-formation assay (a, b, and i). Mann–Whitney U test (two-sided) was used to analyze the differences between the groups (fh). Two-way ANOVA with Tukey’s post hoc test for multiple comparisons was used to analyze the differences between each study group in the PA muscularization (e).

References

    1. Lau EMT, Giannoulatou E, Celermajer DS, Humbert M. Epidemiology and treatment of pulmonary arterial hypertension. Nat. Rev. Cardiol. 2017;14:603–614. doi: 10.1038/nrcardio.2017.84. - DOI - PubMed
    1. Galie N, et al. Guidelines for the diagnosis and treatment of pulmonary hypertension: The Task Force for the Diagnosis and Treatment of Pulmonary Hypertension of the European Society of Cardiology (ESC) and the European Respiratory Society (ERS), endorsed by the Internat. Eur. Heart J. 2009;30:2493–2537. doi: 10.1093/eurheartj/ehp297. - DOI - PubMed
    1. McGoon MD, Miller DP. REVEAL: a contemporary US pulmonary arterial hypertension registry. Eur. Respir. Rev. 2012;21:8–18. doi: 10.1183/09059180.00008211. - DOI - PMC - PubMed
    1. Vachiery JL, Yerly P, Huez S. How to detect disease progression in pulmonary arterial hypertension. Eur. Respir. Rev. 2012;21:40–47. doi: 10.1183/09059180.00009011. - DOI - PMC - PubMed
    1. Simonneau, G. et al. Haemodynamic definitions and updated clinical classification of pulmonary hypertension. Eur. Respir. J.53, 10.1183/13993003.01913-2018 2019). - PMC - PubMed

Publication types

MeSH terms