. 2021 Mar 19;12(1):1771.
doi: 10.1038/s41467-021-21892-z.

Spatiotemporal single-cell RNA sequencing of developing chicken hearts identifies interplay between cellular differentiation and morphogenesis

Affiliations

Spatiotemporal single-cell RNA sequencing of developing chicken hearts identifies interplay between cellular differentiation and morphogenesis

Madhav Mantri et al. Nat Commun. .

Abstract

Single-cell RNA sequencing is a powerful tool to study developmental biology but does not preserve spatial information about tissue morphology and cellular interactions. Here, we combine single-cell and spatial transcriptomics with algorithms for data integration to study the development of the chicken heart from the early to late four-chambered heart stage. We create a census of the diverse cellular lineages in developing hearts, their spatial organization, and their interactions during development. Spatial mapping of differentiation transitions in cardiac lineages defines transcriptional differences between epithelial and mesenchymal cells within the epicardial lineage. Using spatially resolved expression analysis, we identify anatomically restricted expression programs, including expression of genes implicated in congenital heart disease. Last, we discover a persistent enrichment of the small, secreted peptide, thymosin beta-4, throughout coronary vascular development. Overall, our study identifies an intricate interplay between cellular differentiation and morphogenesis.


Conflict of interest statement

The authors declare no competing interests.

Figures

Fig. 1
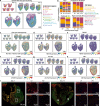
Fig. 1. Spatially resolved single-cell transcriptomic atlas of developing embryonic chicken hearts.
a Experimental workflow and analysis for single-cell RNA-seq and spatial RNA-seq of embryonic chicken (Gallus gallus) hearts at four stages of development. b UMAP projection of 22,315 single-cell transcriptomes clustered by gene expression and colored by cell type (Left). UMAP projection of single-cell transcriptomes colored by cell type and split by developmental stage from day 4 to day 14 (Right). c Spatial RNA-seq barcoded spots labeled by scRNA-seq cell type with maximum prediction score for four developmental stages. Only spots under tissue sections are shown. d Gene expression of cell type-specific markers. The size of the dot represents the percentage of cells in the clusters expressing the marker and the color intensity represents the average expression of the marker in that cluster. e Chord diagrams representing cell-type proximity maps showing the degree of colocalization of cell-type pairs within spots in spatial RNA-seq data across developmental stages.
Fig. 2
Fig. 2. Spatiotemporal lineage analysis identifies heterogeneity in cardiac progenitor cells.
a Overview of analysis pipeline for trajectory reconstruction for scRNA-seq and spatial RNA-seq data. b UMAP projection of single-cell transcriptomes from individual epicardial lineage cells clustered by gene expression and colored by cell type (left-top) and developmental stage (left-bottom). Feature plots showing expression of gene markers for individual epicardial lineage cells (right). c Epicardial lineages visualized by PHATE and labeled by cell type (top) and development stage (bottom). d Spatially resolved spatial RNA-seq spot pseudotime for epicardial lineage across developmental stages. Spot pseudotime was estimated using a similarity map between scRNA-seq cells and spatial RNA-seq spots. e single-molecule FISH of Day 7 (HH31) ventricular free walls stained for POSTN (green), TCF21 (red), and DAPI (blue) with LUM (orange). f Single-molecule fluorescent in situ hybridization of Day 7 (HH31) ventricular free walls stained for POSTN (green), TCF21 (red), and DAPI (blue) with AGRN (orange). The Blue channel is DAPI. Representative images of three to four biological replicates.
Fig. 3
Fig. 3. Spatial RNA-seq identifies spatially restricted genes in cardiac tissue during development.
a Spatial RNA-seq barcoded spots clustered by gene expression and labeled by tissue anatomical compartment for four developmental stages. b Average cell type composition across various tissue anatomical compartments. c Spatial map showing the cell type heterogeneity for every spot in cardiac tissue across stages. Cell type was estimated by enumerating the number of distinct cell-types with prediction scores greater than 5%. dh Spatially resolved gene expression for spatially restricted genes. d TBX5 overexpressed in left ventricles on day 7 and day 10. e TBX20 showing no spatial restriction. f CHGB overexpressed in right ventricles across stages. g ACTG2 overexpressed in right ventricles on day 7. h MB expressed in compact myocardium on day 10 and day 14. MB expression increases with the developmental stage. i smFISH stained day 7 and day 14 hearts for TBX5 (red), TBX20 (orange), TNNT2 (green), and DAPI (blue) confirming TBX5 overexpressed in left ventricles of day 7 hearts but not day 14 and TBX20 showing no left or right ventricle expression differences. Representative images of three to four biological replicates.
Fig. 4
Fig. 4. Spatially resolved gene expression for congenital heart disease (CHD) associated genes.
a GATA5, (b) IRX4, (c) PITX2, (d) ACTC1, (e) MYH7, and (f) GJA5.
Fig. 5
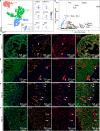
Fig. 5. A persistent enriched thymosin beta-4 expression in coronary vascular cells.
a UMAP projection of 1,075 scRNA-seq TMSB4X high cells clustered by gene expression (left). Inset shows the UMAP projection of TMSB4X high cells labeled by developmental stage. Feature plots showing expression of gene markers for cell types in the “TMSB4X high cells” cluster: FABP5 and TM4SF18 for vascular endothelial, ACTA2 and TCF21 for mural cells, NPC2 and IRX6 for endocardial cells (right). b Volcano plot showing differentially expressed genes for TMSB4X high scRNA-seq cells computed using two-sided Wilcoxon Rank-Sum test. Dotted lines represent thresholds for significantly enriched genes (red): −log2 fold change > 0.5 and p-value <10−5. cf smFISH images of the chicken heart ventricular free wall sections across four developmental stages labeled for cardiomyocyte cell marker TNNT2 (green), endothelial cell marker CDH5 (orange), thymosin beta-4 TMSB4X (red), and DAPI (blue). Representative images of three to four biological replicates. c Day 4 (HH24); Cells with high autofluorescence in all channels are Erythrocytes, (d) day 7 (HH31), (e) day 10 (HH36), (f) day 14 (HH40).

References

    1. Buckingham M, Meilhac S, Zaffran S. Building the mammalian heart from two sources of myocardial cells. Nat. Rev. Genet. 2005;6:826–835. doi: 10.1038/nrg1710. - DOI - PubMed
    1. Dunwoodie SL. Combinatorial signaling in the heart orchestrates cardiac induction, lineage specification and chamber formation. Semin. Cell Dev. Biol. 2007;18:54–66. doi: 10.1016/j.semcdb.2006.12.003. - DOI - PubMed
    1. Martinsen BJ. Reference guide to the stages of chick heart embryology. Dev. Dyn. 2005;233:1217–1237. doi: 10.1002/dvdy.20468. - DOI - PubMed
    1. Hie, B., Bryson, B. & Berger, B. Efficient integration of heterogeneous single-cell transcriptomes using Scanorama. Nat. Biotechnol. 10.1038/s41587-019-0113-3 (2019). - PMC - PubMed
    1. Butler A, Hoffman P, Smibert P, Papalexi E, Satija R. Integrating single-cell transcriptomic data across different conditions, technologies, and species. Nat. Biotechnol. 2018;36:411–420. doi: 10.1038/nbt.4096. - DOI - PMC - PubMed

Publication types