. 2021 Mar 19;12(1):1718.
doi: 10.1038/s41467-021-21960-4.

Citrullination of pyruvate kinase M2 by PADI1 and PADI3 regulates glycolysis and cancer cell proliferation

Affiliations

Citrullination of pyruvate kinase M2 by PADI1 and PADI3 regulates glycolysis and cancer cell proliferation

Sébastien Coassolo et al. Nat Commun. .

Abstract

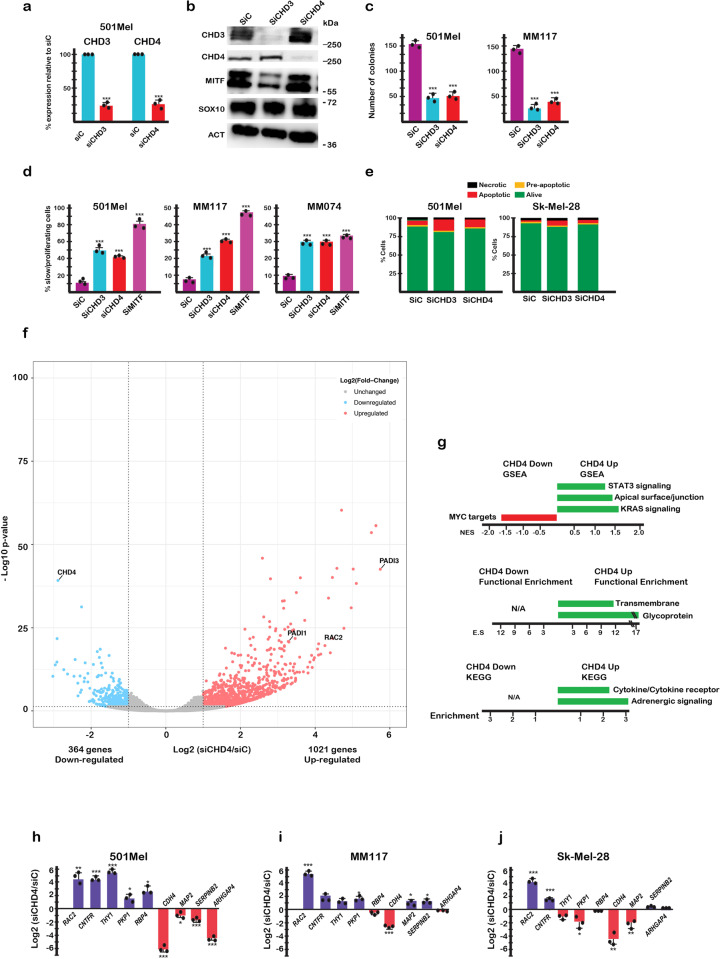
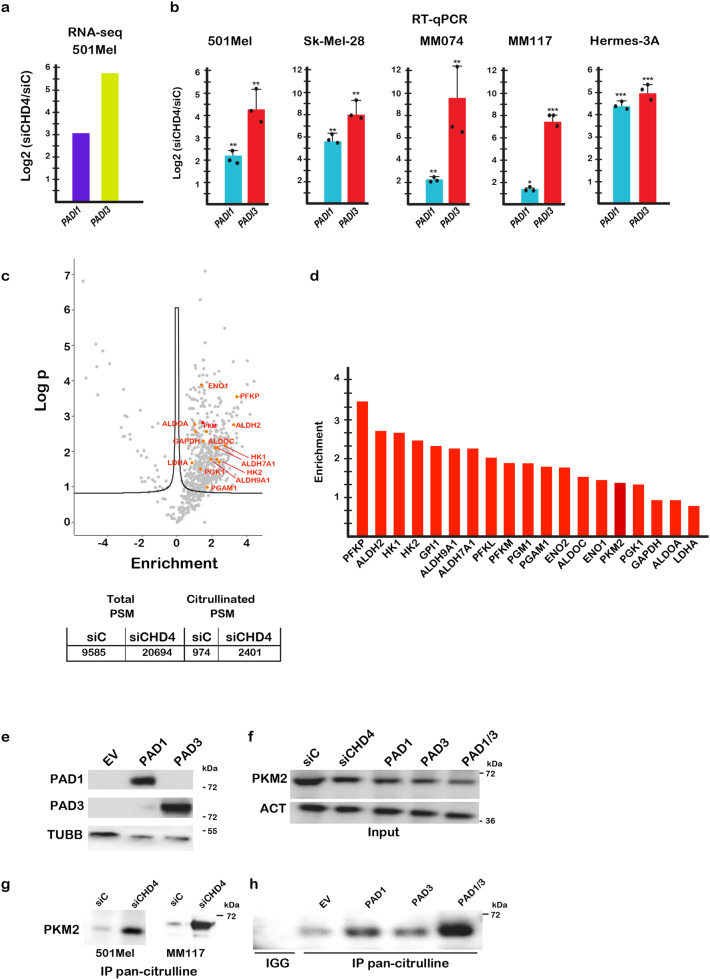
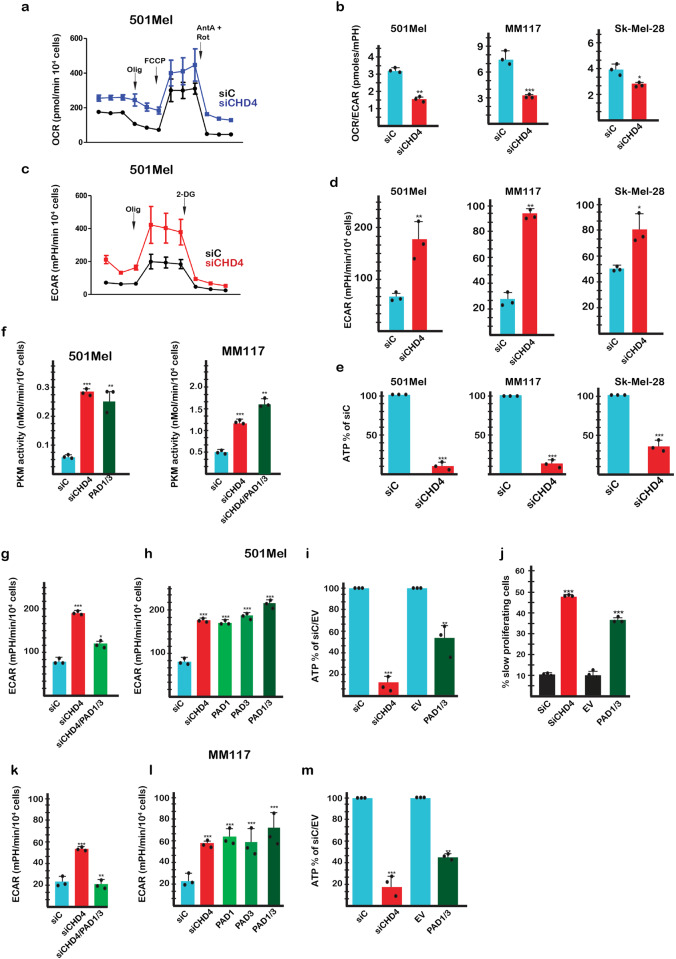
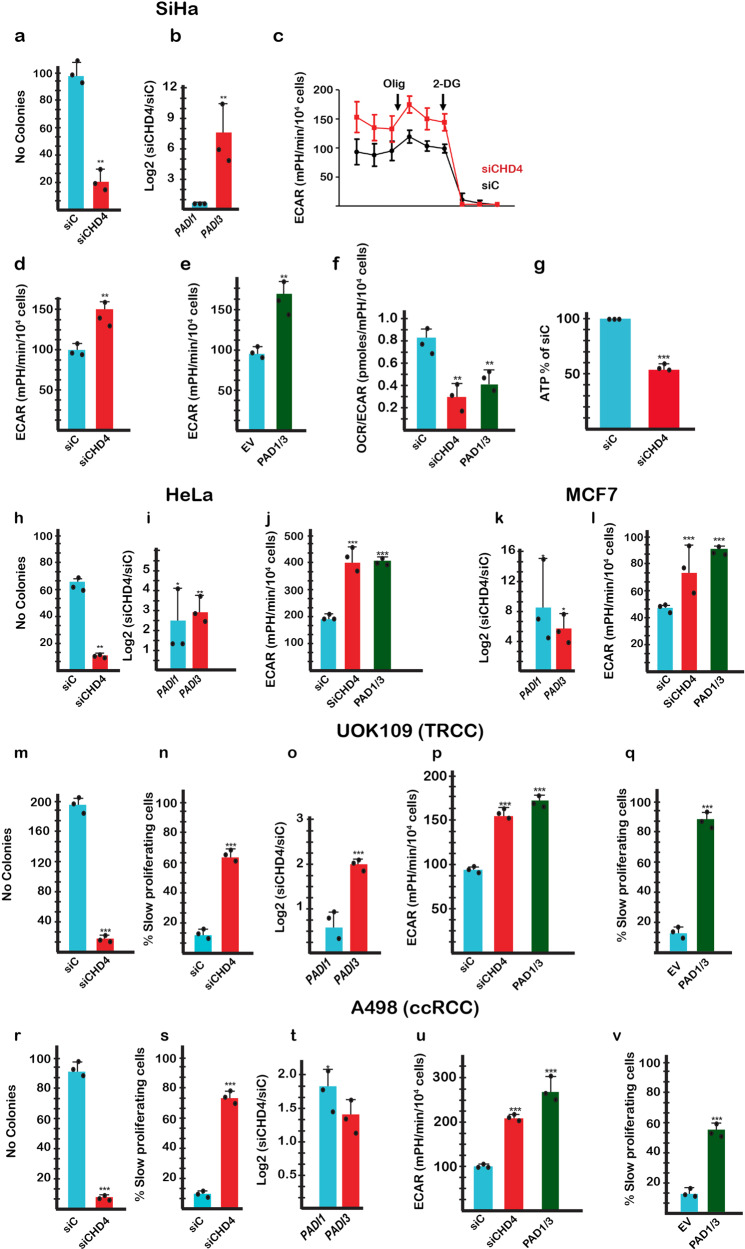
Chromodomain helicase DNA binding protein 4 (CHD4) is an ATPase subunit of the Nucleosome Remodelling and Deacetylation (NuRD) complex that regulates gene expression. CHD4 is essential for growth of multiple patient derived melanoma xenografts and for breast cancer. Here we show that CHD4 regulates expression of PADI1 (Protein Arginine Deiminase 1) and PADI3 in multiple cancer cell types modulating citrullination of arginine residues of the allosterically-regulated glycolytic enzyme pyruvate kinase M2 (PKM2). Citrullination of PKM2 R106 reprogrammes cross-talk between PKM2 ligands lowering its sensitivity to the inhibitors Tryptophan, Alanine and Phenylalanine and promoting activation by Serine. Citrullination thus bypasses normal physiological regulation by low Serine levels to promote excessive glycolysis and reduced cell proliferation. We further show that PADI1 and PADI3 expression is up-regulated by hypoxia where PKM2 citrullination contributes to increased glycolysis. We provide insight as to how conversion of arginines to citrulline impacts key interactions within PKM2 that act in concert to reprogramme its activity as an additional mechanism regulating this important enzyme.


Conflict of interest statement

The authors declare no competing interests.

Figures

Fig. 1
Fig. 1. CHD3 and CHD4 are required for normal melanoma cell proliferation.
a, b 501Mel cells were transfected with the indicated siRNAs and CHD3 and CHD4 expression evaluated by RT-qPCR or by immunoblot along with that of MITF and SOX10. c The indicated cell lines were transfected with siRNA and after reseeding the number of colonies counted after 10 days. d The indicated cell lines were transfected with siRNAs and cell proliferation evaluated by cell trace violet assay. e The indicated cell lines were transfected with siRNA and apoptosis detected by FACs after labelling with Annexin-V. Silencing of MITF known to induce cell cycle arrest and senescence was included as a control. f Volcano plot showing changes in gene expression following CHD4 silencing. Genes up or down-regulated based on Log2 fold-change >1/<-1 with an adjusted p-value <0.05 were identified. g Ontology analyses of CHD4 regulated genes. Shown are the enrichment scores for GSEA, as well as David functional enrichment and KEGG pathway categories. hj Verification of deregulated expression of selected genes following siCHD4 in independent RNA samples from 501Mel, MM117 and Sk-Mel-28 cells. In all experiments n = 3 biological replicates and unpaired t-test with two tailed p-value analyses and confidence interval 95% were performed by Prism 5. p-Values: *p < 0.05; **p < 0.01; ***p < 0.001. Data are mean ± SEM.
Fig. 2
Fig. 2. CHD4 regulates PADI1 and PADI3 expression and citrullination of their substrates.
a, b PADI1 and PADI3 expression in the indicated cells lines following CHD4 silencing shown by RNA-seq (a) and RT-qPCR (b). n = 3 biological replicates. and unpaired t-test with two tailed p-value analyses and confidence interval 95% were performed by Prism 5. p-Values: *p < 0.05; **p < 0.01; ***p < 0.001. Data are mean ± SEM. c Volcano plot showing proteins with increased or decreased total PSMs after immunoprecipitation with pan-citrulline antibody. Increases in number of total and citrullinated PSMs in CHD4 silenced cells is shown below the plot. d Enrichment for a collection of glycolytic enzymes following CHD4 silencing. e Immunoblot showing expression of recombinant PAD1 and PAD3 in cells transfected with the corresponding expression vectors of the empty vector (EV). f Immunoblot showing expression of PKM2 in cells after CHD4 silencing or transfection with the PAD1 and PAD3 vectors in the cell extracts used for immunoprecipitation with pan-citrulline antibody. g PKM2 in the pan-citrulline IPs from 501Mel or MM117 cells. h. Immunoblot showing PKM2 in the pan-citrulline IP after transfection with the PADI1 and/or PADI3 expression vectors.
Fig. 3
Fig. 3. CHD4 silencing regulates glycolysis and cell proliferation.
a Effect of CHD4 silencing on basal and maximal OCR values in 501Mel cells. b Effect of CHD4 silencing on the basal OCR/ECAR ratio in the indicated cell types. c, d Effect of CHD4 silencing on basal and maximal ECAR values in 501Mel cells and basal ECAR values in the indicated cell types. e CHD4 silencing reduces intracellular ATP levels in the indicated cell lines. f Stimulation of PKM2 enzymatic activity in extracts from cells under the indicated conditions. g, h ECAR values in 501Mel cells following transfection with indicated siRNAs or expression vectors. i Intracellular ATP levels following CHD4 silencing or PAD1/3 expression. EV = empty expression vector control. j Reduced cell proliferation following PAD1/3 expression. km ECAR values and intracellular ATP levels in MM117 cells following transfection with indicated siRNAs or expression vectors. ECAR and OCR and ATP values were determined from n = 3 biological replicates with 6 technical replicates for each N in the case of OCR and ECAR. n = 3 biological replicates and unpaired t-test with two tailed p-value analyses and confidence interval 95% were performed by Prism 5. p-Values: *p < 0.05; **p < 0.01; ***p < 0.001. Data are mean ± SEM. Values for PKM2 enzymatic activity were determined by Prism 5 using a 2-way ANOVA test.
Fig. 4
Fig. 4. Citrullination regulates glycolysis and proliferation in multiple types of cancer cells.
a Diminished colony forming capacity of SiHa cells following CHD4 silencing. b PADI1 and PADI3 expression in SiHa cells following CHD4 silencing. c, d Basal and maximal glycolysis in SiHa cells following CHD4 silencing. e Glycolysis in SiHa cells following PAD1/3 expression. f OCR/ECAR ratio in SiHa cells following CHD4 silencing or PAD1/3 expression. g Intracellular ATP levels in SiHa cells following CHD4 silencing. hj Colony forming capacity, PADI1, PADI3 expression and glycolysis in HeLa cells following CHD4 silencing or PAD1/3 expression as indicated. k, l PADI1, PADI3 expression and glycolysis in MCF7 cells following CHD4 silencing or PAD1/3 expression as indicated. mq Colony forming capacity, PADI1, PADI3 expression and glycolysis and proliferation in UOK-109 translocation renal cell carcinoma cells following CHD4 silencing or PADI1/3 expression as indicated. rv Colony forming capacity, PADI1, PADI3 expression and glycolysis and proliferation of A498 clear cell renal carcinoma cells following CHD4 silencing or PAD1/3 expression as indicated. For RT-qPCR, ATP levels and clonogenicity, n = 3 biological replicates For ECAR: n = 3 biological replicates with 6 technical replicates for each N. Unpaired t-test with two tailed p-value analyses and confidence interval 95% were performed by Prism 5. p-Values: *p < 0.05; **p < 0.01; ***p < 0.001. Data are mean ± SEM.
Fig. 5
Fig. 5. PKM2 citrullination diminishes allosteric inhibition by Phe/Ala/Trp.
a Close up view of free Ser and Phe interactions within the free amino acid binding pocket in the Apo, R-active and T-inactive states with a superposition of the three structures. All residues displayed are shown as sticks. In the superposition, the peptide bearing R43 is represented as ribbon to show the allosteric changes created upon Phe binding. Salt bridges and hydrogen bonds are shown as dashed lines. For clarity, the side chain of Phe 470, which stacks on R106 side chain, is not displayed. PDB data sets are as described in Supplementary Fig. 3. b ECAR values in absence of Ser after CHD4 silencing or PAD1/3 expression in 501Mel or MM117 cells; NM = normal medium. c ECAR values in presence of exogenous Ser with or without CHD4 silencing in 501Mel cells. d, e ECAR values in presence of exogenous Trp or Phe with or without CHD4 silencing or PAD1/3 expression in 501Mel cells. f ECAR values in presence of exogenous Phe with or without CHD4 silencing in MM117 cells. g ECAR values in presence of exogenous Ala with or without PAD1/3 expression in 501Mel cells. h, i PKM2 enzymatic activity in cell extracts supplemented with the indicated concentrations of Trp and Phe or PBS as control. In all experiments ECAR values and PKM2 enzymatic activity were determined from n = 3 biological replicates with 6 technical replicates for each N for ECAR. n = 3 biological replicates. and unpaired t-test with two tailed p-value analyses and confidence interval 95% were performed by Prism 5. p-Values: *p < 0.05; **p < 0.01; ***p < 0.001. Data are mean ± SEM. Values for PKM2 enzymatic activity were determined by Prism 5 using a 2-way ANOVA test.
Fig. 6
Fig. 6. Effects of FBP and Ser on glycolysis.
a Close up view of FBP interactions with the R-active state illustrating the hydrogen bond between R489 and the 1’ phosphate of FBP as well as the network of hydrogen bonding with other residues. Salt bridges and hydrogen bonds are shown as dashed lines. For clarity, the side chain of K433 is not displayed. PDB data sets are as described in Supplementary Fig. S3b ECAR values in presence of increasing exogenous FBP with or without exogenous Ser and siCHD4 silencing. NM = normal medium. c ECAR values in presence of increasing exogenous Phe with or low or high exogenous FBP and siCHD4 silencing in 501Mel or MM117 cells as indicated. d Effect of siCHD4 silencing on ECAR values in presence of increasing exogenous Phe with or low or high exogenous FBP expressed as a % of the siC control. n = 3 biological replicates with 6 technical replicates for each N. Unpaired t-test analysis were performed by Prism 5. p-Values: *p < 0.05; **p < 0.01; ***p < 0.001. Data are mean ± SEM. e A model for how citrullination affects PKM2 and glycolysis. Under basal conditions PKM2, represented as a tetramer, is in a dynamic equilibrium between a Ser bound form and a lower activity FBP bound form also in equilibrium with inhibitory amino acids. Increased Ser shifts the equilibrium to a Ser-bound form with higher activity due to mutually exclusive occupancy by Ser or Trp/Phe/Ala accounting for the observed increase in glycolysis. Citrullination diminishes FBP binding (R489 < C represented by –C) alleviating its negative effect on Ser and shifts the mutually exclusive Ser vs Trp/Phe/Ala binding in favour of Ser. The net result is to promote a predominantly Ser-bound form accounting for the observed increased in glycolysis.
Fig. 7
Fig. 7. PKM2 citrullination contributes to increased glycolysis in hypoxia.
ac Correlation of PADI1 and PADI3 expression with that of the HARRIS_HYPOXIA signature in the indicated cancer types using TCGA data sets. The Spearman correlations and p-values are indicated. d, e Expression of the indicated genes assessed by RT-qPCR in cells grown under hypoxia (1% O2) (d) or pseudo-hypoxia with 300 μM DMOG (e). n = 3 biological replicates. f Induction of PAD1 and PAD3 expression in 501Mel cells grown as 3D melanospheres for 7 days. g Immunoblots showing enhanced PKM2 R106Cit when grown under increasing concentrations of DMOG. h Immunoblots showing expression of the indicated proteins in transfected cells in presence of 300 μM DMOG. i Glycolysis in transfected cells in presence of 300 μM DMOG. ECAR values were determined from n = 4 biological replicates with 6 technical replicates for each N and unpaired t-test with two tailed p-value analyses and confidence interval 95% were performed by Prism 5. p-Values: *p < 0.05; **p < 0.01; ***p < 0.001. Data are mean ± SEM.

References

    1. Hanahan D, Weinberg RA. Hallmarks of cancer: the next generation. Cell. 2011;144:646–674. doi: 10.1016/j.cell.2011.02.013. - DOI - PubMed
    1. Vander Heiden MG, Cantley LC, Thompson CB. Understanding the Warburg effect: the metabolic requirements of cell proliferation. Science. 2009;324:1029–1033. doi: 10.1126/science.1160809. - DOI - PMC - PubMed
    1. Rosenzweig A, Blenis J, Gomes AP. Beyond the Warburg effect: how do cancer cells regulate one-carbon metabolism? Front Cell Dev. Biol. 2018;6:90. doi: 10.3389/fcell.2018.00090. - DOI - PMC - PubMed
    1. Christofk HR, et al. The M2 splice isoform of pyruvate kinase is important for cancer metabolism and tumour growth. Nature. 2008;452:230–233. doi: 10.1038/nature06734. - DOI - PubMed
    1. Dayton TL, Jacks T, Vander Heiden MG. PKM2, cancer metabolism, and the road ahead. EMBO Rep. 2016;17:1721–1730. doi: 10.15252/embr.201643300. - DOI - PMC - PubMed

Publication types

MeSH terms