Comparative Study
. 2021 Mar 19;7(1):28.
doi: 10.1038/s41522-021-00193-9.

Gut microbiota determines the social behavior of mice and induces metabolic and inflammatory changes in their adipose tissue

Affiliations
Comparative Study

Gut microbiota determines the social behavior of mice and induces metabolic and inflammatory changes in their adipose tissue

Oryan Agranyoni et al. NPJ Biofilms Microbiomes. .

Abstract

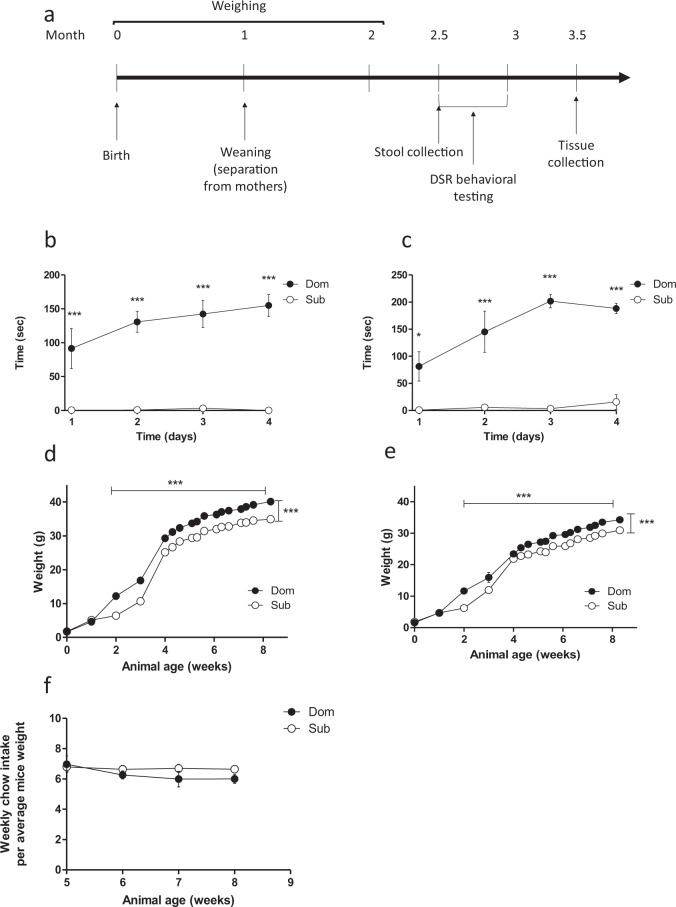
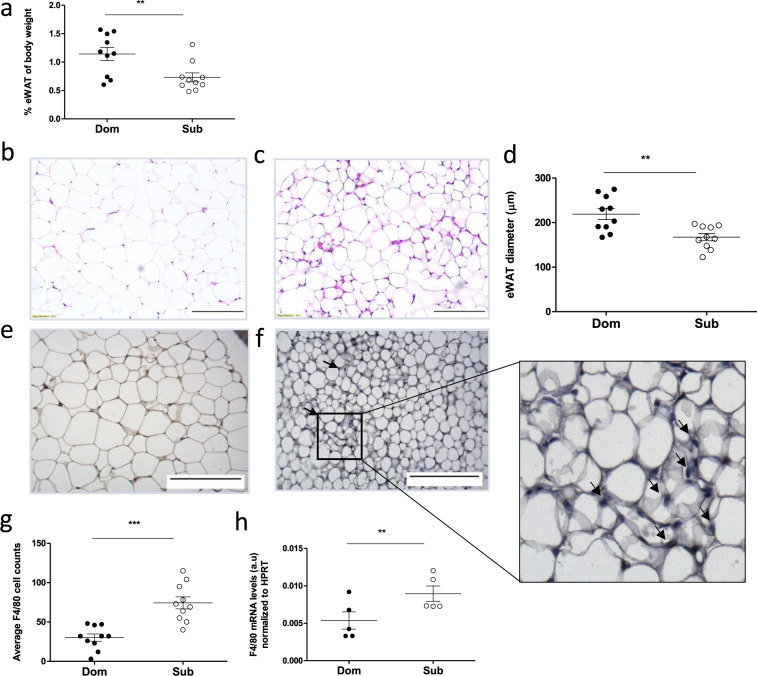
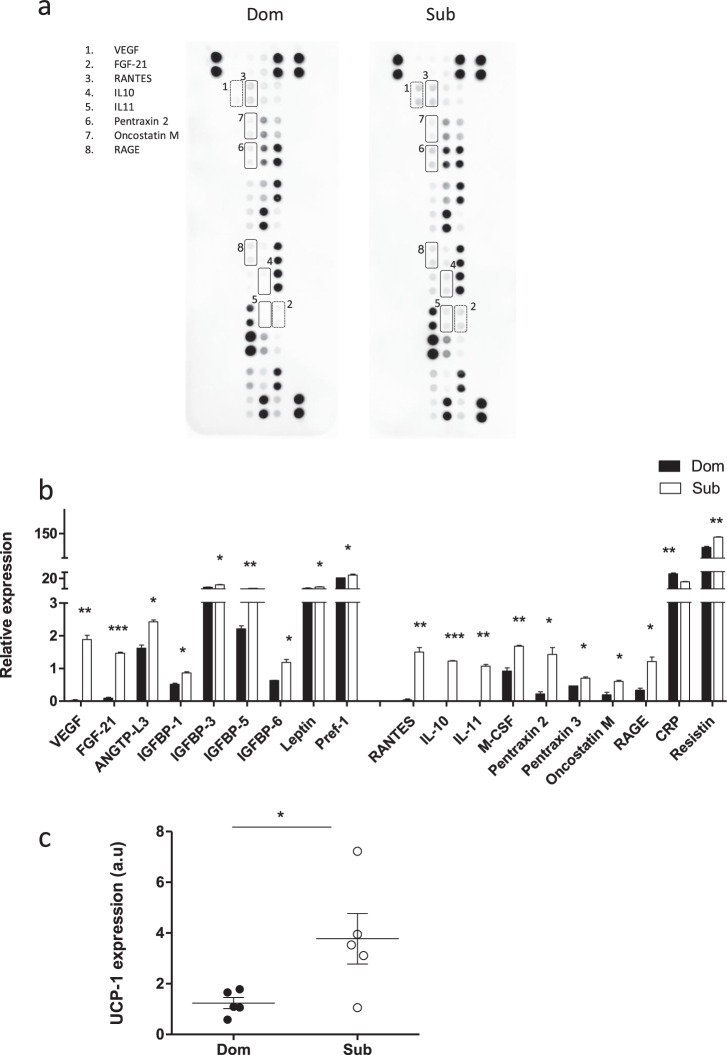
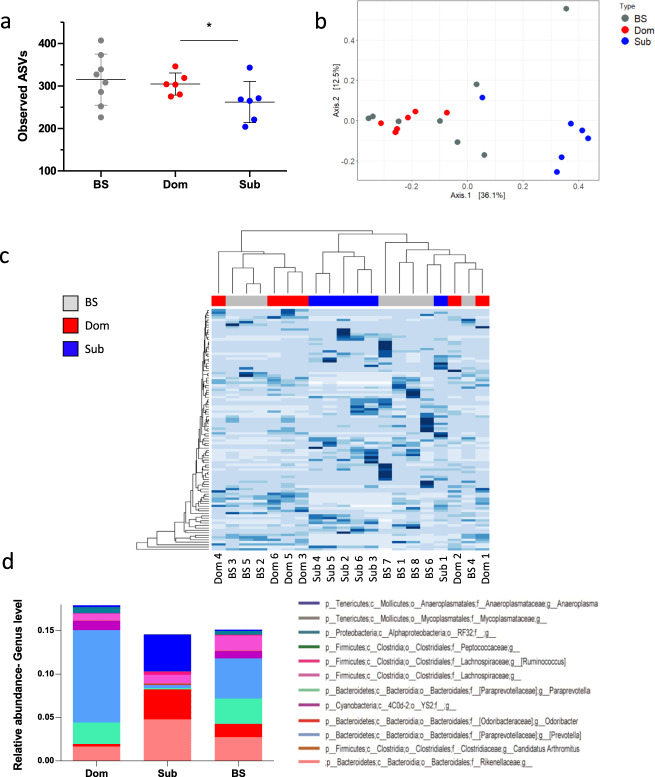
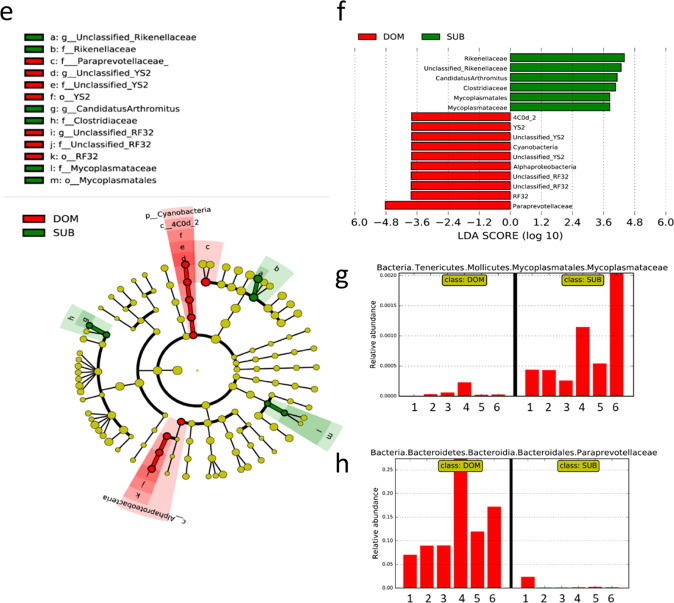
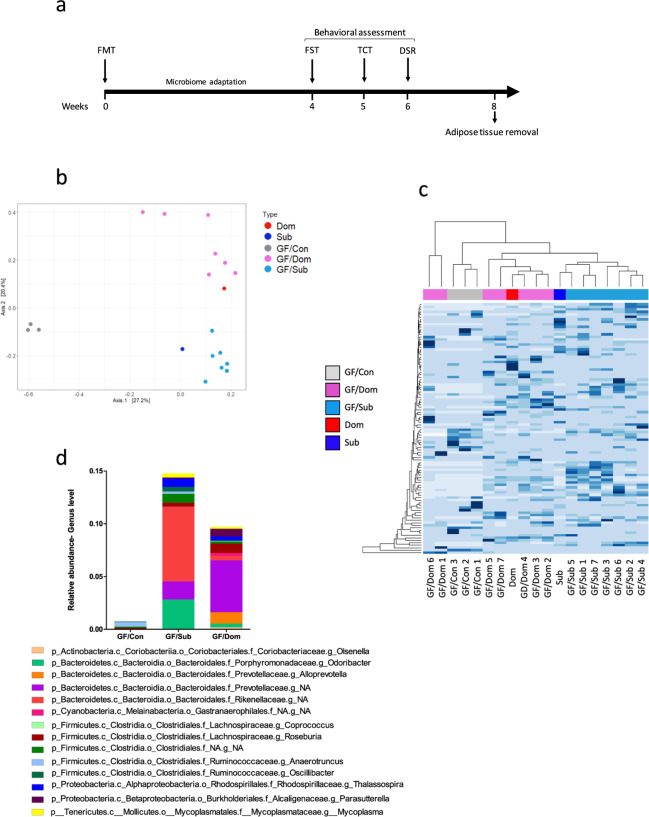
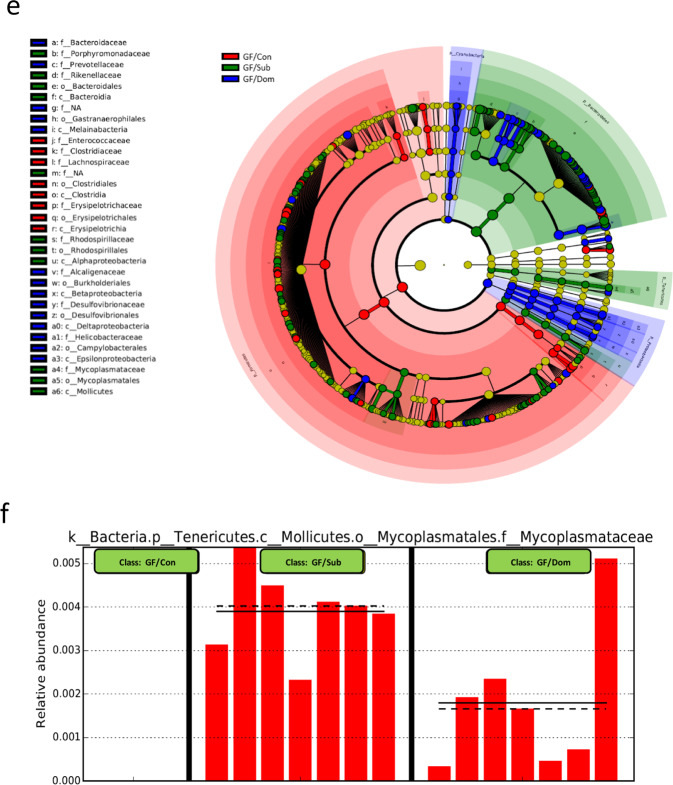
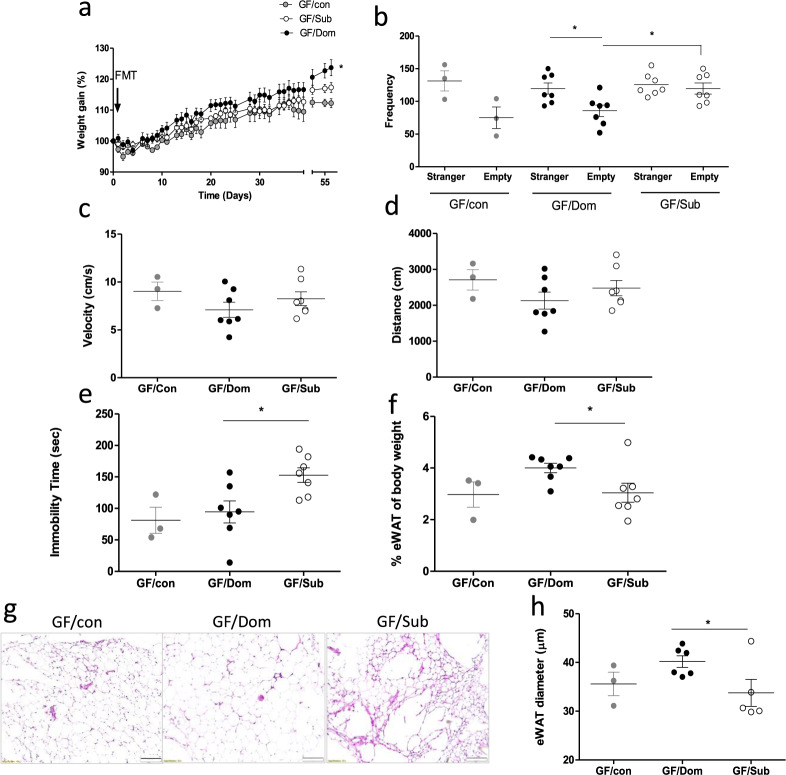
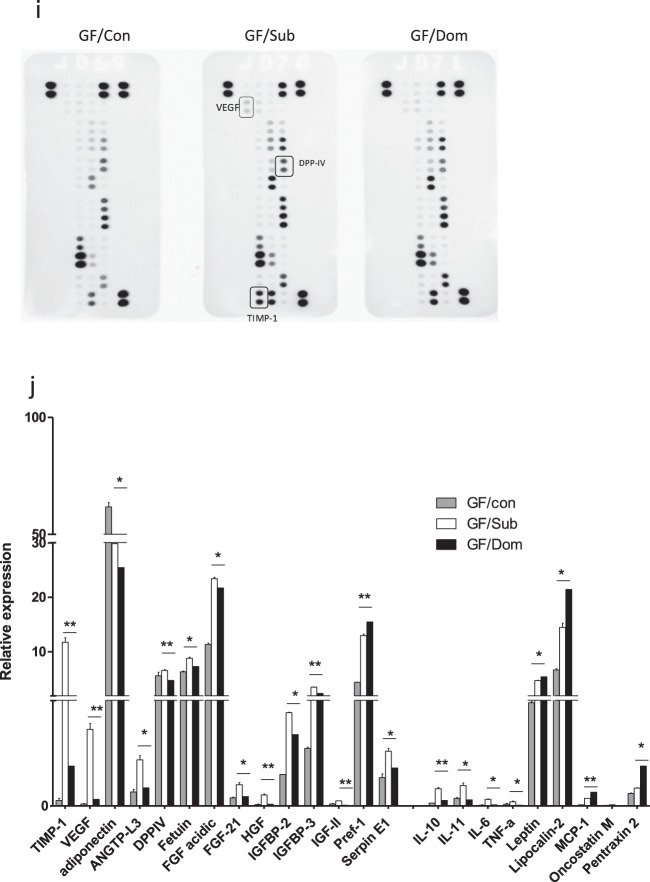
The link between the gut microbiota and social behavior has been demonstrated, however the translational impact of a certain microbiota composition on stable behavioral patterns is yet to be elucidated. Here we employed an established social behavior mouse model of dominance (Dom) or submissiveness (Sub). A comprehensive 16S rRNA gene sequence analysis of Dom and Sub mice revealed a significantly different gut microbiota composition that clearly distinguishes between the two behavioral modes. Sub mice gut microbiota is significantly less diverse than that of Dom mice, and their taxa composition uniquely comprised the genera Mycoplasma and Anaeroplasma of the Tenericutes phylum, in addition to the Rikenellaceae and Clostridiaceae families. Conversely, the gut microbiota of Dom mice includes the genus Prevotella of the Bacteriodetes phylum, significantly less abundant in Sub mice. In addition, Sub mice show lower body weight from the age of 2 weeks and throughout their life span, accompanied with lower epididymis white adipose tissue (eWAT) mass and smaller adipocytes together with substantially elevated expression of inflammation and metabolic-related eWAT adipokines. Finally, fecal microbiota transplantation into germ-free mice show that Sub-transplanted mice acquired Sub microbiota and adopted their behavioral and physiological features, including depressive-like and anti-social behaviors alongside reduced eWAT mass, smaller adipocytes, and a Sub-like eWAT adipokine profile. Our findings demonstrate the critical role of the gut microbiome in determining dominance vs. submissiveness and suggest an association between gut microbiota, the eWAT metabolic and inflammatory profile, and the social behavior mode.


Conflict of interest statement

The authors declare no competing interests.

Figures

Fig. 1
Fig. 1. Sub mice demonstrate a more submissive social behavior and weigh less than Dom mice, despite similar food intake.
a Experimental timeline. Dom and Sub mice were weighed from birth to 2 month old, then Dom and Sub mice behavior was assessed using the DSR test, followed by stool collection and tissue collection. b, c The dominant–submissive relationship (DSR) test results of Dom and Sub male (b) and female (c) mice (n = 10 in each group). The typical social behavior of each mouse was determined by measuring the average drinking time spent by the respective mouse group. d, e Body weight monitoring of Dom and Sub male (d) and female (e) mice. Mice of each behavioral phenotype were weighed three times a week and the average body weights are shown. f The chow intake by Dom and Sub mice (males and females combined) determined in parallel to weight follow-up. Each time point represents the average chow intake in eight cages per group, normalized to the average weight of mice housed in the respective cages. Weight and chow intake differences were statistically analyzed by using a two-way ANOVA followed by Bonferroni correction. ***p < 0.001. Error bars show standard deviation.
Fig. 2
Fig. 2. Sub mice show lower eWAT mass, smaller adipocytes, and increased macrophage infiltration, as compared with Dom mice.
a Quantification of eWATs obtained from naive Dom and Sub mice (n = 10 in each group), normalized to the body weight of the respective mouse. Dom mice exhibit higher epididymis adipose mass. b, c Microscopic visualization of histological staining (×40 magnification, scale bar = 250 μm) of eWAT removed from Dom (b) and Sub (c) mice. d Quantification of adipocyte diameter of Dom and Sub mice determined from histological images using the ImageJ software. eWAT cells from 10 random cells per field were analyzed from 10 random fields in each mouse (SD of the diameter = 6.447 and 4.853 μm for Dom and Sub mice, respectively). The morphological differences of adipose tissue in the two groups of mice can be seen. eg Macrophage infiltration was assessed by using immunohistochemistry (×40 magnification) for F4/80 in Dom (e) and Sub (f) mice (n = 10 each), and it was quantified g from histological images by using the ImageJ software. Ten random cells per field were analyzed from 10 random fields in each mouse. Arrows in f indicate crown-like structures of macrophages between adipocytes. h Macrophage quantification using F4/80 mRNA gene expression, normalized to HPRT, showing an increase in macrophage expression in Sub mice. a.u: arbitrary units. Statistical significance was assessed using Student’s t test. **p < 0.01, ***p < 0.001. Error bars show standard deviation.
Fig. 3
Fig. 3. Adipokine profile demonstrates elevated adipokine levels in the eWAT of Sub mice.
a Proteins extracted from either Dom or Sub eWAT specimens were compared using an adipokine array. b Each duplicate was normalized to the positive control. The differences in protein expression of Dom and Sub mice normalized to the corresponding controls were analyzed. Each bar represents the average of adipokine duplicates on the same membrane measured in a pool of eWAT protein extracts from Dom and Sub mice (n = 4 in each pool). Only eWAT adipokines that were significantly different among Dom and Sub mice are presented. c UCP-1 (marker for browning) mRNA gene expression is higher in Sub compared to Dom mice (n = 5 in each group). HPRT was used as a housekeeping gene. a.u: arbitrary units. *p < 0.05, **p < 0.01, ***p < 0.001 analyzed by Student’s t test. Error bars show standard deviation.
Fig. 4
Fig. 4. Gut microbiota compositions and unique taxa in Dom, Sub, and BS mice.
a Alpha diversity of the gut microbiome of Dom, Sub, and background-strain (BS) mice (n = 20; SD = 26.10, 48.44, and 60.15, respectively). The alpha diversity of BS and Dom mice was not significantly different. b A principal component analysis showing the clustering of the gut microbiome of mice with the same social behavior phenotype. c A heatmap of the 100 most variant species identified; taxa with similar distributions are grouped together. d Relative abundance up to the genus level. e Cladogram of gut microbiota in the different mouse groups. The taxonomic levels are represented by rings, with the class in the outermost ring and the phylum in the innermost ring. Each ring represents a member within that level. Dom and Sub mice are colored in red and green, respectively. f The LDA scores of biomarkers found by LEfSe to be significantly different between Dom and Sub mice. Each bar represents the log10 effect size for each taxon. g, h Abundance histograms of the Mycoplasmataceae (g) and Paraprevotellaceae (h) biomarkers detected by LEfSe. Each bar represents the relative abundance of the specified taxa in an individual mouse. Statistical significance was assessed by using a one-way ANOVA with Bonferroni correction, *p < 0.05. Error bars show standard deviation.
Fig. 5
Fig. 5. Gut microbiome composition of germ-free mice after a fecal microbiota transplantation from Dom or Sub donor mice.
a Experimental timeline. Germ-free (GF) mice (n = 17) underwent a fecal microbiota transplantation (FMT) of either Dom-derived microbiota (GF/Dom, n = 7), Sub-derived microbiota (GF/Sub, n = 7), or PBS (GF/Con, n = 3). After an adaptation period, the mice underwent a series of behavioral assessments (FST; forced swim test; TCST: three-chamber Sociability test; DSR: dominant–submissive relationship test) and their adipose tissues were removed and analyzed. b Principal component analysis of the gut microbiota of GF/Con, GF/Dom, and GF/Sub mice, (n = 17) at Day 7 post-FMT, demonstrating the clustering of the gut microbiome in each group, as well as in GF mice and in the donor mice. c A heatmap of the microbial composition of the samples at the species level, with the top 100 most variant species identified. Taxa with similar distributions are grouped together. d Relative abundance up to the genus level. An additional figure up to the order level (for significantly altered bacteria) is presented in Supplementary Fig. 4. e LEfSe cladogram of gut microbiota in the different mouse groups. Taxa whose distributions among different groups are significantly different (p < 0.05 and the effect size >2). f Abundance histograms of the Mycoplasmataceae biomarker in Sub mice, detected by LEfSe as the marker of GF/Sub mice. Each bar represents the relative abundance of the specified taxa in an individual mouse. Statistical significance was assessed using a one-way ANOVA with Bonferroni correction.
Fig. 6
Fig. 6. The effects of FMT on mouse body weight, behavior, eWAT content, and adipokine profile.
a Body weight follow-up of transplanted GF mice. The curves represent the average mouse weight gain as a percentage from their weight at the day of transplantation. bd Mouse social behavior, measured in the TCST. c, d The average velocity (c) and distance (d) per group shows similar locomotor activity in all the groups. e Depressive-like behavior, reflected in immobility time in the FST, in GF/Sub mice, as compared with normal behavior in GF/Dom mice. f Quantification of eWAT mass, obtained from GF mice, normalized to the respective body weight of each mouse. g Histological (H&E) staining of eWAT from GF-transplanted mice (×40 magnification, scale bar = 20 μm). h The eWAT cell diameter of transplanted GF mice was determined using the ImageJ software. Ten random cells per field were analyzed from 10 random fields in each mouse. i An adipokine array comparison of pooled proteins extracted from the eWAT of GF/Sub (n = 4) and GF/Dom (n = 4). j The eWAT adipokines that their expression was significantly altered following FMT. Each bar represents the average of duplicate adipokine expression normalized to the positive control. GF/Sub mice demonstrated a significantly higher adipokine level than GF/Dom mice. Statistical significance was determined using Student’s t test or one-/two-way ANOVA with Bonferroni correction, *p < 0.05, **p < 0.01. Error bars show standard deviation.

Similar articles

Cited by

References

    1. Martin CR, Mayer EA. Gut-brain axis and behavior. Nestle Nutr. Inst. Workshop Ser. 2017;88:45–53. doi: 10.1159/000461732. - DOI - PMC - PubMed
    1. Vuong HE, Yano JM, Fung TC, Hsiao EY. The microbiome and host behavior. Annu. Rev. Neurosci. 2017 doi: 10.1146/annurev-neuro-072116-031347. - DOI - PMC - PubMed
    1. Bouter, K. E., Raalte, D. H. van, Groen, A. K. & Nieuwdorp, M. Role of the gut microbiome in the pathogenesis of obesity and obesity-related metabolic dysfunction. Gastroenterology152, 1671–1678 (2017). - PubMed
    1. Donovan SM. Introduction to the special focus issue on the impact of diet on gut microbiota composition and function and future opportunities for nutritional modulation of the gut microbiome to improve human health. Gut Microbes. 2017;8:75–81. doi: 10.1080/19490976.2017.1299309. - DOI - PMC - PubMed
    1. Neuman H, Debelius JW, Knight R, Koren O. Microbial endocrinology: the interplay between the microbiota and the endocrine system. FEMS Microbiol. Rev. 2015;39:509–521. doi: 10.1093/femsre/fuu010. - DOI - PubMed

Publication types

Substances