. 2021 Mar 19;11(1):6449.
doi: 10.1038/s41598-021-84945-9.

Individuals with dyslexia use a different visual sampling strategy to read text

Affiliations

Individuals with dyslexia use a different visual sampling strategy to read text

Léon Franzen et al. Sci Rep. .

Abstract

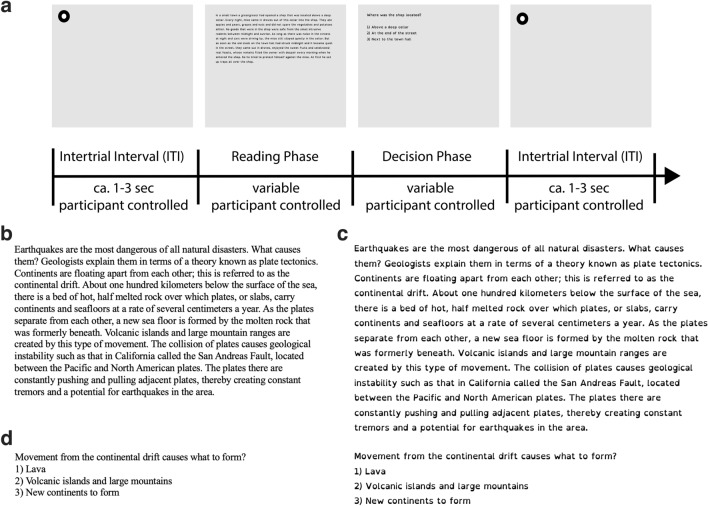
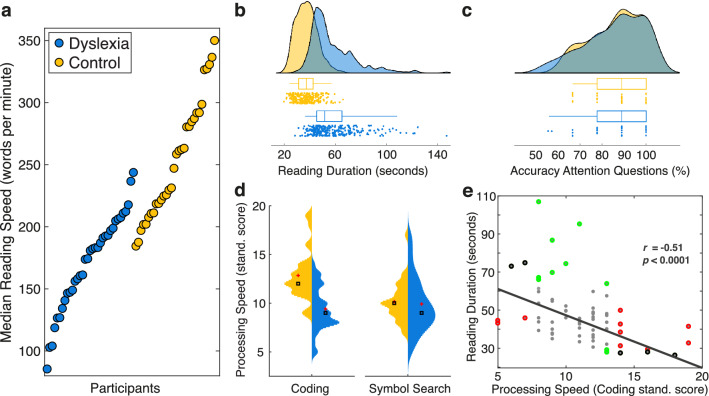
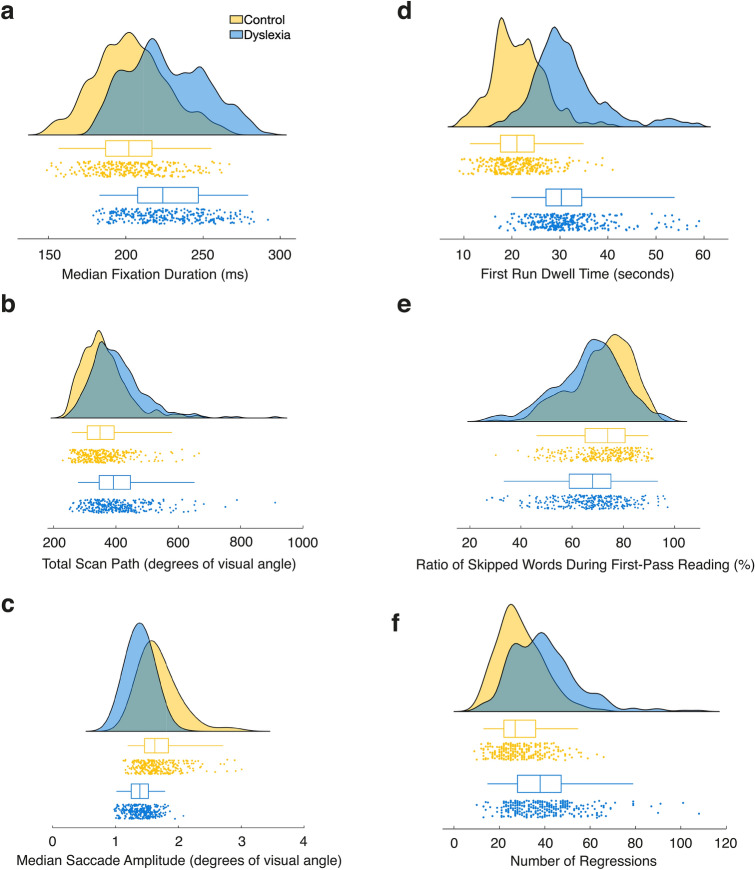
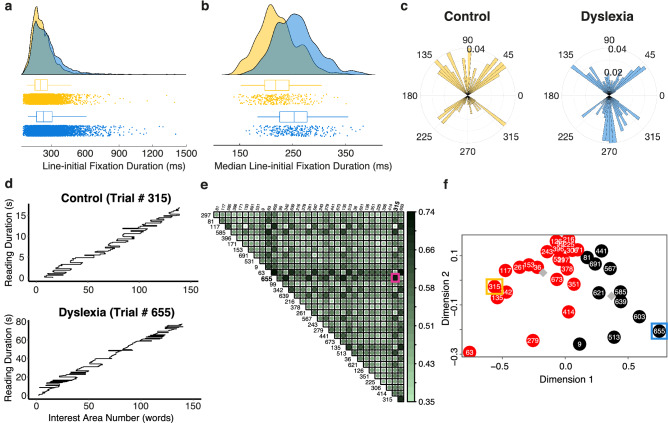
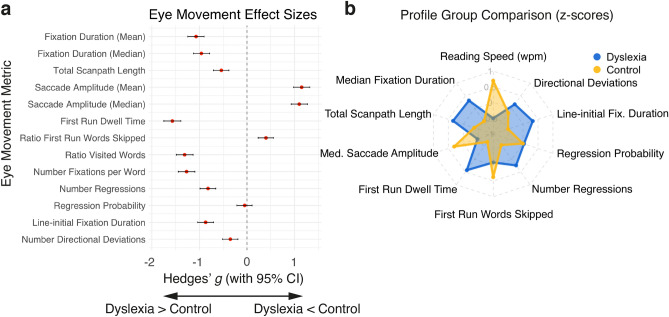
Individuals with dyslexia present with reading-related deficits including inaccurate and/or less fluent word recognition and poor decoding abilities. Slow reading speed and worse text comprehension can occur as secondary consequences of these deficits. Reports of visual symptoms such as atypical eye movements during reading gave rise to a search for these deficits' underlying mechanisms. This study sought to replicate established behavioral deficits in reading and cognitive processing speed while investigating their underlying mechanisms in more detail by developing a comprehensive profile of eye movements specific to reading in adult dyslexia. Using a validated standardized reading assessment, our findings confirm a reading speed deficit among adults with dyslexia. We observed different eye movements in readers with dyslexia across numerous eye movement metrics including the duration of a stop (i.e., fixation), the length of jumps (i.e., saccades), and the number of times a reader's eyes expressed a jump atypical for reading. We conclude that individuals with dyslexia visually sample written information in a laborious and more effortful manner that is fundamentally different from those without dyslexia. Our findings suggest a mix of aberrant cognitive linguistic and oculomotor processes being present in adults with dyslexia.


Conflict of interest statement

The authors declare no competing interests.

Figures

Figure 1
Figure 1
Experimental paradigm and example of stimuli. (a) Pictorial depiction of the sequence of events of one trial. The entire paradigm was participant controlled by pressing the space bar. A drift correction circle (the circle was smaller than depicted) directed the participant’s eyes to the starting location of the text. While fixating at it, participants pressed the space bar to get a text to appear that was then read silently once. Immediately after participants finished reading, they were asked to answer a short multiple-choice attention question relating to the content of the preceding text without time pressure. This process was repeated ten times. (b) Example of one text and its corresponding attention question (panel d) displayed in Times New Roman font. Note that this text was not presented and just constitutes an example comparable to the texts from the commercial reading assessment (IReST). The original texts are protected. (c) Example of the same text and its multiple-choice question displayed in OpenDyslexic font. (d) Example of the multiple-choice attention question accompanying the texts shown in panels b and c. Attention questions were always presented in the same font than their preceding text.
Figure 2
Figure 2
Behavioral results. (a) Caterpillar plot of median reading speed (words per minute) per participant sorted in ascending order. Blue dots represent participants of the dyslexia group whereas yellow dots represent participants of the control group. (b) Single-trial reading duration in seconds by group. Groups are color-coded as in (a). (c) Attention to the texts as a measure of reading comprehension. Color notation as in (a). (d) Cognitive processing speed from the WAIS-IV scale by group. Higher scores illustrate faster processing speed. The left-hand side (i.e., yellow/light color) of each violin plot depicts scores of the control group; the right-hand side (i.e., blue/dark color) depicts scores of the dyslexia group. Red crosses denote group means, black squares group medians. (e) Correlation between reading duration (seconds) and standardized coding processing speed scores across all participants. The shown correlation coefficient (r) and p-value resulted from a robust bend correlation analysis (n = 67). Colors indicate down-weighted data points: red for data in X, green for data in Y and black for data in X and Y dimensions. In each dimension, 20% of the data points were down-weighted. This figure is best viewed in color.
Figure 3
Figure 3
Group comparison of selected traditional eye movement metrics. Plots display trial-based eye movement metrics that showed significant differences between groups. Each panel depicts the group comparison collapsed across fonts as a raincloud plot for the respective metric. Kernel density plots depict the frequency of occurrence of a value while scatterplots display the underlying values as in one average value per trial. Boxplots indicate the median, upper and lower quartile, and whiskers the 95% CI. Blue (dark) color represents data of the dyslexia group whereas yellow (bright) color depicts data of the control group. (a) Median fixation duration in milliseconds. (b) Total scan path in degrees of visual angle. (c) Median saccade amplitude in degrees of visual angle. (d) First run dwell time in seconds. That is, the sum of all fixation durations during a first visit to a word if it has not been visited or skipped before. (e) Ratio of words that were skipped during first-pass reading. This excludes all fixations on a word that occurred after a regression to a previous word was completed. (f) Number of regressions. That is, leftward saccades to preceding words that have already been visited or skipped.
Figure 4
Figure 4
Contemporary eye movements typical and atypical for reading. (a) Duration of all identified line-initial fixations by group. That is, the very first “valid” fixation on the first two words of a line not followed by a leftwards corrective saccade. Boxplots indicate the median, upper and lower quartile, and whiskers the 95% CI. Blue (dark) color represents data of the dyslexia group whereas yellow (bright) color depicts data of the control group. (b) Median line-initial fixation duration per trial by group. Color scheme and box plot properties as in (a). (c) Group comparison of the frequency of directional deviations by angle across all trials depicted as polar histograms. Saccade angle and frequency are depicted in bins of 2.75° width. Only saccade angles between ± 35° and ± 145° (displayed as 35/145° and 215/325°) qualified as directional deviations. 0° equals horizontal rightward direction of reading. All other saccades were excluded from this analysis. d) Example of two scanpaths after reading the same text (IReST #10) displayed in Times New Roman font. Scanpaths are depicted over time (y-axis) and word-based interest areas (x-axis). Top scanpath depicts trial by a control participant, whereas the bottom scanpath depicts a trial expressed by a reader with dyslexia. (e) Pairwise, trial-based similarity matrix illustrating differences in spatial and temporal fixation patterns upon normalization by reading duration. Higher scores (darker color) denote higher dissimilarity. Pink square indicates the Scasim dissimilarity score for the two trials shown in (d). (f) Map of clusters of trials in the spatial domain (using the Euclidean distance metric) after multidimensional scaling. Red and black colored circles denote trials allocated to separate clusters. Grey diamonds indicate the centers of these clusters. Trials framed in yellow and blue represent the spatial equivalent of the same trials whose scanpaths are depicted in panel d. Colors mark groups.
Figure 5
Figure 5
Summary of effects and visual sampling strategy group profiles. (a) Effect sizes and their 95% confidence intervals (CIs) of the effect of group on eye movement metrics. Positive effect sizes (i.e., Hedges’ g) illustrate a higher number of events, longer duration or distance or a larger ratio among control participants. A negative effect size illustrates the opposite effect. Red dots denote the effect size and black bars the 95% CI for each effect size. CIs computed using the exact analytical method as implemented in the measures of effect size toolbox. Effect sizes were considered significant if the 95% CI did not include zero. (b) Radar plot depicting overall group differences in the eye movement and reading profile given selected metrics. Plots depict group averages after all trials of each measure were normalized (i.e., z-scored) for comparability. Counter-clockwise direction follows presentation order as in (a). If two variants of the same metric were present in panel a, only one of them is displayed on the radar plot for simplicity.

Similar articles

Cited by

References

    1. Rayner K. The role of eye movements in learning to read and reading disability. Remedial Spec. Educ. 1985;6:53–60. doi: 10.1177/074193258500600609. - DOI
    1. Rayner K. Eye movements in reading and information processing: 20 years of research. Psychol. Bull. 1998;124:372–422. doi: 10.1037/0033-2909.124.3.372. - DOI - PubMed
    1. Hawelka S, Gagl B, Wimmer H. A dual-route perspective on eye movements of dyslexic readers. Cognition. 2010;115:367–379. doi: 10.1016/j.cognition.2009.11.004. - DOI - PMC - PubMed
    1. Rayner K, Clifton C. Language processing in reading and speech perception is fast and incremental: Implications for event-related potential research. Biol. Psychol. 2009;80:4–9. doi: 10.1016/j.biopsycho.2008.05.002. - DOI - PMC - PubMed
    1. Sereno SC, Rayner K. Measuring word recognition in reading: Eye movements and event-related potentials. Trends Cogn. Sci. 2003;7:489–493. doi: 10.1016/j.tics.2003.09.010. - DOI - PubMed

Publication types