

Validation and verification of predictive salivary biomarkers for oral health
- PMID: 33742017
- PMCID: PMC7979790
- DOI: 10.1038/s41598-021-85120-w
Validation and verification of predictive salivary biomarkers for oral health
Abstract
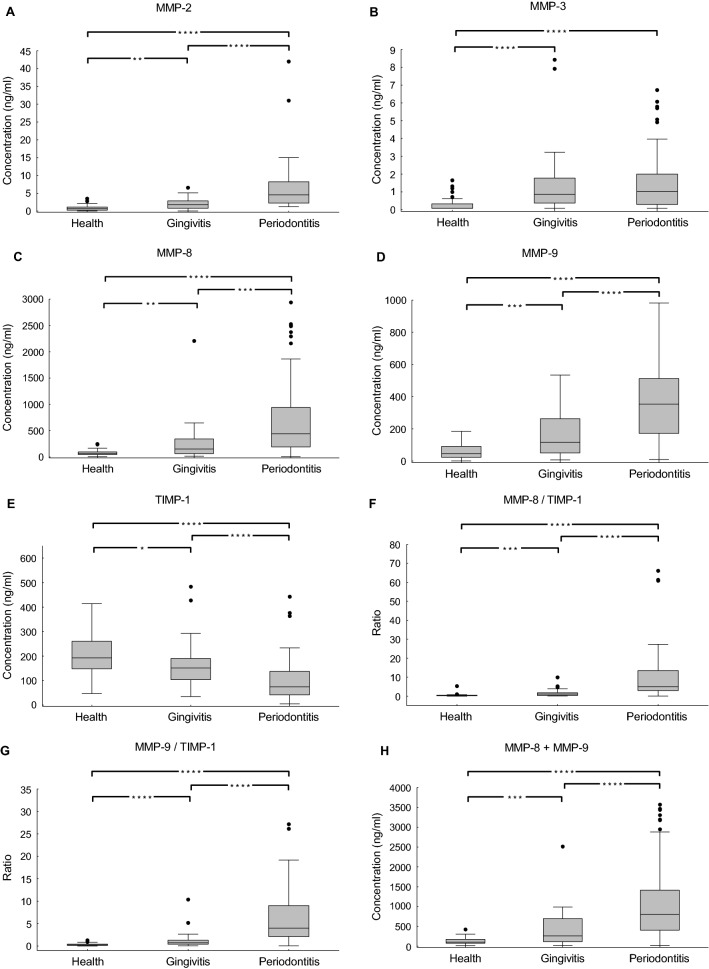
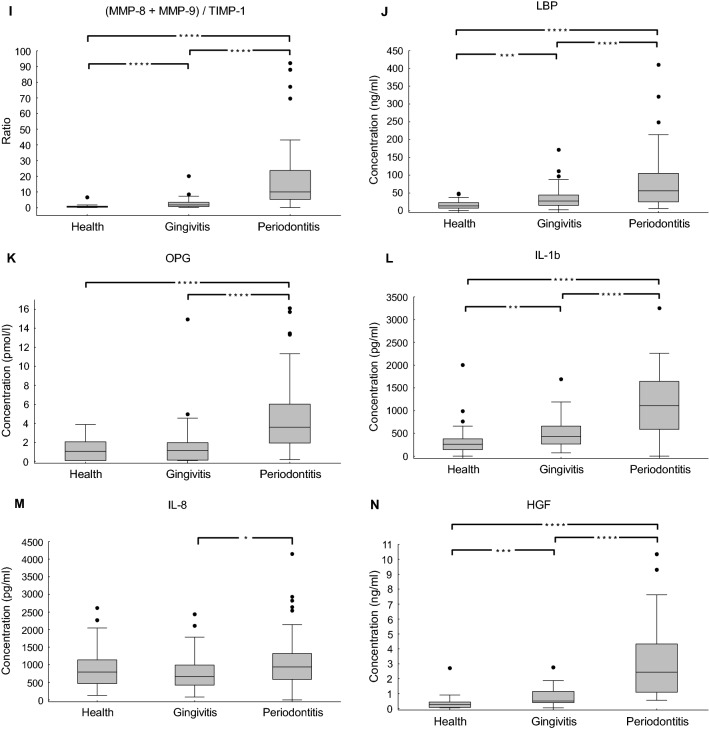
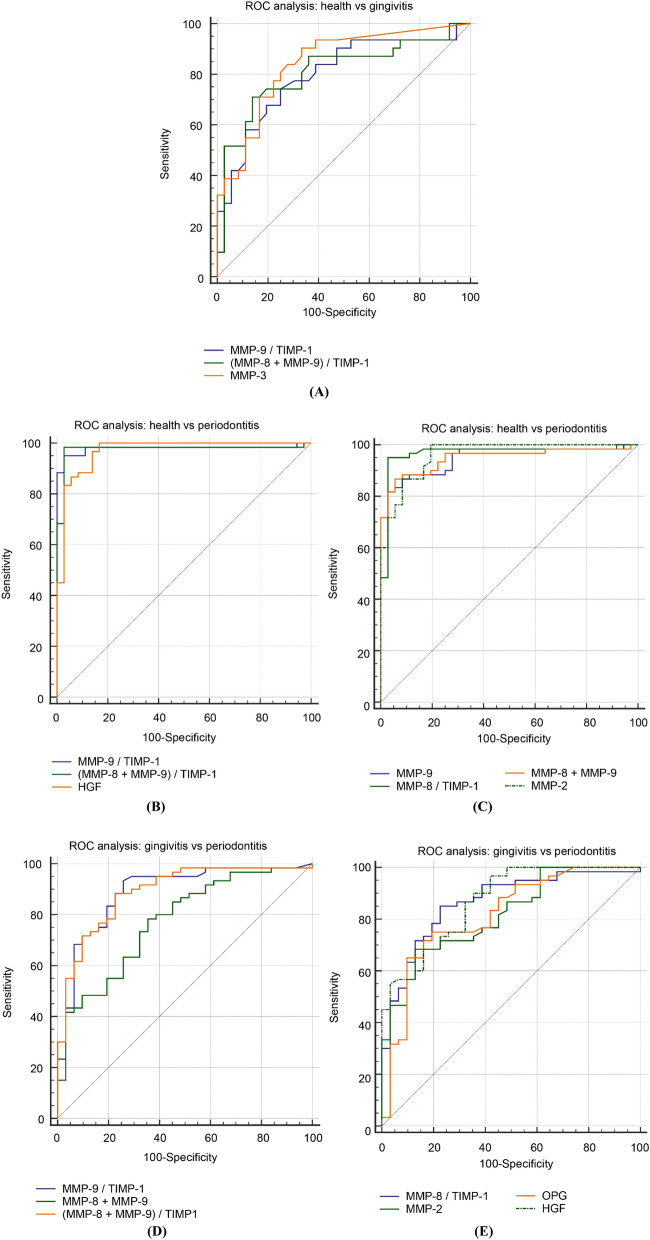
Oral health is important not only due to the diseases emerging in the oral cavity but also due to the direct relation to systemic health. Thus, early and accurate characterization of the oral health status is of utmost importance. There are several salivary biomarkers as candidates for gingivitis and periodontitis, which are major oral health threats, affecting the gums. These need to be verified and validated for their potential use as differentiators of health, gingivitis and periodontitis status, before they are translated to chair-side for diagnostics and personalized monitoring. We aimed to measure 10 candidates using high sensitivity ELISAs in a well-controlled cohort of 127 individuals from three groups: periodontitis (60), gingivitis (31) and healthy (36). The statistical approaches included univariate statistical tests, receiver operating characteristic curves (ROC) with the corresponding Area Under the Curve (AUC) and Classification and Regression Tree (CART) analysis. The main outcomes were that the combination of multiple biomarker assays, rather than the use of single ones, can offer a predictive accuracy of > 90% for gingivitis versus health groups; and 100% for periodontitis versus health and periodontitis versus gingivitis groups. Furthermore, ratios of biomarkers MMP-8, MMP-9 and TIMP-1 were also proven to be powerful differentiating values compared to the single biomarkers.
Conflict of interest statement
The authors declare no competing interests.
Figures
Similar articles
-
Salivary Colony Stimulating Factor-1 and Interleukin-34 in Periodontal Disease.J Periodontol. 2017 Aug;88(8):e140-e149. doi: 10.1902/jop.2017.170081. Epub 2017 May 5. J Periodontol. 2017. PMID: 28474967
-
Ability of matrix metalloproteinase-8 biosensor, IFMA, and ELISA immunoassays to differentiate between periodontal health, gingivitis, and periodontitis.J Periodontal Res. 2022 Jun;57(3):558-567. doi: 10.1111/jre.12985. Epub 2022 Mar 19. J Periodontal Res. 2022. PMID: 35304757 Free PMC article.
-
A Prototype Antibody-based Biosensor for Measurement of Salivary MMP-8 in Periodontitis using Surface Acoustic Wave Technology.Sci Rep. 2019 Jul 30;9(1):11034. doi: 10.1038/s41598-019-47513-w. Sci Rep. 2019. PMID: 31363141 Free PMC article.
-
Macrophage activating factor: A potential biomarker of periodontal health status.Arch Oral Biol. 2016 Oct;70:94-99. doi: 10.1016/j.archoralbio.2016.06.010. Epub 2016 Jun 9. Arch Oral Biol. 2016. PMID: 27341461 Review.
-
Association between hypertension and periodontitis: possible mechanisms.ScientificWorldJournal. 2014 Jan 8;2014:768237. doi: 10.1155/2014/768237. eCollection 2014. ScientificWorldJournal. 2014. PMID: 24526921 Free PMC article. Review.
Cited by
-
A novel plasmonic optical-fiber-based point-of-care test for periodontal MIP-1α detection.iScience. 2023 Nov 23;26(12):108539. doi: 10.1016/j.isci.2023.108539. eCollection 2023 Dec 15. iScience. 2023. PMID: 38089574 Free PMC article.
-
ImmunoDisk-A Fully Automated Bead-Based Immunoassay Cartridge with All Reagents Pre-Stored.Biosensors (Basel). 2022 Jun 14;12(6):413. doi: 10.3390/bios12060413. Biosensors (Basel). 2022. PMID: 35735560 Free PMC article.
-
Meteorin-like levels of oral fluids in periodontal health and diseases: a comparative cross-sectional study.Clin Oral Investig. 2025 Feb 18;29(2):137. doi: 10.1007/s00784-025-06222-7. Clin Oral Investig. 2025. PMID: 39964474 Free PMC article.
-
A Roadmap for the Rational Use of Biomarkers in Oral Disease Screening.Biomolecules. 2024 Jul 1;14(7):787. doi: 10.3390/biom14070787. Biomolecules. 2024. PMID: 39062501 Free PMC article. Review.
-
Determination of the Accuracy of Salivary Biomarkers for Periodontal Diagnosis.Diagnostics (Basel). 2022 Oct 14;12(10):2485. doi: 10.3390/diagnostics12102485. Diagnostics (Basel). 2022. PMID: 36292174 Free PMC article.
References
-
- Bostanci, N. & Belibasakis, G. N. Gingival crevicular fluid and its immune mediators in the proteomic era. Periodontol. 200076, 68–84. 10.1111/prd.12154 (2018). - PubMed
Publication types
MeSH terms
Substances
LinkOut - more resources
Full Text Sources
Other Literature Sources
Medical
Research Materials
Miscellaneous
