. 2021 Mar 19;5(1):23.
doi: 10.1038/s41698-021-00163-6.

Immune microenvironment characterisation and dynamics during anti-HER2-based neoadjuvant treatment in HER2-positive breast cancer

Affiliations

Immune microenvironment characterisation and dynamics during anti-HER2-based neoadjuvant treatment in HER2-positive breast cancer

G Griguolo et al. NPJ Precis Oncol. .

Abstract

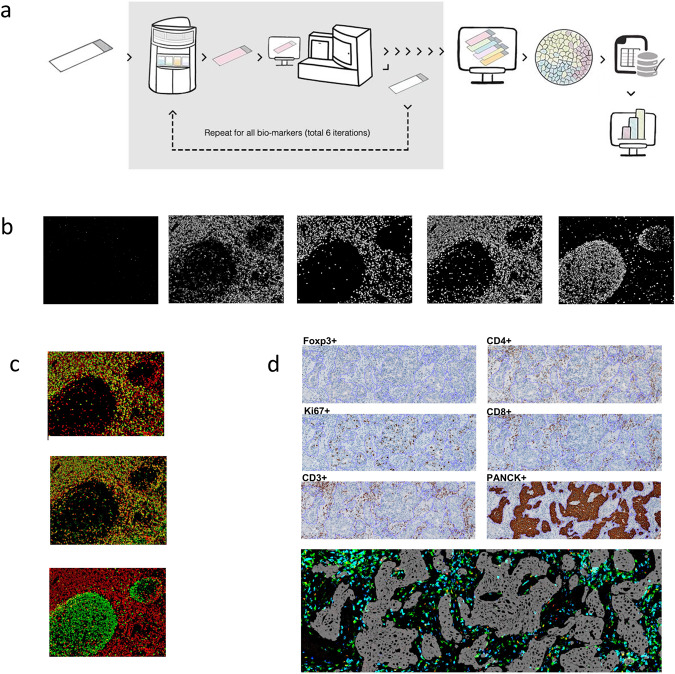
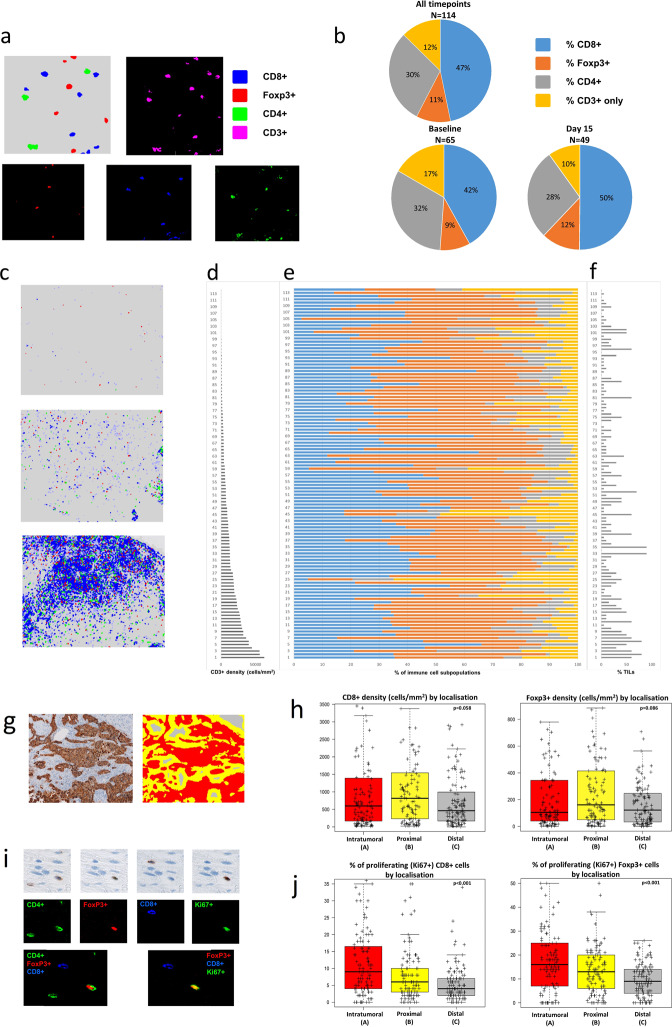
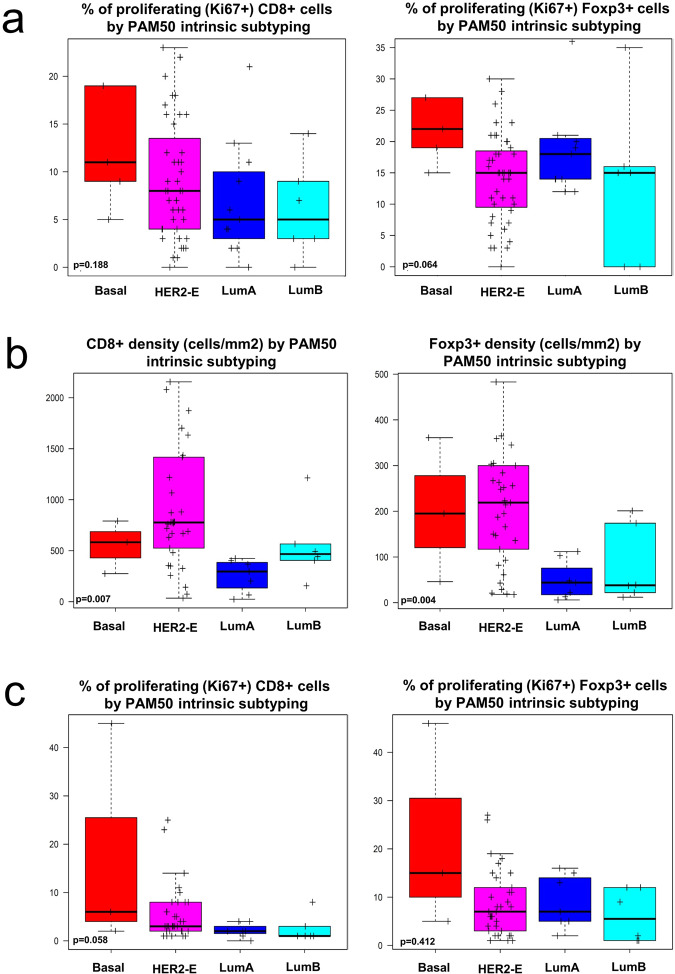
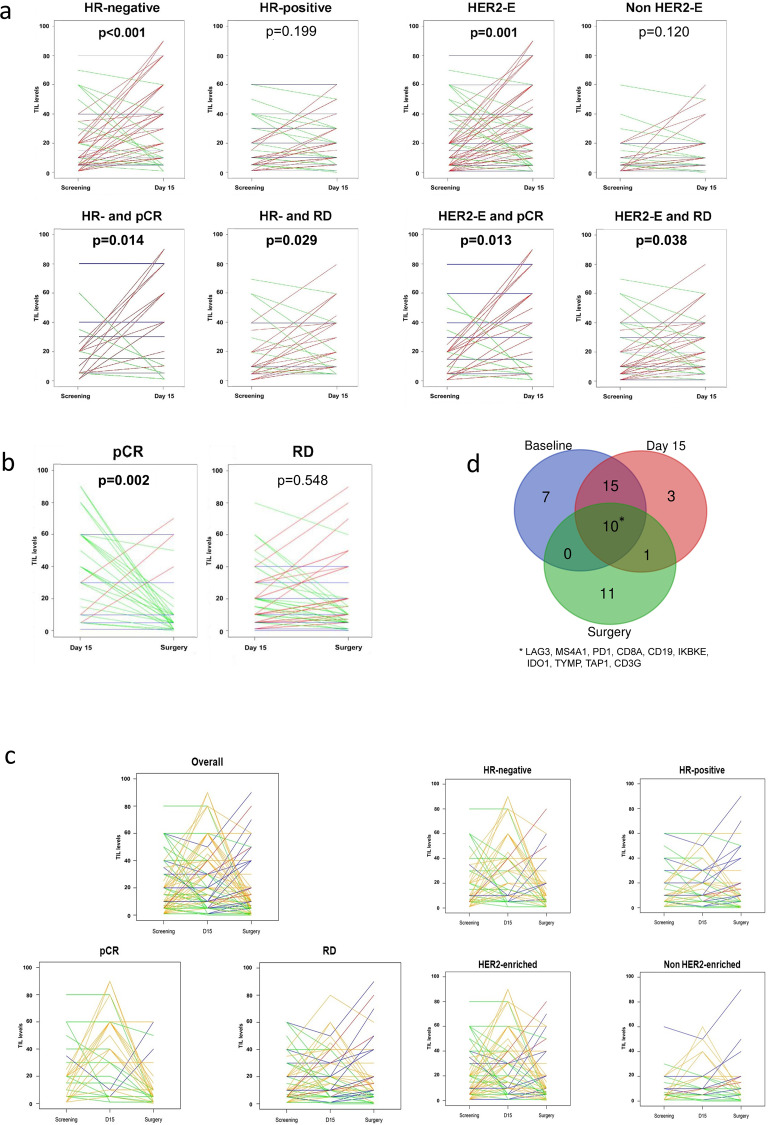
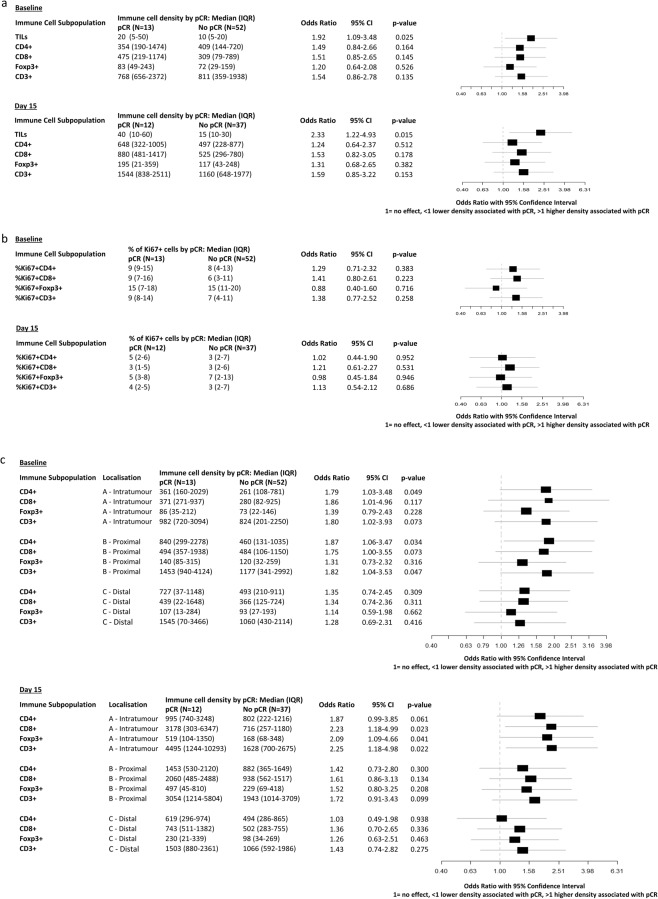
Despite their recognised role in HER2-positive (HER2+) breast cancer (BC), the composition, localisation and functional orientation of immune cells within tumour microenvironment, as well as its dynamics during anti-HER2 treatment, is largely unknown. We here investigate changes in tumour-immune contexture, as assessed by stromal tumour-infiltrating lymphocytes (sTILs) and by multiplexed spatial cellular phenotyping, during treatment with lapatinib-trastuzumab in HER2+ BC patients (PAMELA trial). Moreover, we evaluate the relationship of tumour-immune contexture with hormone receptor status, intrinsic subtype and immune-related gene expression. sTIL levels increase after 2 weeks of HER2 blockade in HR-negative disease and HER2-enriched subtype. This is linked to a concomitant increase in cell density of all four immune subpopulations (CD3+, CD4+, CD8+, Foxp3+). Moreover, immune contexture analysis showed that immune cells spatially interacting with tumour cells have the strongest association with response to anti-HER2 treatment. Subsequently, sTILs consistently decrease at the surgery in patients achieving pathologic complete response, whereas most residual tumours at surgery remain inflamed, possibly reflecting a progressive loss of function of T cells. Understanding the features of the resulting tumour immunosuppressive microenvironment has crucial implications for the design of new strategies to de-escalate or escalate systemic therapy in early-stage HER2+ BC.


Conflict of interest statement

A.P. reports consulting fees from Nanostring Technologies, Roche, Pfizer, Oncolytics Biotech, Puma, Lilly, AstraZeneca, Seattle Genetics, Novartis, Amgen, BMS, MSD and Daiichi Sankyo outside the submitted work. P.N. reports consulting fees of advisory boards from Bayer, MSD and Novartis and speaker fees from MSD and Novartis. All other authors declared no competing interest.

Figures

Fig. 1
Fig. 1. Multiplexed imaging assay.
a Next-generation immunohistochemistry (NGI) workflow. An FFPE tissue section is stained, scanned and destained six times. All the scanned images are aligned, image analysis is done to obtain the data and after doing all the quality check controls, the data are analysed to obtain the final results. b Representative colour deconvoluted images of different biomarkers in the tonsil. From left to right Foxp3+, CD3+, CD8+, CD4+ and Ki67+. Images at 6×. c Colour overlays of different biomarkers in the tonsil (CD3+ in red, CD8+, CD4+ and Ki67+ in green from top to bottom). Images at 6×. d A representative example of all the stainings (Foxp3, CD4, KI67, CD8, CD3 and cytokeratin) in breast cancer samples and virtual image reconstruction of some of them by assigning virtual colours to the deconvoluted images. Foxp3+ in red, CD8+ in blue, CD3+ in green and cytokeratin in grey. The fine purple line in each image marks the tumour borders. Images at 5×.
Fig. 2
Fig. 2. Multiplexed spatial cellular phenotyping of breast cancer.
a Representative example of the analytical pipeline classifying immune cells (top left) and colour deconvoluted images with red, green and blue colours assigned to Foxp3+, CD4+ and CD8+, respectively (bottom) and magenta for CD3+ (top right). Images at 25×. b Proportions of CD3+ immune subsets across all patients’ samples (up), baseline samples (down to the left) and day 15 samples (down to the right). CD8+, Foxp3+, CD4+ and CD3+-only in blue, orange, gray and yellow. c Representative examples of breast cancers with low (up), medium (middle) and high (down) T-cell densities. Images at 5×. d CD3+ density results across the entire population of HER2+ breast cancers. Samples are ordered from lowest to highest. e Proportions of CD8+ (blue), Foxp3+ (orange), CD4+ (gray) and CD3+ only (yellow) cells for all patients’ samples. f Stromal tumour-infiltrating lymphocytes (TILs) in breast cancer samples with available NGI data. g Representative example of the spatial analysis areas defined by the image analysis algorithm using cytokeratin as tumour mask. Intratumoural (a, in red), proximal peritumoural stroma within 30 µm (b, in yellow) and distal peritumoural stroma >30 µm from the tumour (c, in gray) regions are shown. Images at 5×. h Boxplots of immune cells densities (CD8+ and Foxp3+) according to spatial location. Boxplot legend: centre line: median; bounds of box: interquartile range (IQR); whiskers: highest and lowest value excluding outliers (Q3 + 1.5*IQR to Q1 − 1.5*IQR); markers beyond the whiskers: potential outliers. i Representative example of CD4+, Foxp3+, CD8+ and KI67+ sequential immunohistochemistry and co-expression analyses for T cells activity assessment on the same tissue slide (top panel). The colour green, red, blue and green is assigned, respectively, to each individual staining for visualisation purpose, co-expression analyses and virtually multiplexed images (first image composed by CD4, Foxp3 and CD8 and second image composed by Foxp3, CD8 and Ki67; co-expression in yellow). Images at 50×. j Boxplots of the proportion of proliferating immune cells (CD8+ and Foxp3+) according to spatial location. Boxplot legend: centre line: median; bounds of box: interquartile range (IQR); whiskers: highest and lowest value excluding outliers (Q3 + 1.5*IQR to Q1 − 1.5*IQR); markers beyond the whiskers: potential outliers.
Fig. 3
Fig. 3. Immune cell density according to intrinsic subtype.
a Boxplots of the proportion of proliferating immune cells (CD8+ and Foxp3+) at baseline according to baseline intrinsic subtyping. b Boxplots of immune cells densities (CD8+ and Foxp3+) at day 15 according to baseline intrinsic subtyping. c Boxplots of the proportion of proliferating immune cells (CD8+ and Foxp3+) at day 15 according to baseline intrinsic subtyping. Boxplot legend: centre line: median; bounds of box: interquartile range (IQR); whiskers: highest and lowest value excluding outliers (Q3 + 1.5*IQR to Q1 – 1.5*IQR); markers beyond the whiskers: potential outliers.
Fig. 4
Fig. 4. Changes in sTILs across timepoints and correlation with gene expression.
a Changes in TILs between baseline and day 15 according to hormone receptor [HR] status, subtype (HER2-enriched [HER2-E]) and response (pathological complete response [pCR] vs residual disease [RD]). Lines are coloured according to TIL dynamics: increase (red), stable (blue) or decrease (green). b Changes in TIL levels between day 15 and surgery according to response: pathological complete response [pCR] vs residual disease [RD]. Lines are coloured according to TIL dynamics: increase (red), stable (blue), or decrease (green). c Changes in TIL levels between baseline, day 15 and surgery in the overall study cohort and according to response (pathological complete response [pCR] vs residual disease [RD]), hormone receptor [HR] status and PAM50 subtype. Lines are coloured according to TIL dynamics: increase between baseline and day 15 followed by an increase between day 15 and surgery (red); increase between baseline and day 15 followed by stable or decrease between day 15 and surgery (orange); stable or decrease between baseline and day 15 followed by an increase between day 15 and surgery (blue); stable or decrease between baseline and day 15 followed by stable or decrease between day 15 and surgery (green). d Venn diagram representing overlaps in genes upregulated in relation to increase in TIL levels across the three timepoints.
Fig. 5
Fig. 5. Immune cell density and pathological complete response.
a Odds ratios (95% confidence interval) for pathologic complete response (pCR) for 10% increases in TIL levels and 1000 cells/mm2 increases in immune cell density evaluated on baseline and Day 15 (on-treatment) samples. b Odds ratios (95% confidence interval) for pathologic complete response (pCR) for increases in % of proliferating immune cells for each immune cell subpopulation evaluated on baseline and day 15 (on-treatment) samples. c Odds ratios (95% confidence interval) for pathologic complete response (pCR) for 1000 cells/mm2 increases in immune cell density according to immune cell localisation evaluated on baseline and day 15 (on-treatment) samples.

References

    1. Denkert C, et al. Tumour-infiltrating lymphocytes and prognosis in different subtypes of breast cancer: a pooled analysis of 3771 patients treated with neoadjuvant therapy. Lancet Oncol. 2018;19:40–50. doi: 10.1016/S1470-2045(17)30904-X. - DOI - PubMed
    1. Salgado R, et al. Tumor-infiltrating lymphocytes and associations with pathological complete response and event-free survival in her2-positive early-stage breast cancer treated with lapatinib and trastuzumab. JAMA Oncol. 2015;1:448. doi: 10.1001/jamaoncol.2015.0830. - DOI - PMC - PubMed
    1. Luen SJ, et al. Tumour-infiltrating lymphocytes in advanced HER2-positive breast cancer treated with pertuzumab or placebo in addition to trastuzumab and docetaxel: a retrospective analysis of the CLEOPATRA study. Lancet Oncol. 2017;18:52–62. doi: 10.1016/S1470-2045(16)30631-3. - DOI - PMC - PubMed
    1. Stanton SE, Adams S, Disis ML. Variation in the incidence and magnitude of tumor-infiltrating lymphocytes in breast cancer subtypes. JAMA Oncol. 2016;2:1354. doi: 10.1001/jamaoncol.2016.1061. - DOI - PubMed
    1. Dieci MV, et al. Integrated evaluation of PAM50 subtypes and immune modulation of pCR in HER2-positive breast cancer patients treated with chemotherapy and HER2-targeted agents in the CherLOB trial. Ann. Oncol. J. Eur. Soc. Med. Oncol. 2016;27:1867–1873. doi: 10.1093/annonc/mdw262. - DOI - PubMed