. 2021 Apr;35(4):e21528.
doi: 10.1096/fj.202100122R.

Starvation induces an increase in intracellular calcium and potentiates the progesterone-induced mouse sperm acrosome reaction

Affiliations

Starvation induces an increase in intracellular calcium and potentiates the progesterone-induced mouse sperm acrosome reaction

Claudia Sánchez-Cárdenas et al. FASEB J. 2021 Apr.

Abstract

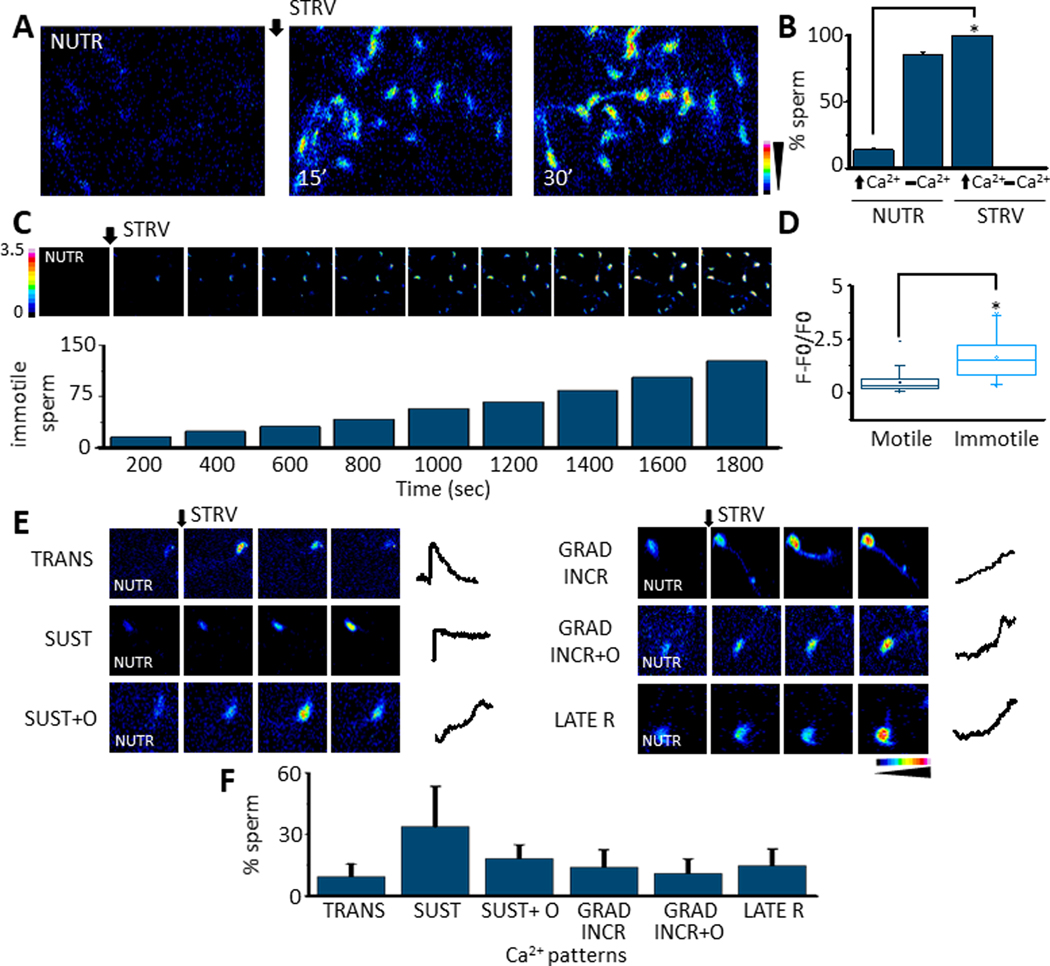
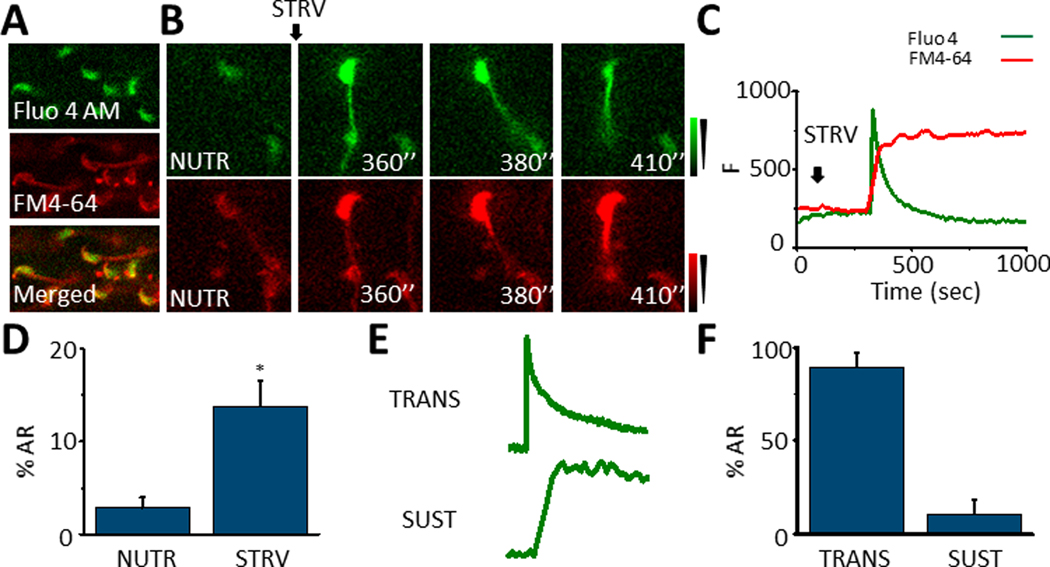
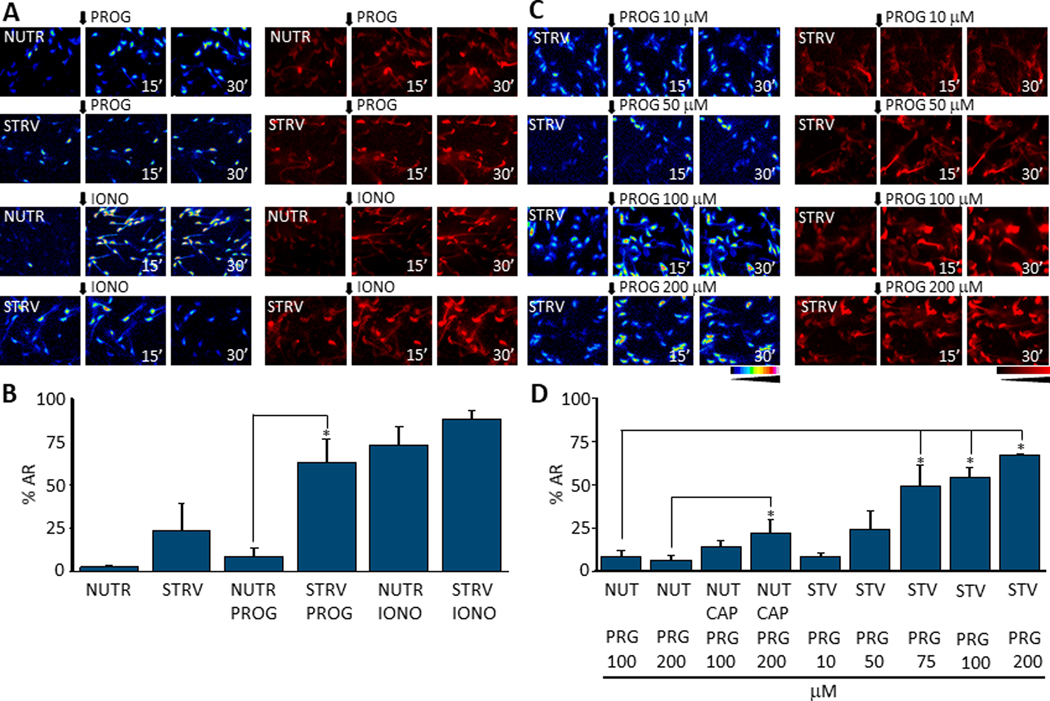
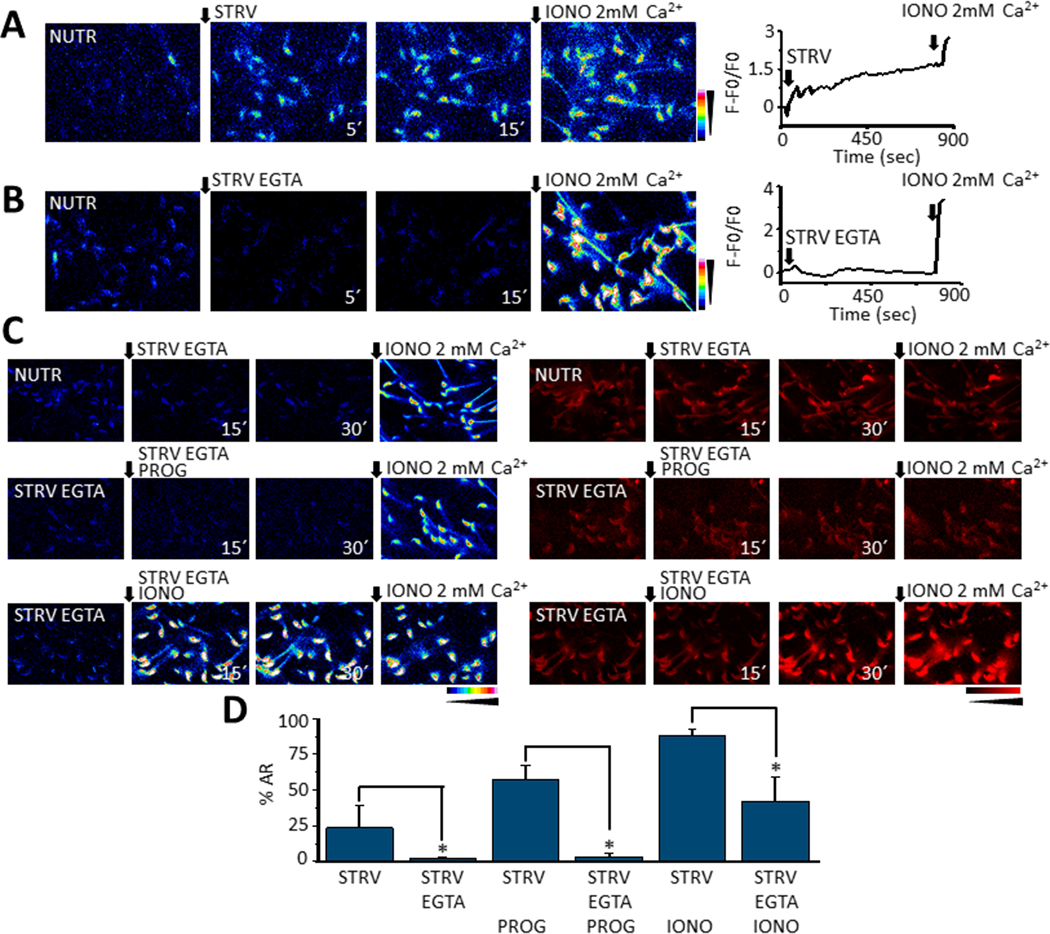
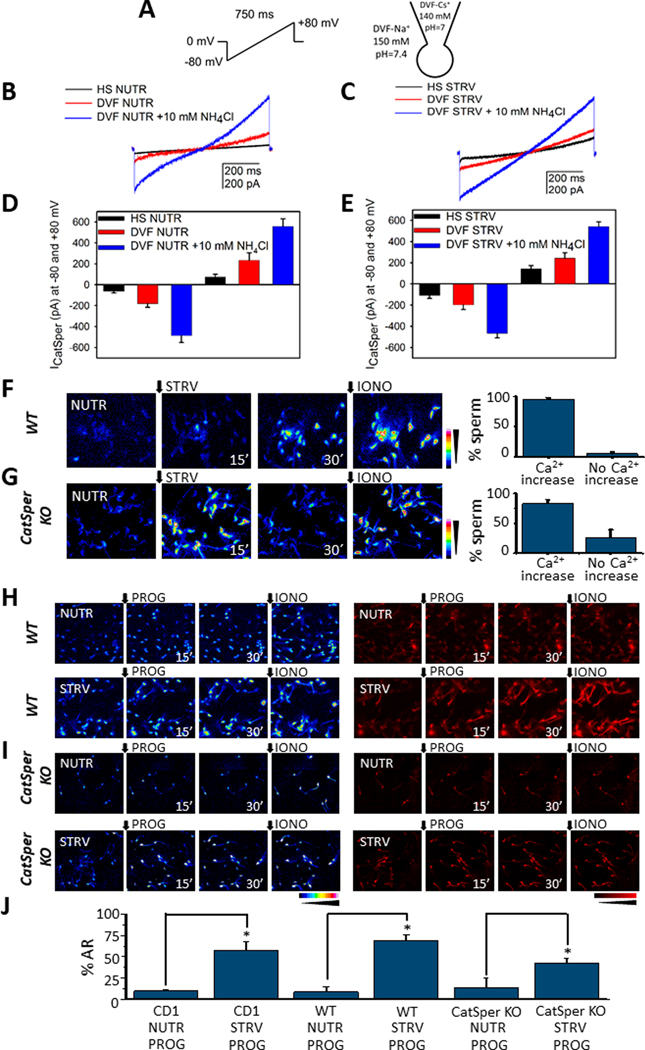
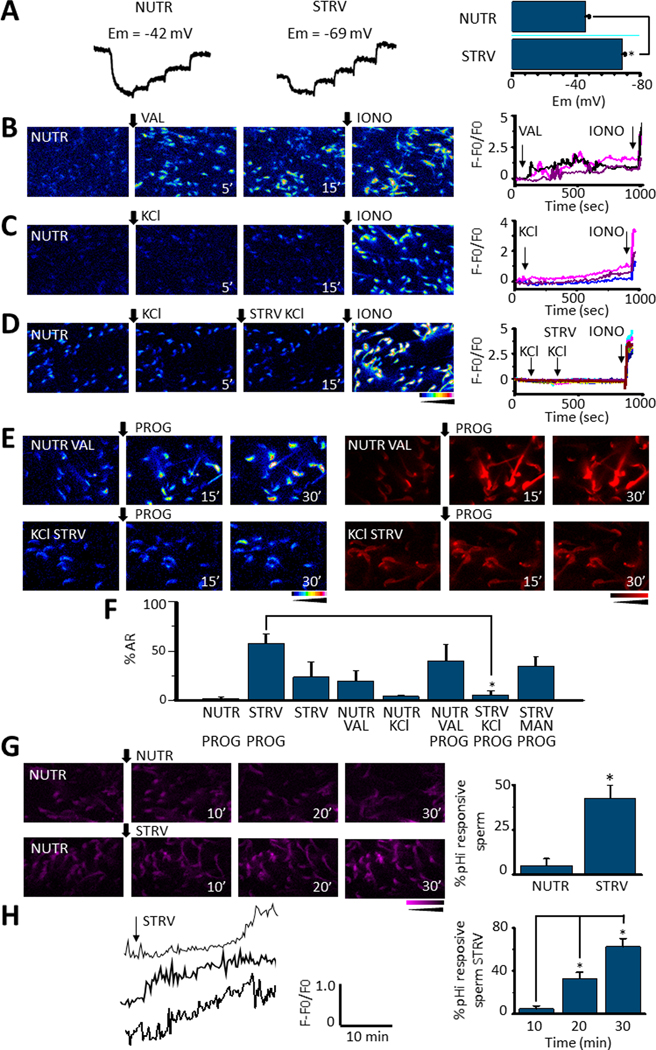
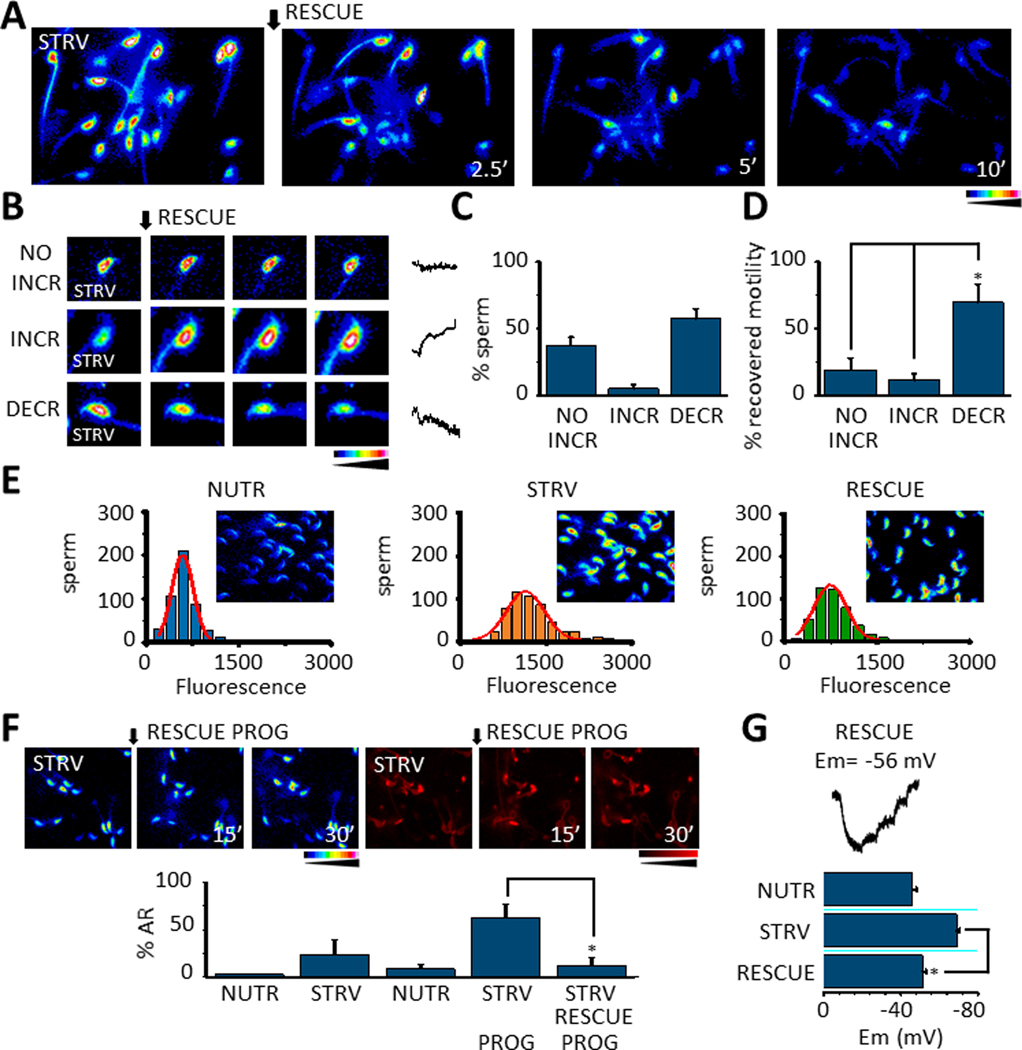
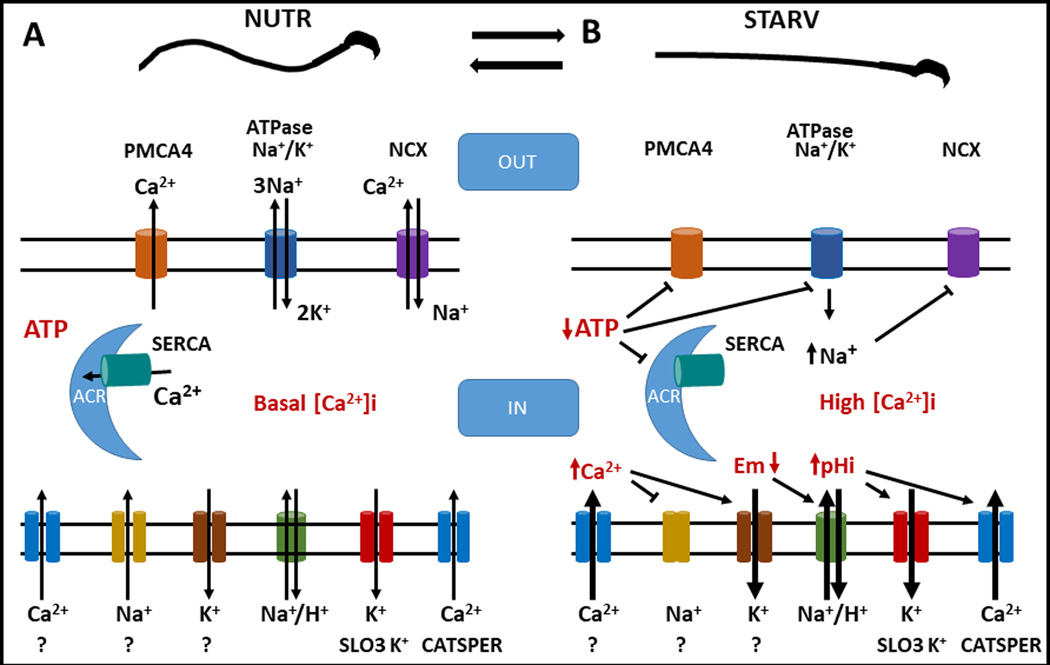
We have recently reported two different methodologies that improve sperm functionality. The first method involved transient exposure to the Ca2+ ionophore A23187 , and the second required sperm incubation in the absence of energy nutrients (starvation). Both methods were associated with an initial loss of motility followed by a rescue step involving ionophore removal or addition of energy metabolites, respectively. In this work, we show that starvation is accompanied by an increase in intracellular Ca2+ ([Ca2+ ]i ). Additionally, the starved cells acquire a significantly enhanced capacity to undergo a progesterone-induced acrosome reaction. Electrophysiological measurements show that CatSper channel remains active in starvation conditions. However, the increase in [Ca2+ ]i was also observed in sperm from CatSper null mice. Upon starvation, addition of energy nutrients reversed the effects on [Ca2+ ]i and decreased the effect of progesterone on the acrosome reaction to control levels. These data indicate that both methods have common molecular features.

Keywords: CatSper; acrosome reaction; intracellular calcium; mice sperm; progesterone; starving.


Conflict of interest statement

CONFLICT OF INTERESTS STATEMENT

Dr. Visconti owns equity interest in Sperm Capacitation Technologies Inc. a company with goals in improving assisted reproductive technologies. The others authors have not conflict of interest to declare.

Figures

Fig. 1.
Fig. 1.
A. Fluorescence image sequence showing that changing mouse sperm from a medium containing nutrients (NUTR) to one without them, named starving (STRV), induces [Ca2+]i increases in mouse sperm (n=8) B. Quantification showing the % of cells that display [Ca2+]i increases (⬆Ca2+), or no [Ca2+]i responses (▂ Ca2+]i) after either NUTR or STRV medium application. STRV medium significantly increases the number of sperm that elevate their [Ca2+]i (p=5.5E-9, t= 14.5, n=8). C. Normalized Fluo 4 fluorescence (F-F0/F0) images sequence to illustrate that the STRV medium application promotes sperm [Ca2+]i increases that lead to sperm immotility which was measured every 200 seconds and expressed as accumulated number of immotile sperm in time (n=6). D. Box plot illustrating that immotile sperm display significantly higher [Ca2+]i levels compared to motile sperm (Boxes enclose 25%−75% the data. The internal horizontal lines show the median, the squares inside the boxes indicate the average, and upper and lower small horizontal lines represent the maximum and minimum values of the data, vertical lines are SD values. (Paired t-Test p= 7.5E-9, t= 6.4, n=6) E. STRV medium application induces different [Ca2+]i elevation patterns in sperm: transitory (TRANS), sustained (SUST), sustained and others (SUST+O), gradual increase (GRAD INCR), gradual increase and others (GRAD INCR+O) and late responses (LATE R) (n=6). F. Bars summarizing the proportion of each [Ca2+]i pattern observed in sperm after STRV protocol. Black arrows ⬇ indicates the time 0’ of STRV medium application in all experiments. All results are expressed as the mean ± S.E. t-Test was applied for statistical analysis * indicates statistically significant differences, p value < 0.05.
Fig. 2.
Fig. 2.
A. Loading of sperm with Fluo 4 and FM4–64 to monitor [Ca2+]i and AR in the same cell in real time. B. Representative sperm displaying a [Ca2+]i increase and undergoing AR reported by FM4–64 fluorescence increase. C. Fluo 4 and FM4–64 fluorescence traces showing a [Ca2+]i increase and AR almost simultaneously in time after STRV medium application. D. Quantification bars showing that the STRV condition induces higher AR in comparison to NUTR medium (p= 0.005, t= 3.9, n=5). E. [Ca2+]i traces illustrating the two patterns related to AR promoted by STRV medium: transitory (TRANS) and sustained (SUST). F. Percentage of each [Ca2+]i pattern related to AR induced by STRV medium. Black arrows indicate the time 0’ of STRV medium application for the experiments. All results are expressed as the mean ± S.E. A t-Test was applied for statistical analysis * indicates statistically significant differences, p value < 0.05.
Fig. 3.
Fig. 3.
A. Fluorescence images showing [Ca2+]i levels and AR after adding progesterone (PROG) or ionomycin (IONO) to sperm previously exposed to NUTR or STRV media during 15 minutes (n=6). B. AR quantification measured after 30 minutes of agonist treatment shows that progesterone stimulation after 15 minutes of pre-incubation in STRV conditions significantly elevates AR in comparison to NUTR conditions. A t-Test was applied for statistical analysis (p = 0.007, t = 3.4 n=6). C. Fluorescence images illustrating [Ca2+]i and AR increases that are progesterone dose-dependent after STRV medium pre-incubation. D. Quantifications of experiments in C show that STRV medium pre-incubation significantly increases AR percentage at 75 μM or higher progesterone doses under STRV conditions. One way ANOVA with Bonferroni multiple comparisons test was performed (for 75 μM p = 0.012, t=3.3, n=4; for 100 μM p = 0.007, t= 4.5, n=6; for 200 μM p = 0.002, t=4.9, n=4). Black arrows indicate the time 0’ of agonist application for all experiments. All results are expressed as mean ± S.E. * indicates statistically significant differences, p value < 0.05.).
Fig. 4.
Fig. 4.
Time fluorescence images showing sperm [Ca2+]i increases promoted by STRV medium either containing normal 2 mM [Ca2+]e (A) or 100 nM [Ca2+]e (STRV EGTA) (B). Ionomycin in 2 mM [Ca2+]e (IONO 2 mM) was added as a control at the end of all recordings. In the right panels representative traces showing the [Ca2+]i changes observed in the two media containing the corresponding [Ca2+]e. Notice the STRV EGTA medium did not induce sperm [Ca2+]i responses. C. [Ca2+]i and AR time images of sperm exposed to STRV-EGTA medium after NUTR (top panel) or STRV EGTA pre-incubation (middle and lower panels) and then exposed or not to either progesterone (PROG) or ionomycin (IONO). D. Quantifications show the presence of EGTA in the STRV medium preincubation significantly reduces AR occurrence (for PROG-STRV p = 0.007, t = −3.5, n=4; for IONO-STRV p = 0.0335, t = −2.7 n=5) unless ionomycin is added at 15 sec (lower sequence). In all recordings black arrows indicate time 0’ of either STRV medium or agonists application, and the numbers at the bottom right of images are the time in seconds it was taken. t-Test was applied for statistical analysis, * indicates statistically significant differences, p value < 0.05.
Fig. 5.
Fig. 5.
A. Voltage-ramp protocol applied to generate the CatSper currents (left panel) in the whole-cell mode and ionic conditions used to record monovalent cationic current (right panel). B. Representative CatSper currents obtained in medium containing (NUTR) or not nutrients (STRV) (C), and typical increases induced by NH4Cl induced alkalization. C. Family of CatSper currents obtained as in B but without nutrients. D, E. Summary of the measurements obtained in −80 mV and +80 mV from experiments shown in B and C, respectively, (n=4). F. Fluorescence time [Ca2+]i images of sperm from WT mice in response to STRV medium (left panel). Percentage of sperm from WT mice that manifest [Ca2+]i increases after STRV medium application (right panel). G. [Ca2+]i responses promoted by STRV medium in sperm from CatSper KO mice (left panel). Right panel summarizes the percentage of CatSper KO sperm responsive to STRV media. H. [Ca2+]i and AR measurements of sperm from WT mice pre-incubated in NUTR or STRV media and then exposed to progesterone (PROG) for 30 minutes. In all single cell fluorescence experiments ionomycin was applied at the end of the recording as a control (IONO). I. [Ca2+]i and AR recordings from sperm of CatSper KO mice pre-incubated with either NUTR or STRV media and then exposed to progesterone for 30 minutes. J. Quantifications for comparison of AR promoted by progesterone after either NUTR or STRV media pre-incubation obtained in CD1, WT and CatSper KO mice. STRV medium pre-incubation significantly induces AR improvement in all the cases (WT sperm NUTR progesterone vs WT sperm STRV progesterone p= 2.06E-4, t= 5.9, n=5; KO CatSper sperm NUTR progesterone vs KO CatSper sperm STRV progesterone p = 0.03, t = 2.4, n=4. The black arrows indicate the time 0’ for either STRV medium or agonist application. t-Test was applied for statistical analysis * indicates statistically significant differences, p value < 0.05.
Fig. 6.
Fig. 6.
A. Representative DiSC3(5) fluorescence traces corresponding to sperm Em measurements during NUTR or STRV media incubation. Calibration was performed by adding 1 μM valinomycin followed by incremental KCl concentration additions (left and middle panels). Bars summarize Em values of the sperm population obtained after each condition. They show that STRV medium application significantly hyperpolarizes Em (p = 2.4E-6, t = −9.5, n=6) (right panel) B. [Ca2+]i responses to 1 μM valinomycin (VAL) addition to sperm incubated in NUTR medium. In B, C and D ionomycin (IONO) was added at the end of the experiment as a positive control and traces on the right panels correspond to individual sperm in the respective field. [Ca2+]i traces corresponding to some cells in the left panel show that valinomycin induces sperm [Ca2+]i increases (right panel). C. In contrast, 80 mM KCl only promotes a slow and small [Ca2+]i response in sperm in NUTR medium. D. [Ca2+]i responses 5 minutes after a KCl addition to sperm incubated in NUTR medium. Thereafter, cells were changed to STRV conditions and KCl applied; the image was recorded 15 minutes later. Neither in NUTR medium nor in STRV conditions was a KCl addition able to induce [Ca2+]i increases in non-capacitated sperm. However, ionomycin application promoted a clear [Ca2+]i response (right panel). E. [Ca2+]i and AR measurements of sperm pre-incubated with either valinomycin in NUTR medium or KCL under STRV conditions and then stimulated by progesterone (PROG), recording images at 15 and 30 minutes. F. Quantification of AR of experiments in E plus an osmotic control of the KCl addition in response to PROG. The results show that sperm pre-incubation in STRV medium in the presence of KCl significantly reduced AR promoted by progesterone, in comparison to cells pre-incubated in STRV medium alone (p = 1.2E-4, t = −6.8, n=5). G. Fluorescence images showing pHi changes after NUTR or STRV medium application (left panel). Percentage of sperm that display pHi increases under NUTR or STRV conditions. STRV medium application significantly elevated pHi in sperm (p = 5.0E-4, t = 6.7, n=5) (right panel). H. Representative single-cell pHi responses observed after STRV medium application (left panel). The right panel summarizes the percentage of sperm that manifest pHi increases at different times after STRV medium addition (paired t-test 10 vs 20min p = 0.012, t = −5.38; 20 vs 30 min, p = 0.03, t = −3.65, n=5 (right panel). Black arrows indicate the time 0’ for all applications and the time on the bottom when the image was recorded. All quantified results are expressed as the mean ± S.E. A t-Test was applied for statistical analysis * indicates statistically significant differences, p value < 0.05
Fig. 7.
Fig. 7.
A. [Ca2+]i recordings during the application of RESCUE conditions (adding back glucose and pyruvate, see Methods) in sperm pre-incubated with STRV medium. B. Three types of [Ca2+]i behavior were observed in sperm after RESCUE conditions: NO INCREASE (NO INCR), increase (INCR) or decrease (DECR). Example traces are shown on the right side of the figure. C. Bars summarizing experiments as in B indicate that most sperm exposed to RESCUE conditions manifest a [Ca2+]i decrease. D. Quantification bars show that a statistically significant number of sperm that recover motility decrease their [Ca2+]i (No INCR vs INCR p = 0.007, t = 3.1, n=8; NO INCR vs DECR p = 0.001, t= 4.0, n=8). E. Distribution of the number of sperm displaying a certain Fluo 4 fluorescence corresponding to [Ca2+]i levels observed in sperm under NUTR conditions, while in STRV conditions and after RESCUE treatment. F. [Ca2+]i and AR measurements during 30 minutes of progesterone (PROG) treatment under RESCUE conditions after sperm were exposed to STRV medium during 15 minutes (top panel). Quantifications show that progesterone applied under RESCUE conditions significantly reduces its potential to induce AR (p = 0.01, t = −3.22, n= 5) (low panel). G. Representative Em trace of sperm exposed to STRV media and then to RESCUE conditions (top panel). Bars summarizing Em values of sperm recorded under NUTR, STRV and then RESCUE conditions showing that RESCUE conditions significantly hyperpolarize sperm Em in comparison to STRV conditions (p = 3.5E-6, t = 9.1, n=6) (lower panel). In all the experiments the quantified data plotted are mean ± S.E. A t-Test was applied for statistical analysis * indicates statistically significant differences when p value < 0.05.
Fig. 8.
Fig. 8.
A. Model proposing that under NUTR conditions a basal Ca2+ entry occurs, the presence of intracellular ATP concentration allows the proper function of intracellular Ca2+ clearance mechanisms such as PMCA4 and SERCA pumps. During NUTR incubation also the Na+/K+ ATPase and the NCX exchanger work normally and all mechanisms functioning together maintain low levels of [Ca2+]I, and Em and pHi are maintained stable. B. Once sperm are exposed to STRV conditions, the intracellular ATP concentrations decrease and inhibit the normal operation of pumps and transporters, increasing the [Ca2+]i in sperm. [Ca2+]i elevation in sperm somehow activates K+ channels and/or inhibits Na+ permeable channels that contribute to Em hyperpolarization, which in turn activate the Na+/H+ transporter that would increase pHi and stimulate SLO3 and CatSper channels increasing, even more the [Ca2+]i accumulation.

Similar articles

Cited by

References

    1. Yanagimachi R The Physiology of Reproduction New York: Knobil; & Neill JD (Eds.);1994. 317 pp.
    1. Gervasi MG, & Visconti PE Chang’s meaning of capacitation: A molecular perspective. Mol Reprod Dev 2016;83:860–874. - PubMed
    1. Ren D, Navarro B, Perez G, Jackson AC, Hsu S, Shi Q, Clapham DE A sperm ion channel required for sperm motility and male fertility. Nature 2001;413;603–609. - PMC - PubMed
    1. Chang H, & Suarez SS Two distinct Ca(2+) signaling pathways modulate sperm flagellar beating patterns in mice. Biol Reprod 2011;85:296–305. - PMC - PubMed
    1. Inoue N, Satouh Y, Ikawa M, Okabe M, & Yanagimachi R. Acrosome-reacted mouse spermatozoa recovered from the perivitelline space can fertilize other eggs. Proc Natl Acad Sci U S A 2011;108:20008–20011. - PMC - PubMed

Publication types

LinkOut - more resources