

Impact of iron raw materials and their impurities on CHO metabolism and recombinant protein product quality
- PMID: 33742789
- PMCID: PMC8459231
- DOI: 10.1002/btpr.3148
Impact of iron raw materials and their impurities on CHO metabolism and recombinant protein product quality
Abstract
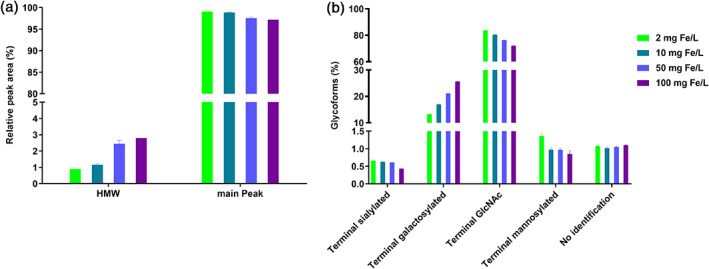
Cell culture medium (CCM) composition affects cell growth and critical quality attributes (CQAs) of monoclonal antibodies (mAbs) and recombinant proteins. One essential compound needed within the medium is iron because of its central role in many cellular processes. However, iron is also participating in Fenton chemistry leading to the formation of reactive oxygen species (ROS) causing cellular damage. Therefore, this study sought to investigate the impact of iron in CCM on Chinese hamster ovary (CHO) cell line performance, and CQAs of different recombinant proteins. Addition of either ferric ammonium citrate (FAC) or ferric citrate (FC) into CCM revealed major differences within cell line performance and glycosylation pattern, whereby ammonium was not involved in the observed differences. Inductively coupled plasma mass spectrometry (ICP-MS) analysis identified varying levels of impurities present within these iron sources, and manganese impurity rather than iron was proven to be the root cause for increased cell growth, titer, and prolonged viability, as well as altered glycosylation levels. Contrary effects on cell performance and protein glycosylation were observed for manganese and iron. The use of low impurity iron raw material is therefore crucial to control the effect of iron and manganese independently and to support and guarantee consistent and reproducible cell culture processes.
Keywords: cell culture medium; iron; low impurity; raw material impurity; recombinant protein product quality.
© 2021 Merck KGaA, Darmstadt, Germany. Biotechnology Progress published by Wiley Periodicals LLC on behalf of American Institute of Chemical Engineers.
Conflict of interest statement
All authors are employees of Merck KGaA, Germany.
Figures


Similar articles
-
Copper impurity of iron raw material contributes to improved cell culture performance.Biotechnol Prog. 2022 Jul;38(4):e3251. doi: 10.1002/btpr.3251. Epub 2022 Apr 18. Biotechnol Prog. 2022. PMID: 35318833 Free PMC article.
-
Impact of cell culture media additives on IgG glycosylation produced in Chinese hamster ovary cells.Biotechnol Bioeng. 2019 Apr;116(4):816-830. doi: 10.1002/bit.26904. Epub 2019 Jan 21. Biotechnol Bioeng. 2019. PMID: 30552760 Free PMC article.
-
Identification of cell culture conditions to control N-glycosylation site-occupancy of recombinant glycoproteins expressed in CHO cells.Biotechnol Bioeng. 2009 Aug 15;103(6):1164-75. doi: 10.1002/bit.22348. Biotechnol Bioeng. 2009. PMID: 19418565
-
Factors affecting the quality of therapeutic proteins in recombinant Chinese hamster ovary cell culture.Biotechnol Adv. 2022 Jan-Feb;54:107831. doi: 10.1016/j.biotechadv.2021.107831. Epub 2021 Sep 2. Biotechnol Adv. 2022. PMID: 34480988 Review.
-
Consequences of trace metal variability and supplementation on Chinese hamster ovary (CHO) cell culture performance: A review of key mechanisms and considerations.Biotechnol Bioeng. 2019 Dec;116(12):3446-3456. doi: 10.1002/bit.27140. Epub 2019 Aug 30. Biotechnol Bioeng. 2019. PMID: 31403183 Review.
Cited by
-
Replacement of Isoleucine and Leucine by their Keto Acids leads to increased formation of α-Hydroxy Acids in Chinese Hamster Ovary cells.Biotechnol J. 2025 Jun;20(6):e70041. doi: 10.1002/biot.70041. Biotechnol J. 2025. PMID: 40490996 Free PMC article.
-
Stability and Requirement for Thiamin in a Cell Culture Feed Used to Produce New Biological Entities.Cells. 2023 Jan 16;12(2):334. doi: 10.3390/cells12020334. Cells. 2023. PMID: 36672269 Free PMC article.
-
Impact of Various Forced Oxidative Stress Factors in Rapid Degradation of mAb: Trastuzumab as a Case Study.Pharm Res. 2025 Feb;42(2):335-351. doi: 10.1007/s11095-025-03816-4. Epub 2025 Jan 23. Pharm Res. 2025. PMID: 39849217
-
Copper impurity of iron raw material contributes to improved cell culture performance.Biotechnol Prog. 2022 Jul;38(4):e3251. doi: 10.1002/btpr.3251. Epub 2022 Apr 18. Biotechnol Prog. 2022. PMID: 35318833 Free PMC article.
-
Taurine, a Naturally Occurring Amino Acid, as a Physical Stability Enhancer of Different Monoclonal Antibodies.AAPS J. 2024 Feb 14;26(1):25. doi: 10.1208/s12248-024-00893-y. AAPS J. 2024. PMID: 38355847
References
Publication types
MeSH terms
Substances
LinkOut - more resources
Full Text Sources
Other Literature Sources
Medical
