. 2021 Aug 5;28(8):1428-1442.e6.
doi: 10.1016/j.stem.2021.03.002. Epub 2021 Mar 19.

Chronic infection drives Dnmt3a-loss-of-function clonal hematopoiesis via IFNγ signaling

Affiliations

Chronic infection drives Dnmt3a-loss-of-function clonal hematopoiesis via IFNγ signaling

Daniel Hormaechea-Agulla et al. Cell Stem Cell. .

Abstract

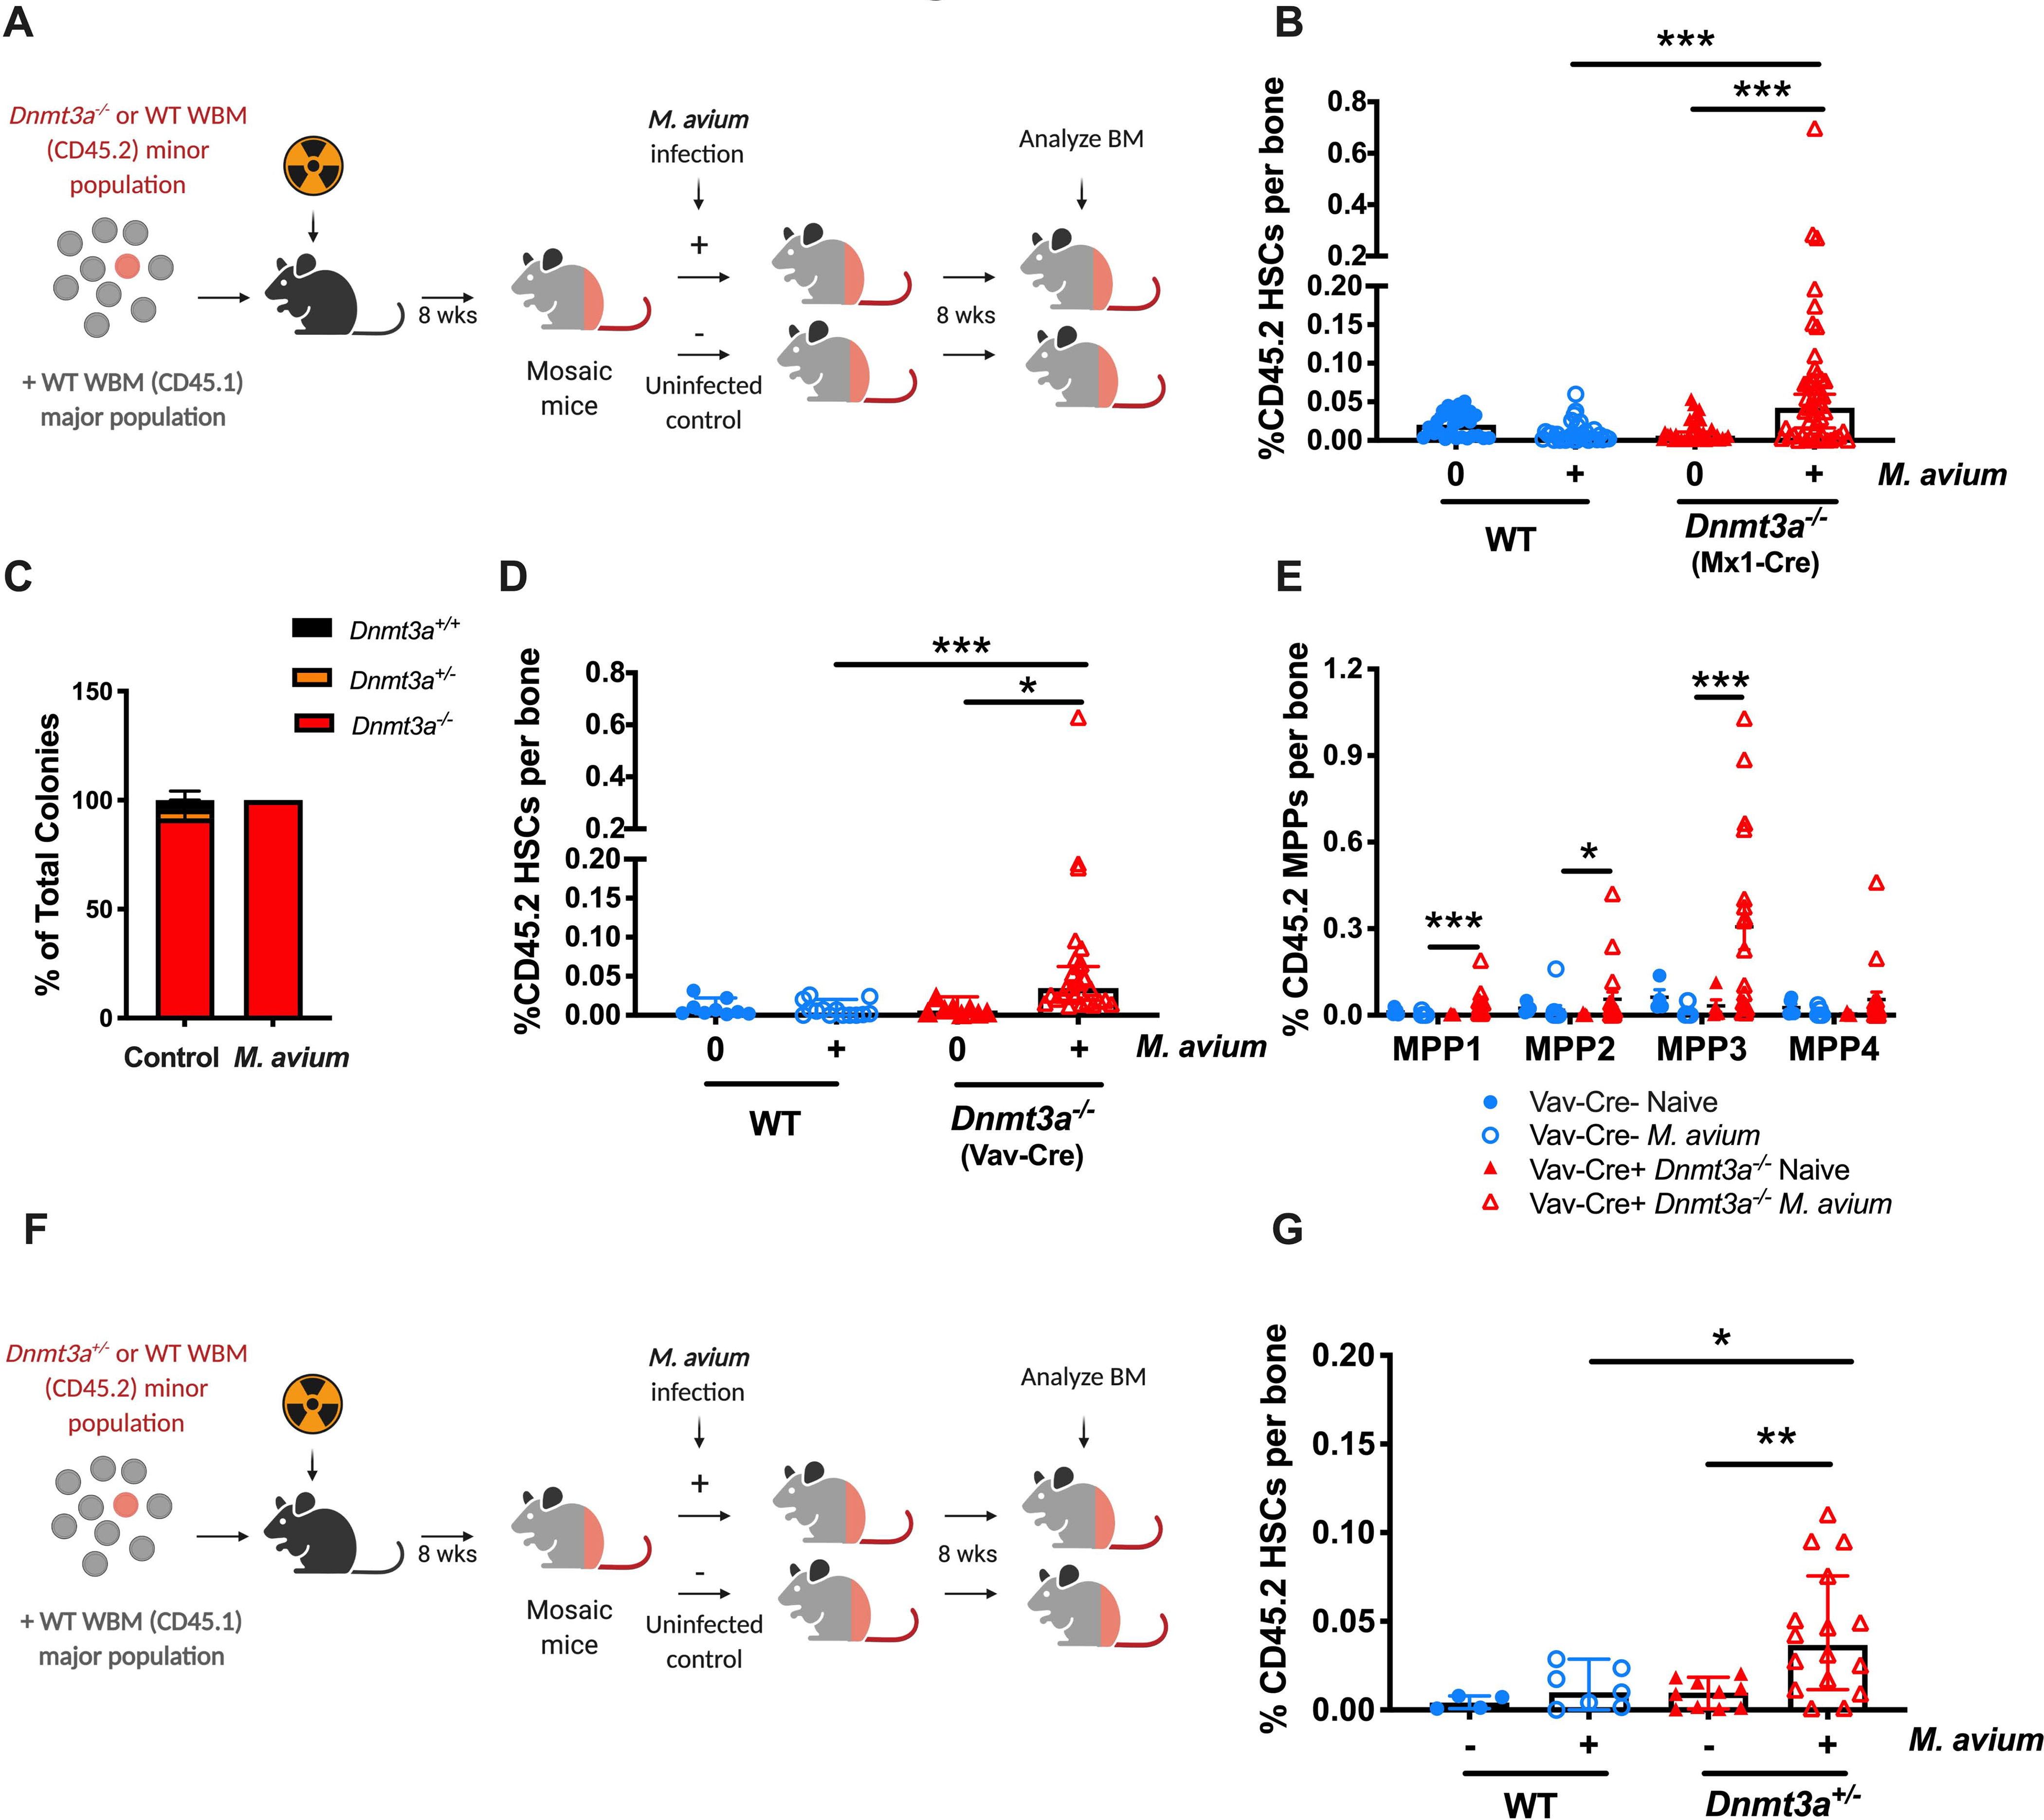
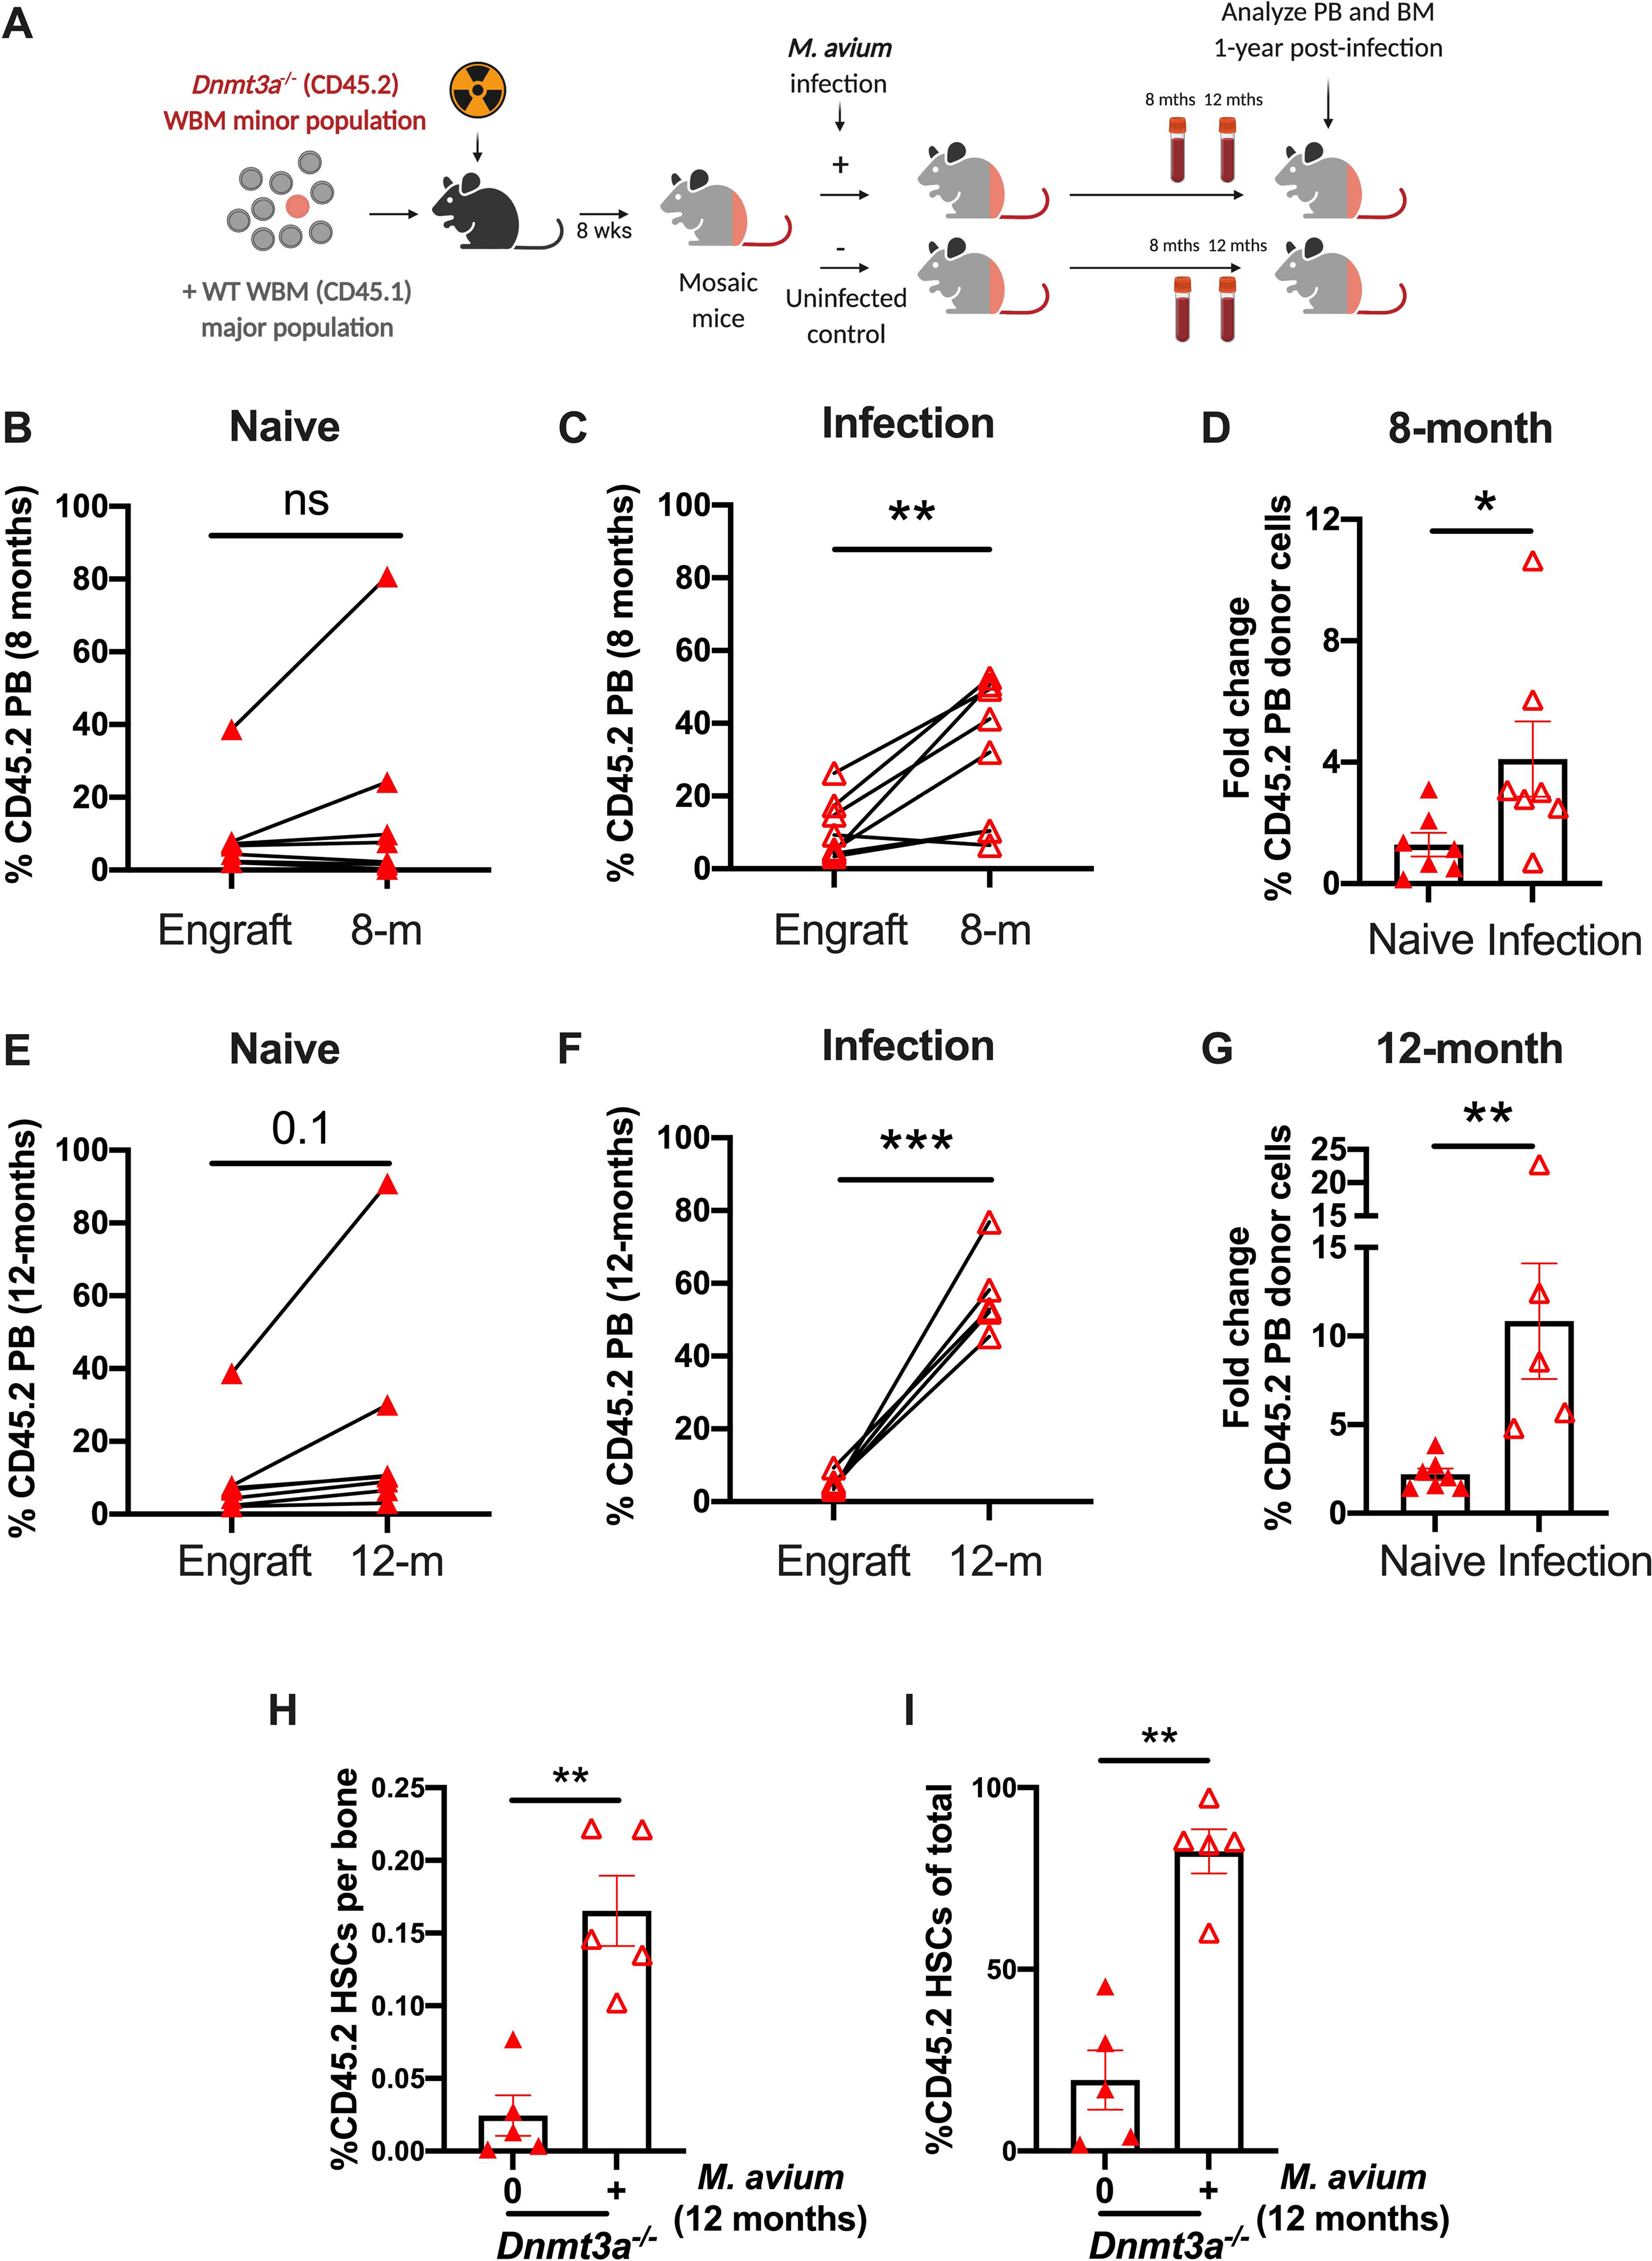
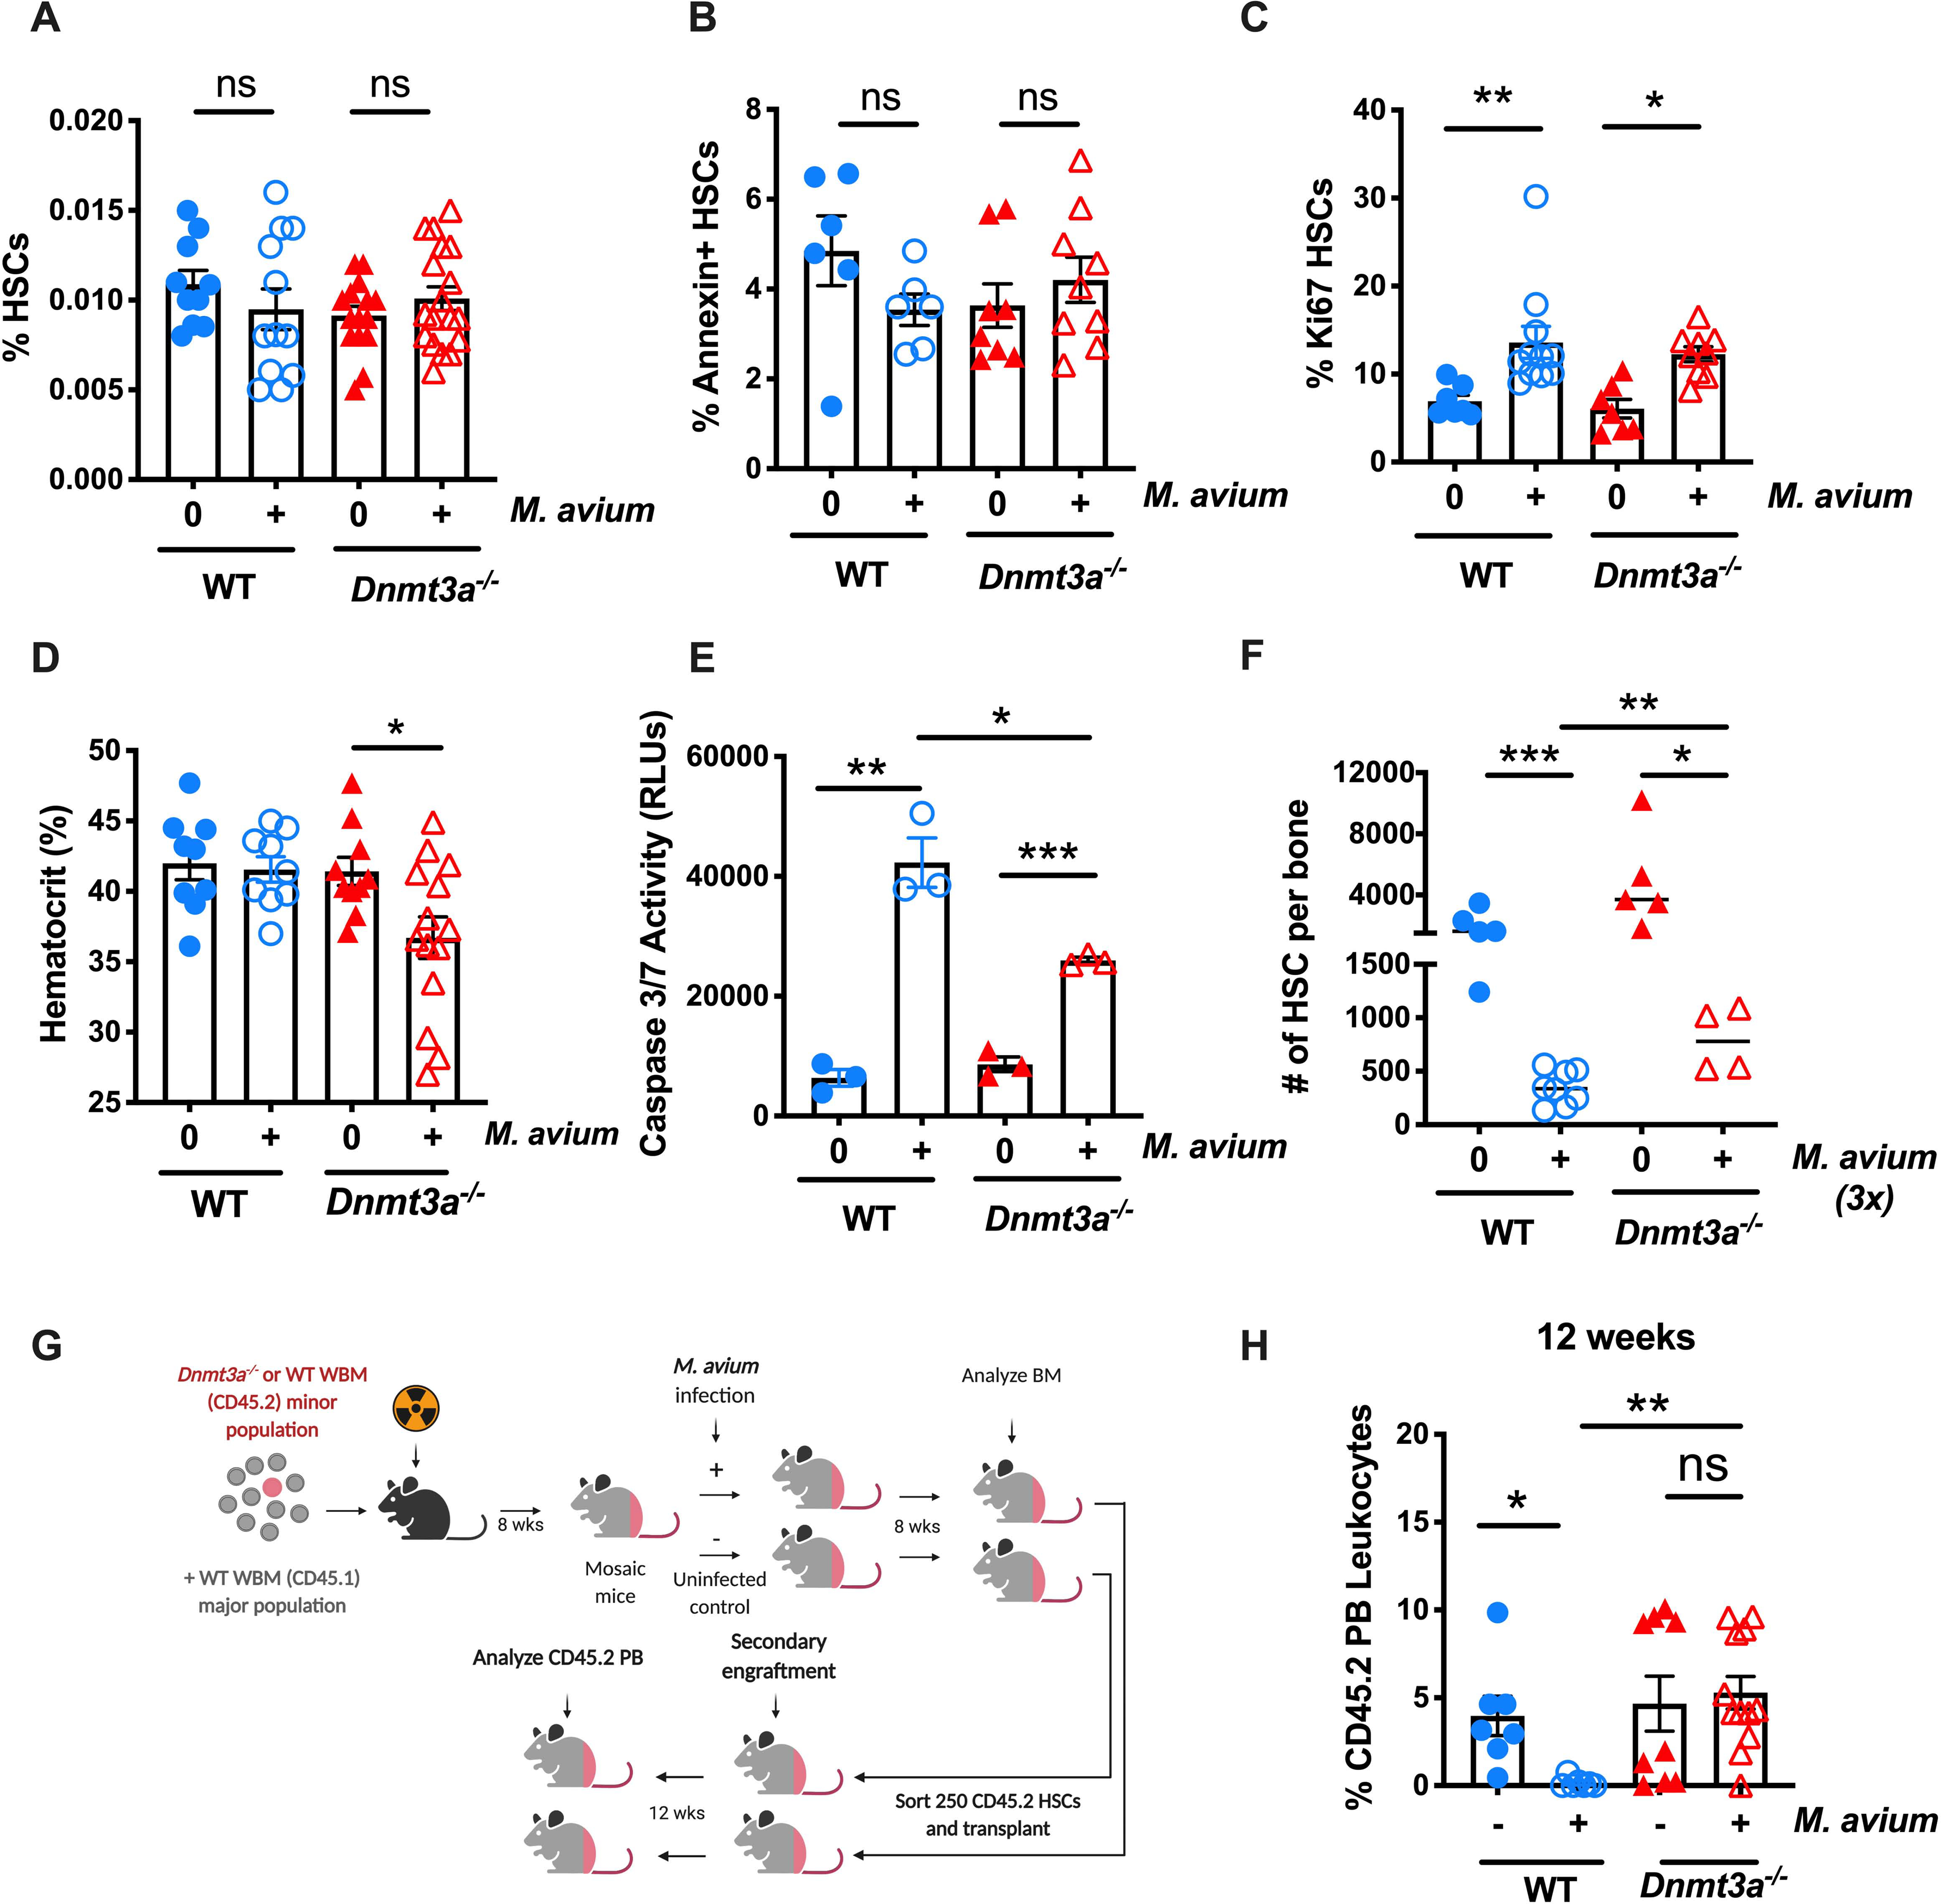
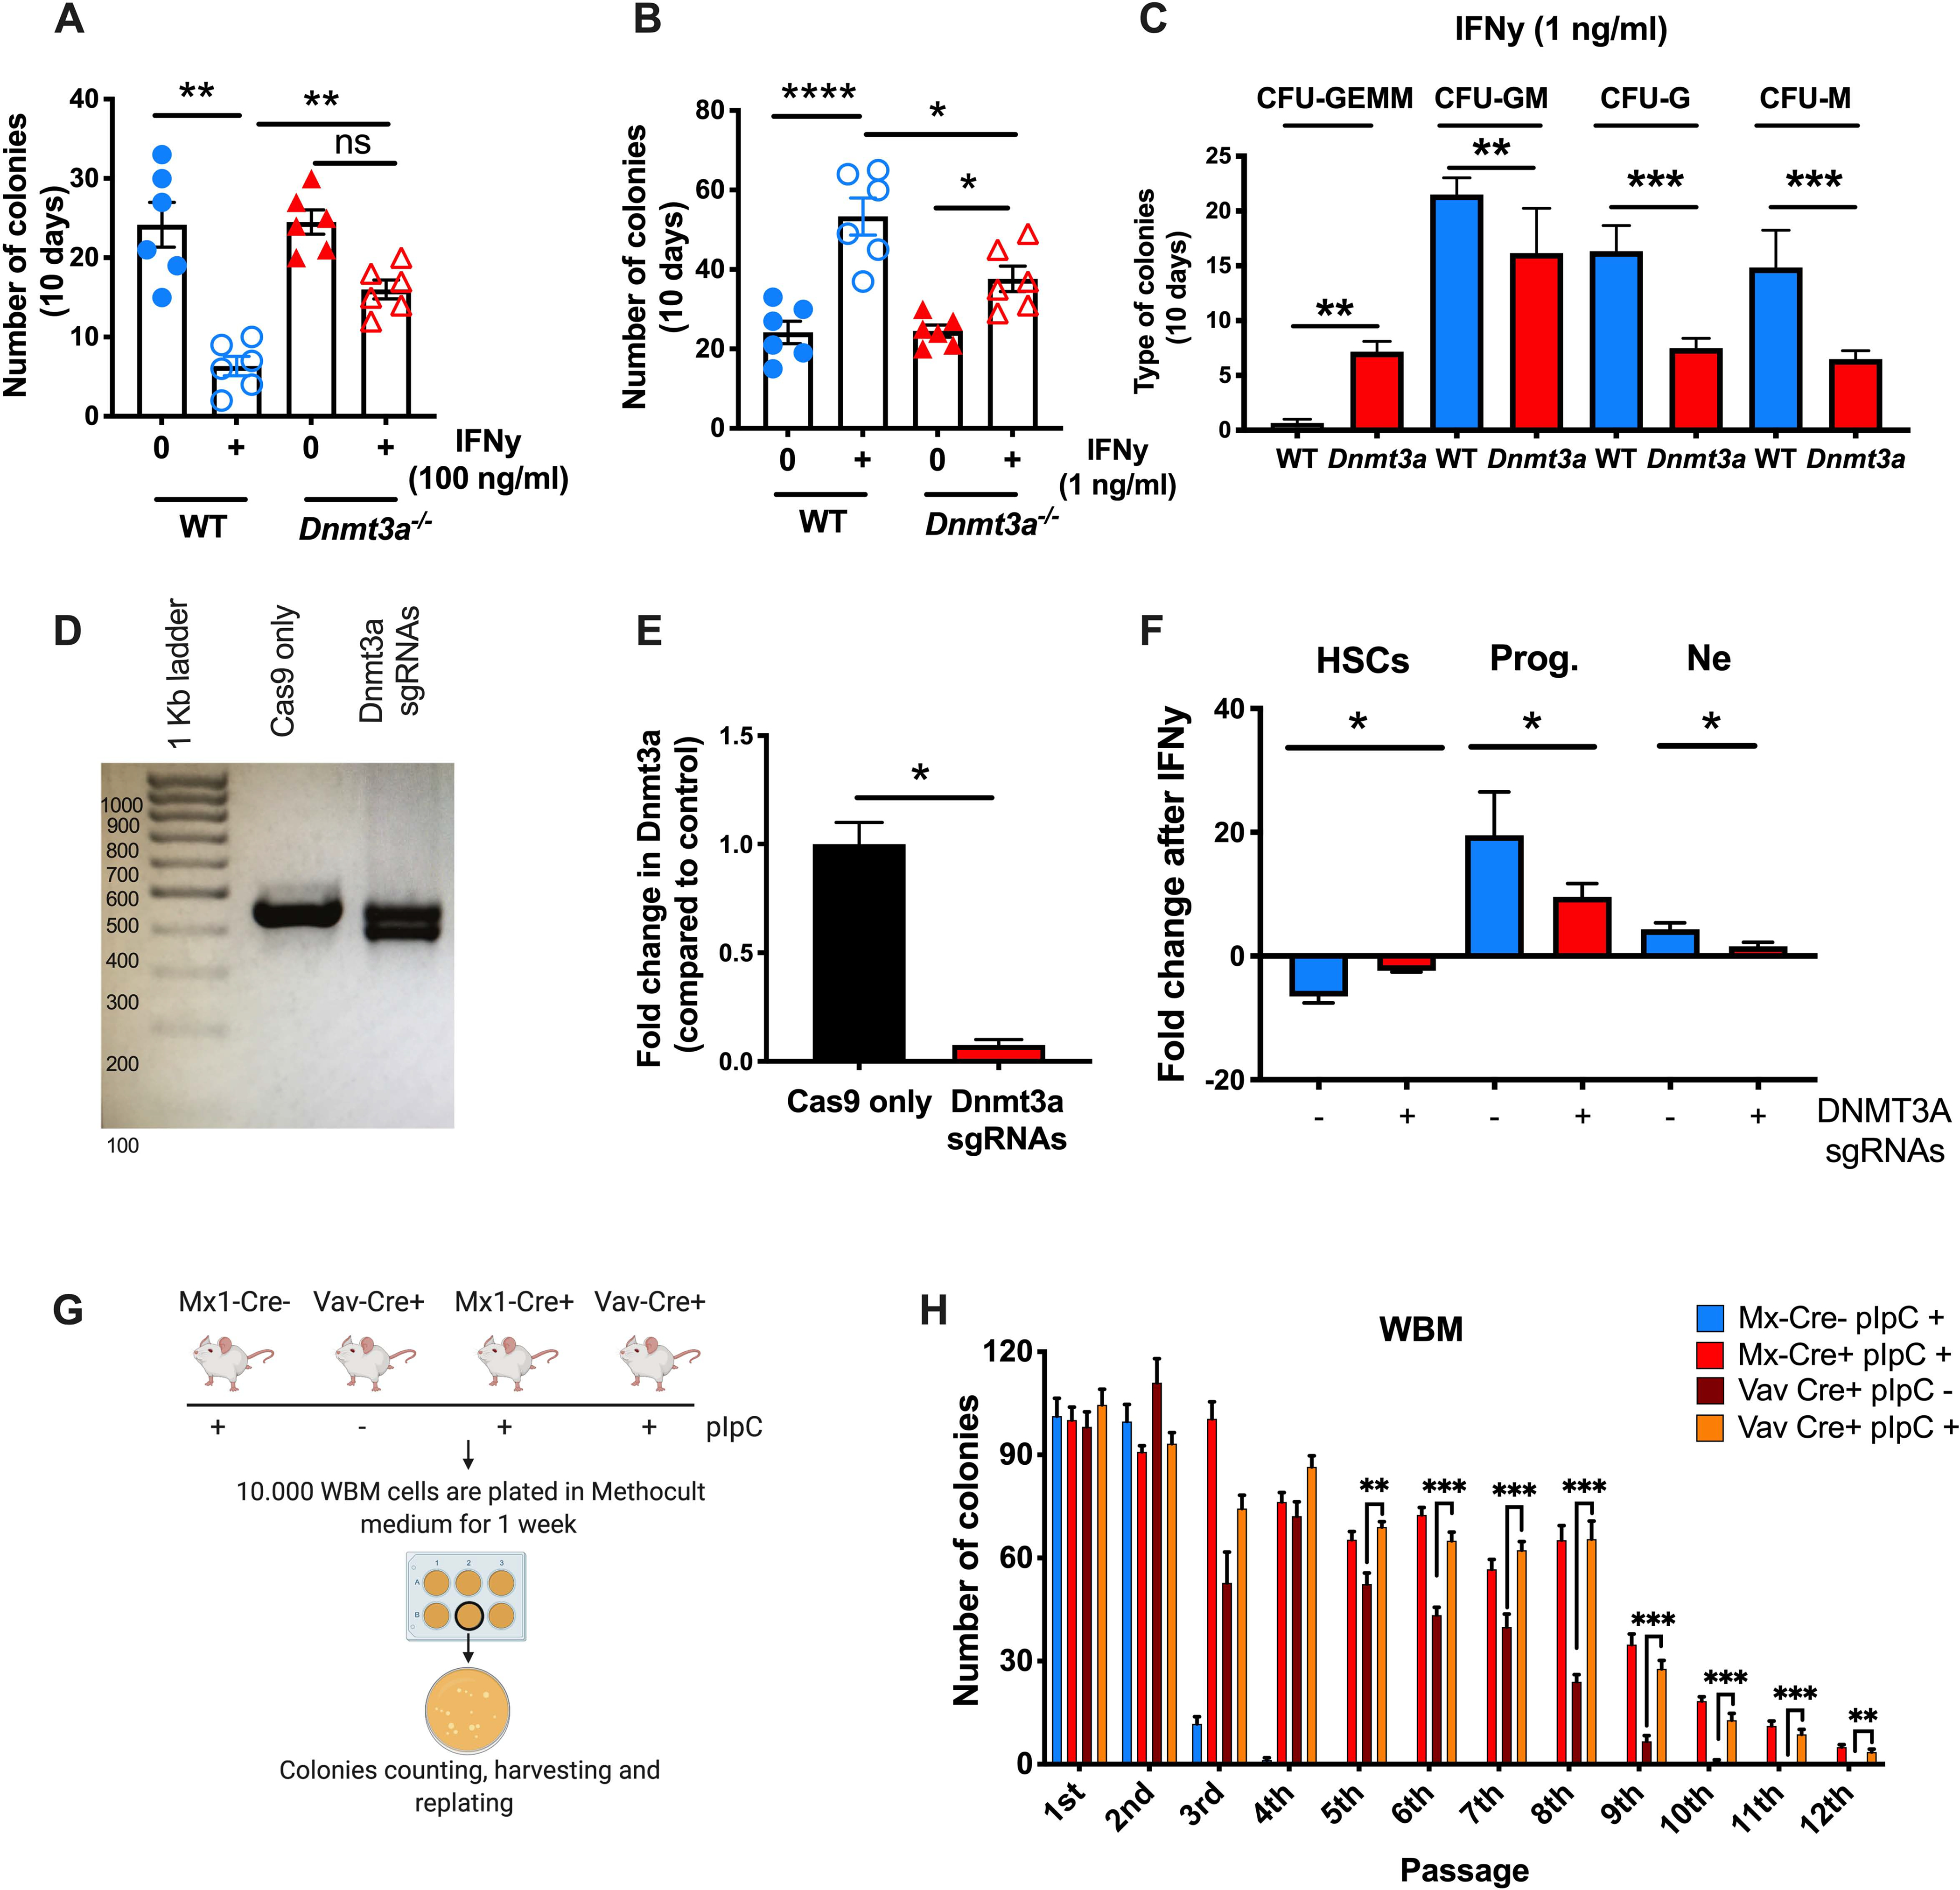
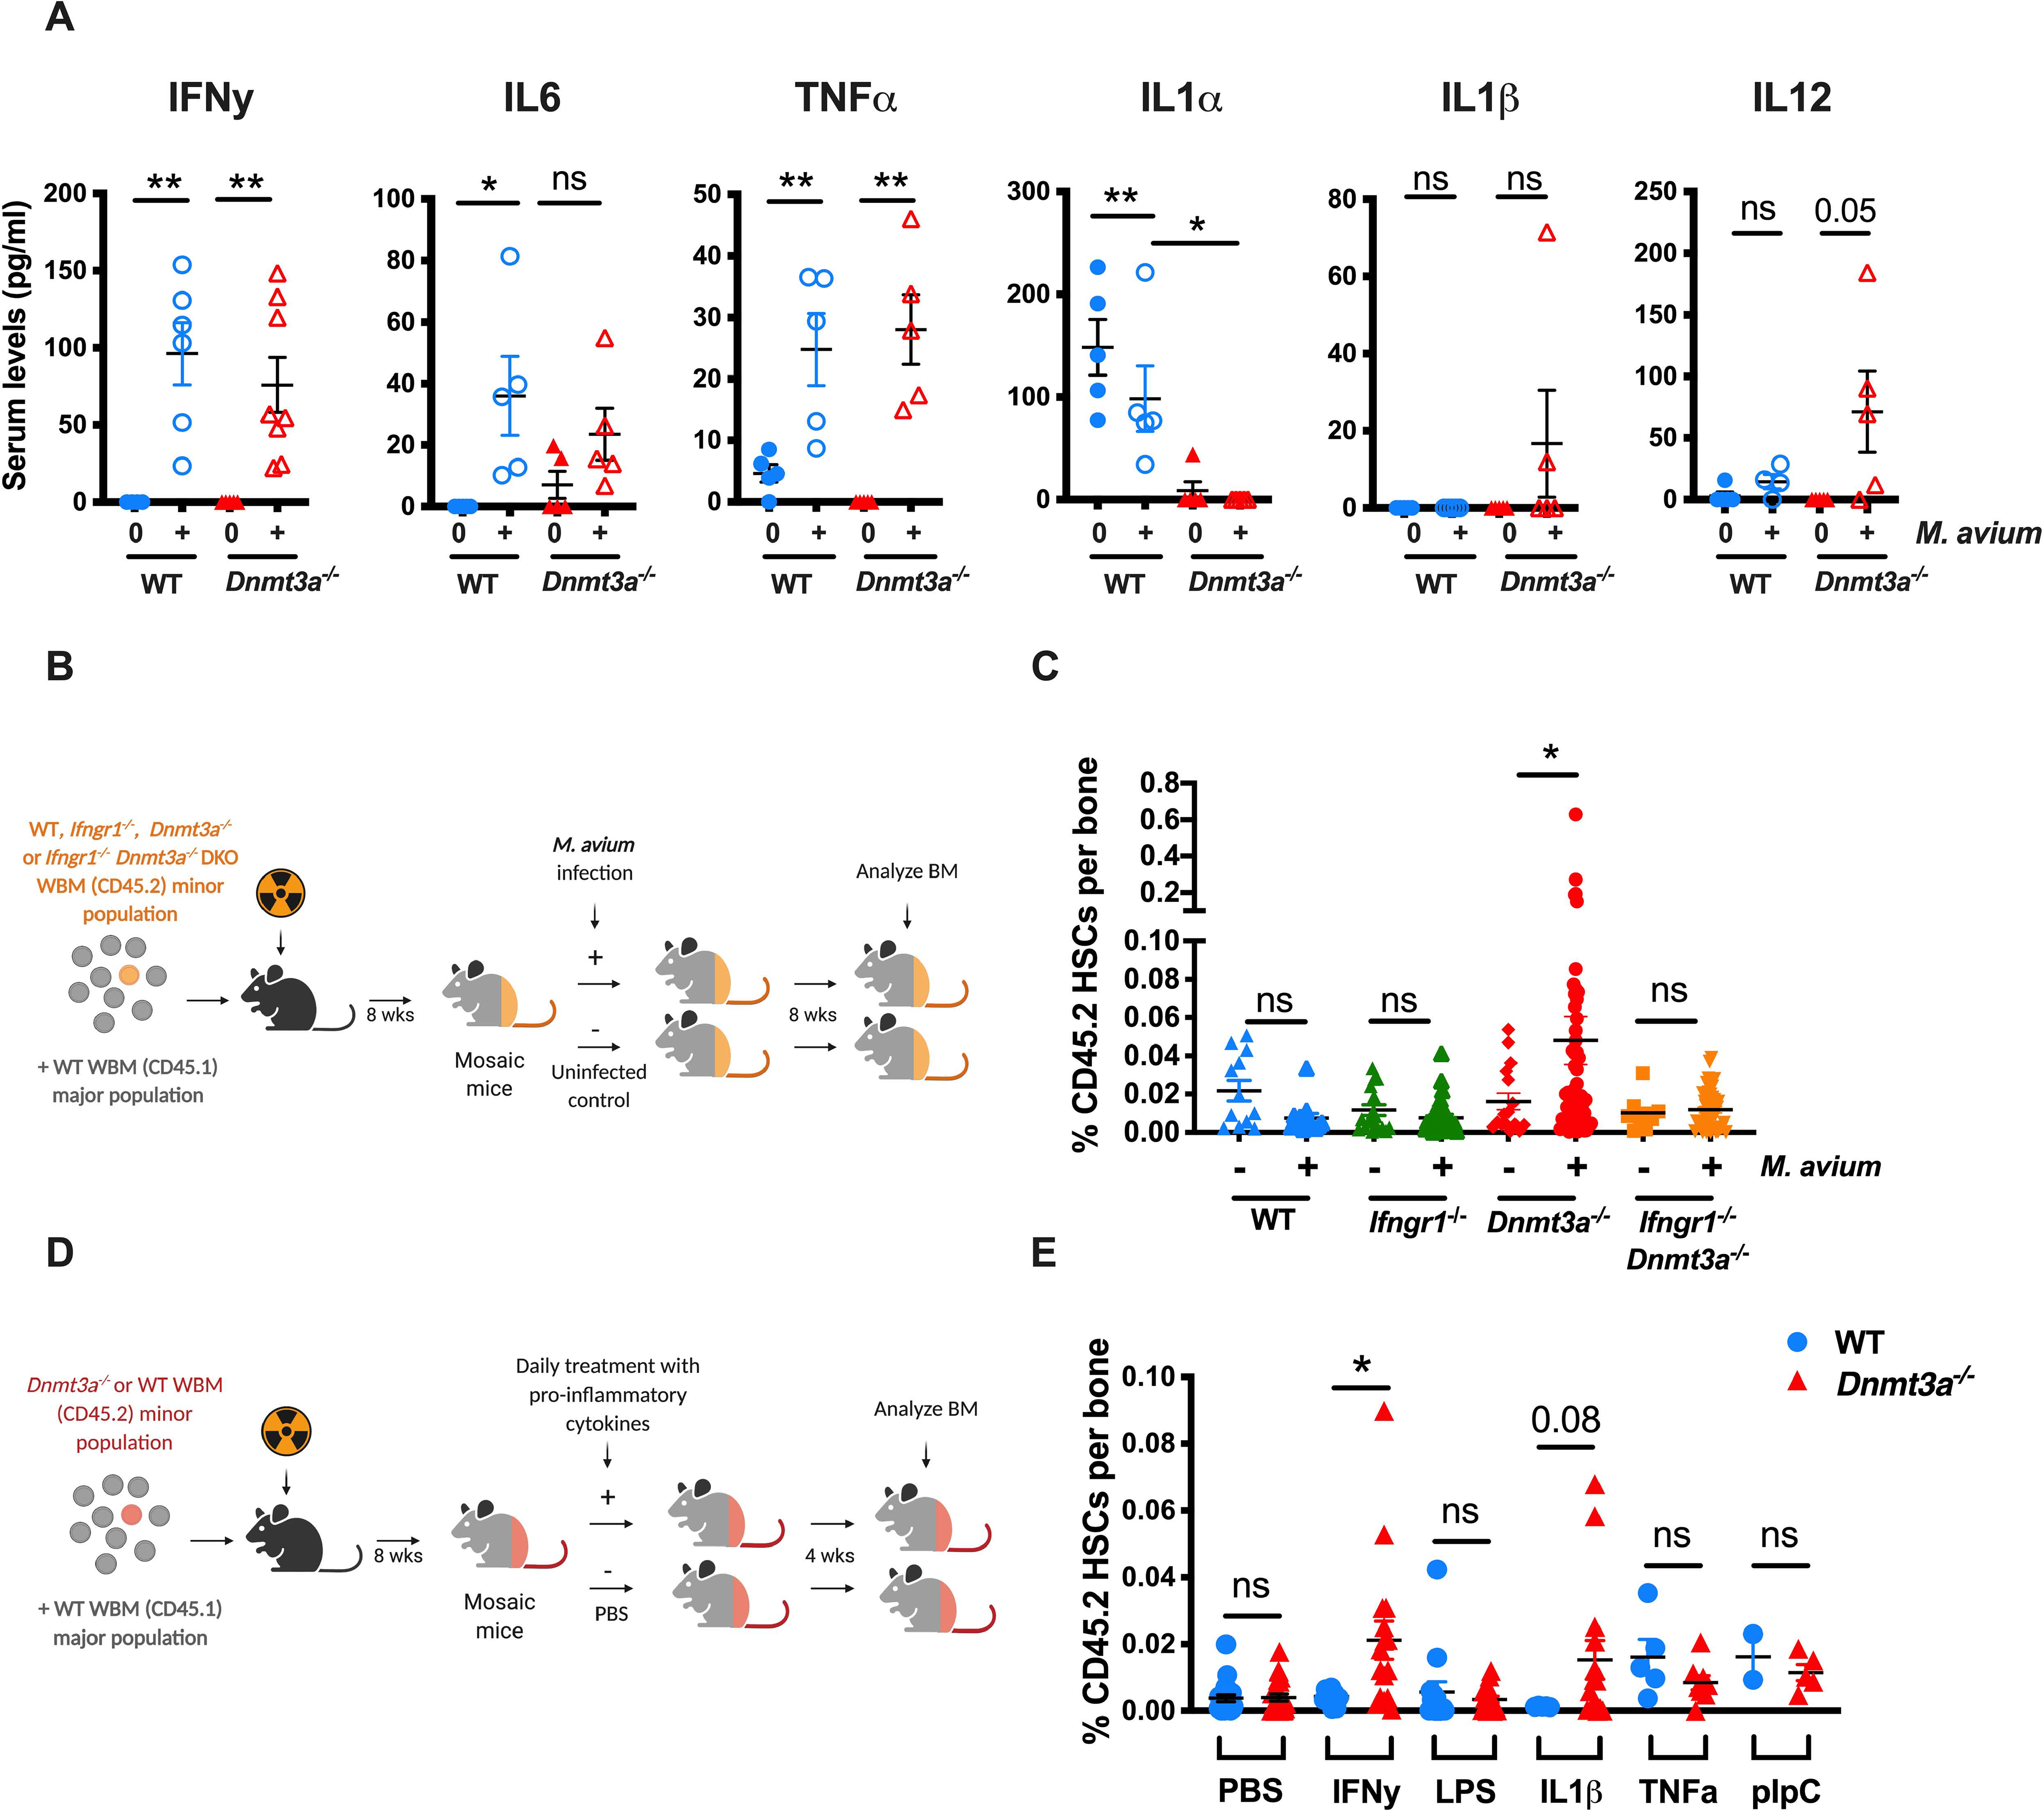
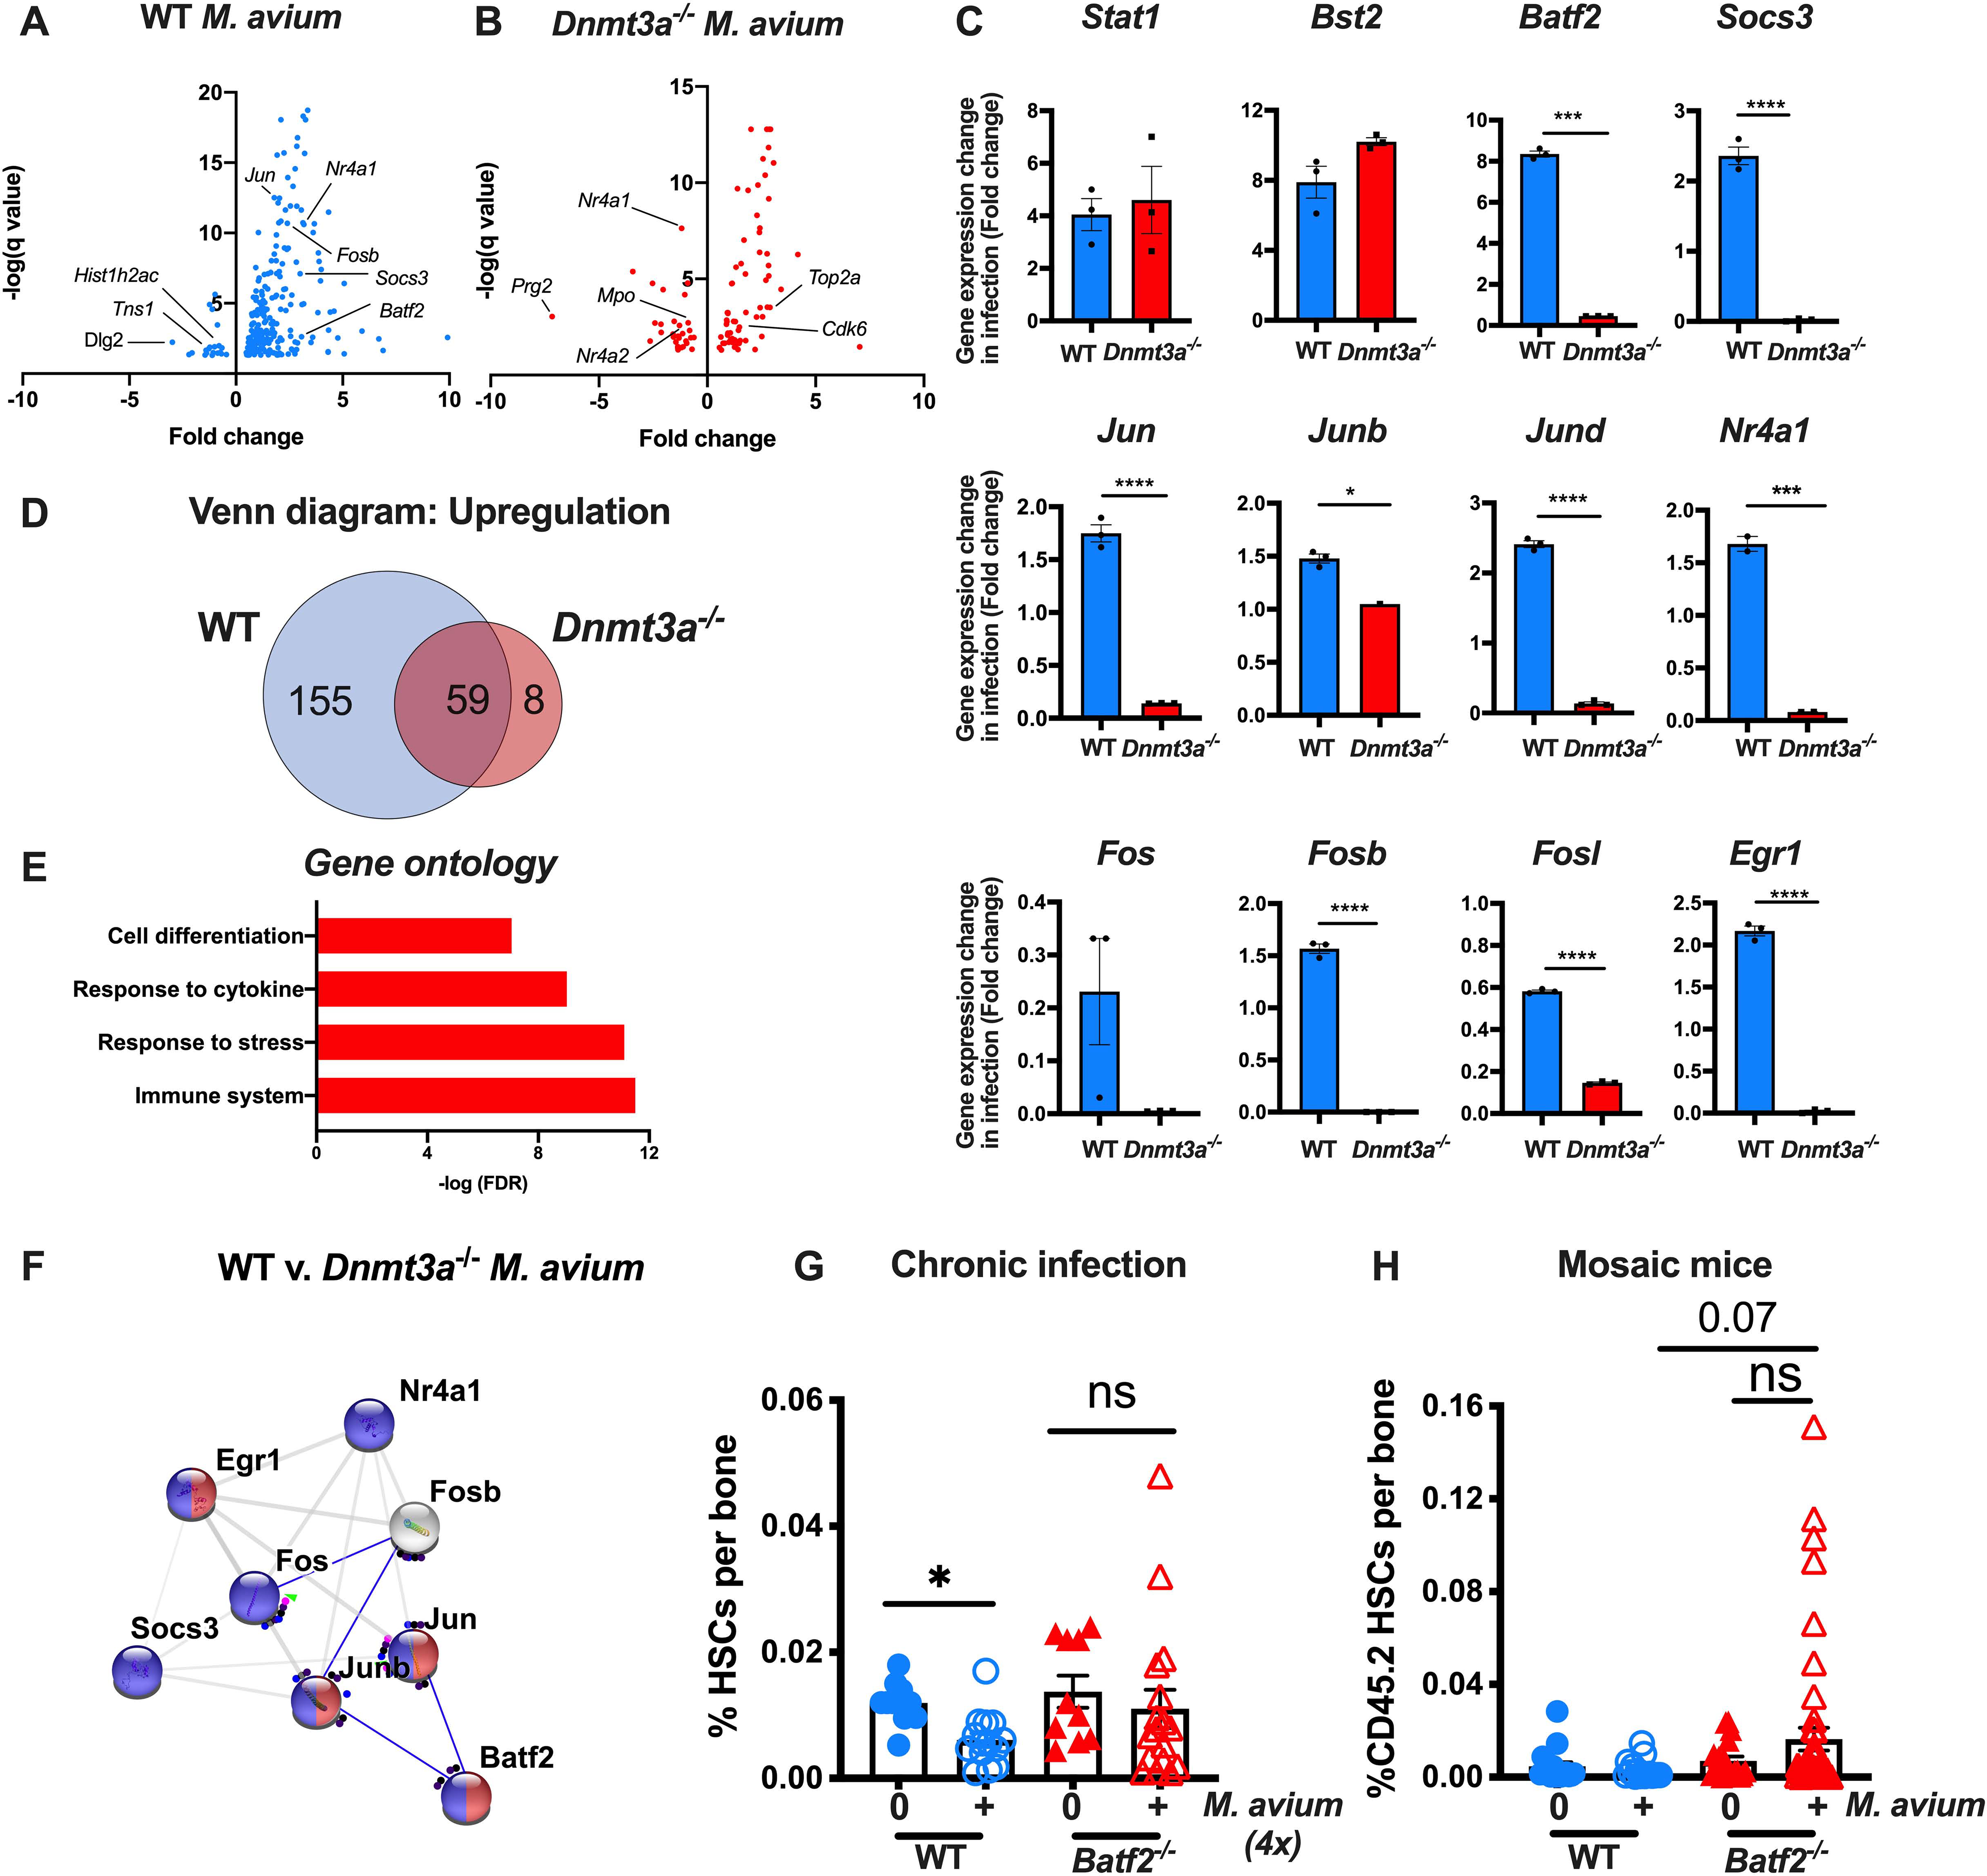
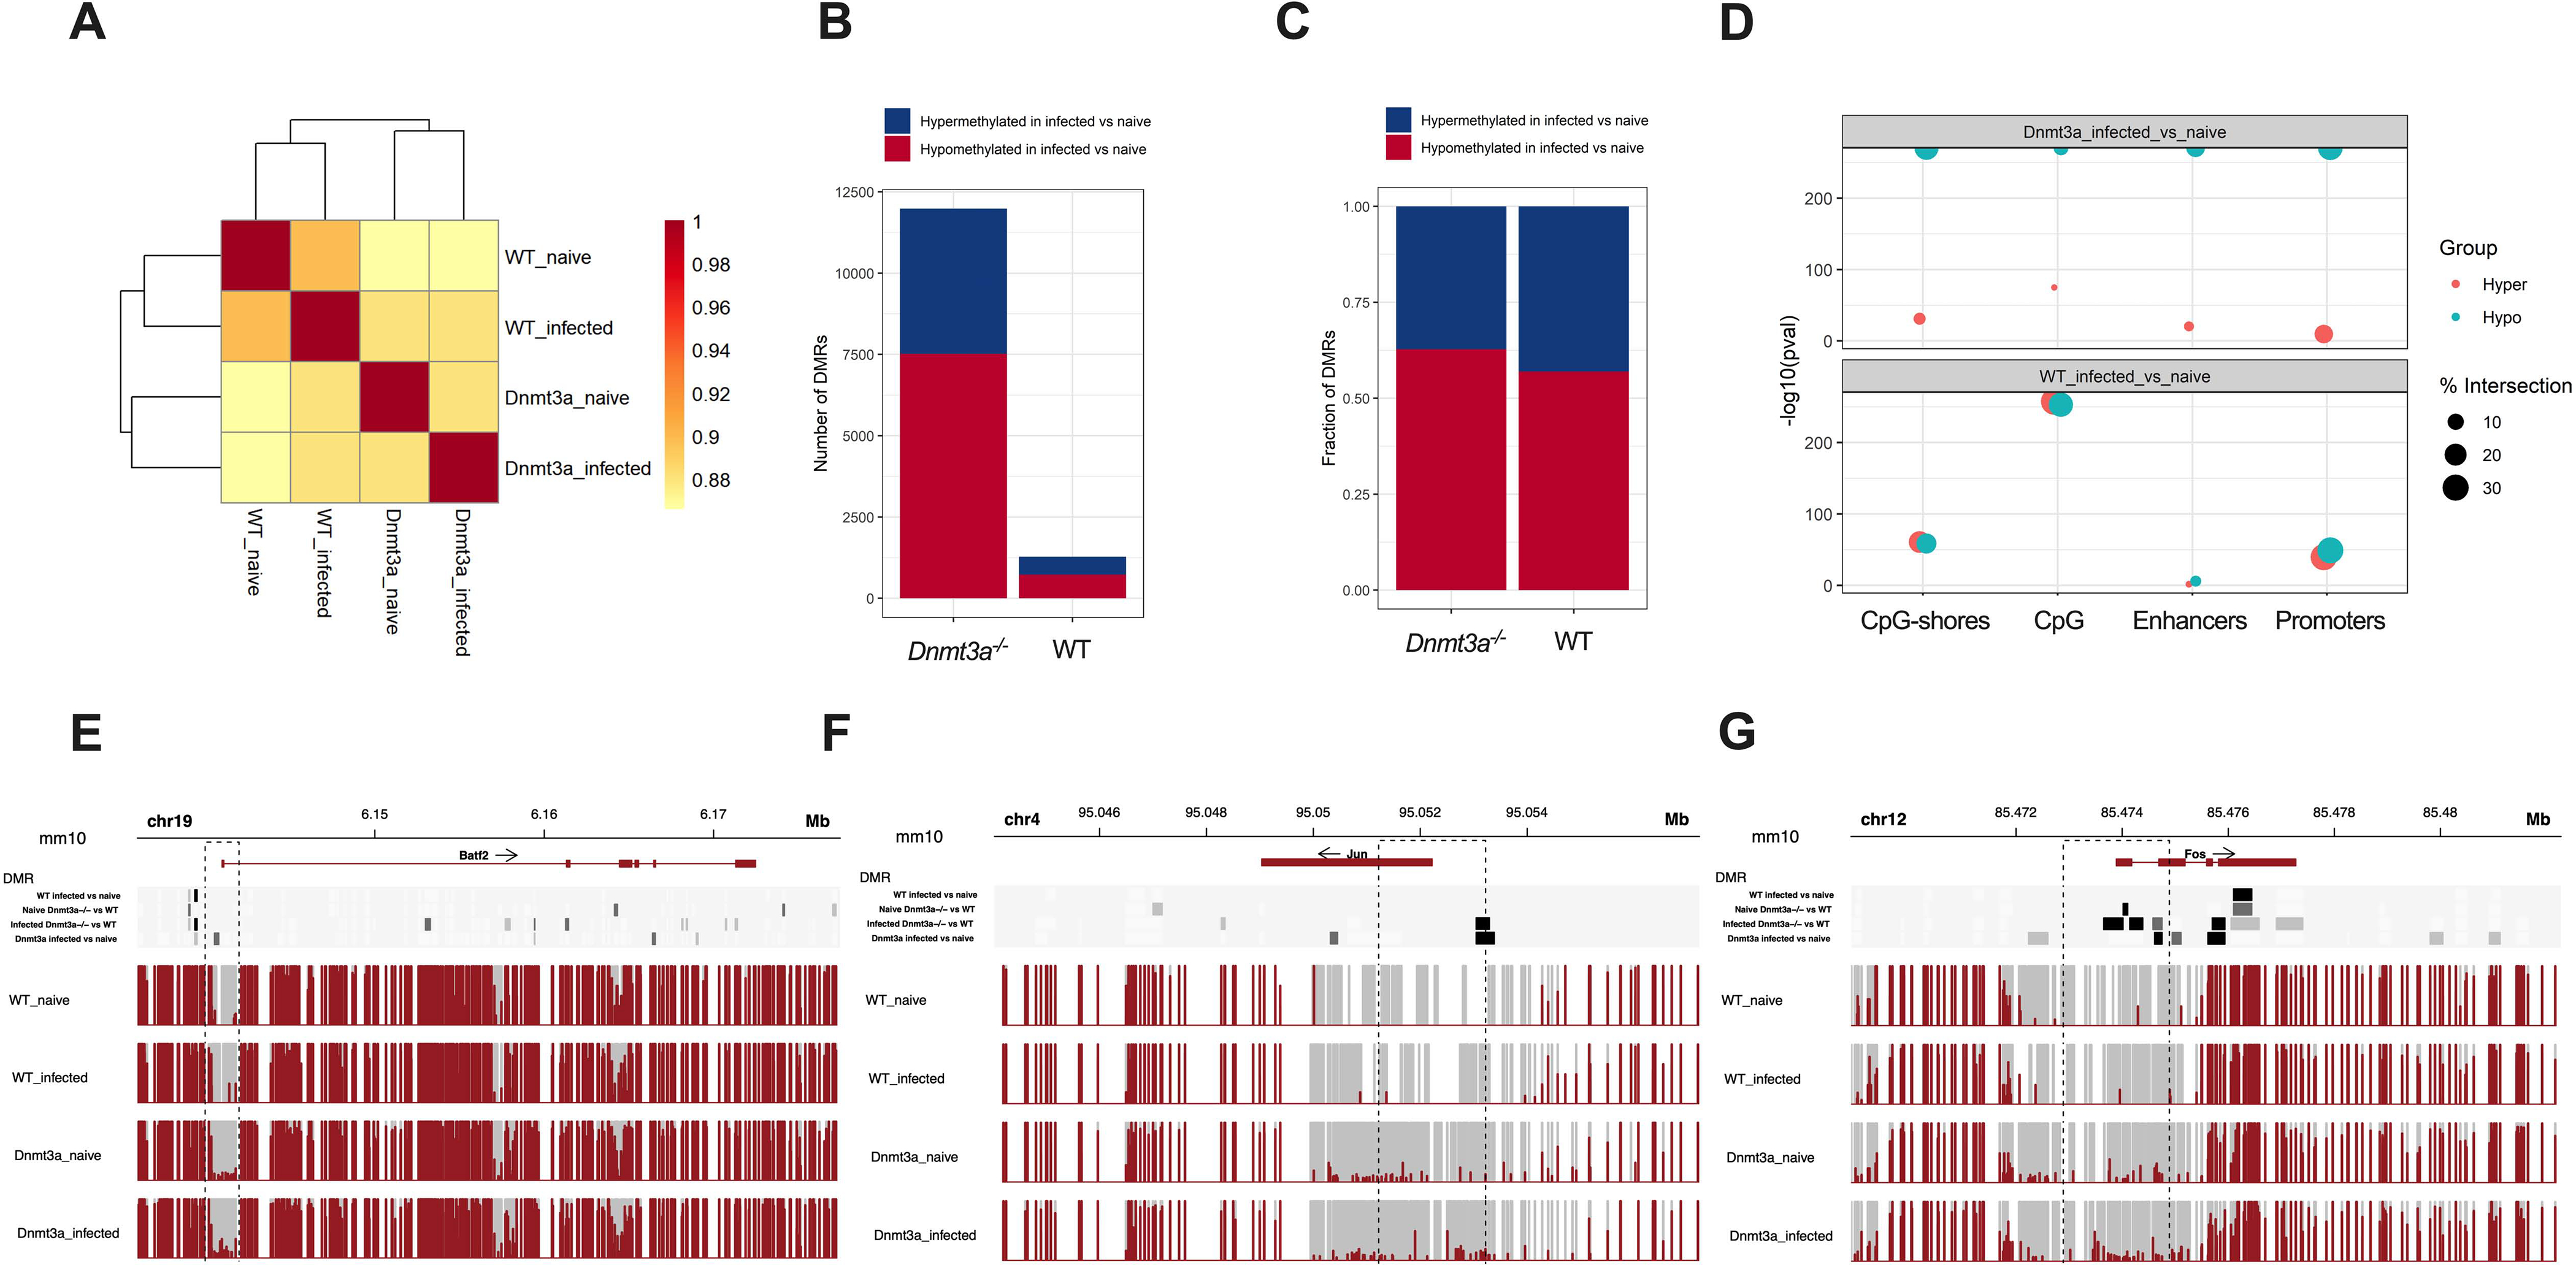
Age-related clonal hematopoiesis (CH) is a risk factor for malignancy, cardiovascular disease, and all-cause mortality. Somatic mutations in DNMT3A are drivers of CH, but decades may elapse between the acquisition of a mutation and CH, suggesting that environmental factors contribute to clonal expansion. We tested whether infection provides selective pressure favoring the expansion of Dnmt3a mutant hematopoietic stem cells (HSCs) in mouse chimeras. We created Dnmt3a-mosaic mice by transplanting Dnmt3a-/- and WT HSCs into WT mice and observed the substantial expansion of Dnmt3a-/- HSCs during chronic mycobacterial infection. Injection of recombinant IFNγ alone was sufficient to phenocopy CH by Dnmt3a-/- HSCs upon infection. Transcriptional and epigenetic profiling and functional studies indicate reduced differentiation associated with widespread methylation alterations, and reduced secondary stress-induced apoptosis accounts for Dnmt3a-/- clonal expansion during infection. DNMT3A mutant human HSCs similarly exhibit defective IFNγ-induced differentiation. We thus demonstrate that IFNγ signaling induced during chronic infection can drive DNMT3A-loss-of-function CH.

Keywords: CH; DNMT3A; bone marrow; clonal competition; clonal hematopoiesis; epigenetic regulation; hematopoietic stem cell; infection; interferon gamma; mycobacterial infection.


Conflict of interest statement

Declaration of interests The authors declare no competing interests.

Figures

Figure 1.
Figure 1.. M. avium infection promotes Dnmt3a-mutant clonal expansion in mice.
(A) Mosaic mouse model to compare Dnmt3afl/fl vs Dnmt3a−/− HSCs upon infection. WT recipient mice were transplanted with a minor population of “test” Dnmt3afl/fl or Dnmt3a−/− whole bone marrow and a major population of WT competitor. Two months after transplant, half of the mice were infected with M. avium, and the percent of test (Dnmt3a−/− or WT) CD45.2 HSCs measured eight weeks later. (B) CD45.2 HSCs (KL CD150+ CD48− CD34−) shown as a percentage of WBM in mosaic mice. Dnmt3a−/− cells were from Mx1-Cre Dnmt3afl/fl donors treated with PIPC 4 weeks before transplant. Data represent 4 independent experiments with n=20–40 per group. Median with 95% CI. P values calculated by Kruskal-Wallis test. (C) Genotyping of single-cell derived CD45.2+ colonies from bone marrow of mosaic mice at the end of the experiment; n=12–20 per group. (D) CD45.2 HSCs (KL CD150+ CD48− CD34−) shown as percentage of WBM in mosaic mice. Here, Dnmt3a−/− cells were from Vav-Cre Dnmt3afl/fl donors. n=5–20 per group. Median with 95% CI. P values calculated by Kruskal-Wallis test. (E) CD45.2 MPPs as percentage of total WBM in mosaic mice (corresponding to Figure 1D). (F). Mosaic mouse model to compare WT vs Dnmt3a+/− HSCs upon 2-month of infection with M. avium. (G). CD45.2 HSCs (KL CD150+ CD48− CD34−) shown as a percentage of WBM in mosaic mice model to compare Dnmt3afl/fl vs Dnmt3a+/− HSCs upon infection. Median with 95% CI. P values calculated by Kruskal-Wallis test. *, p < 0.05; **, p < 0.01; ***, p < 0.001.
Figure 2.
Figure 2.. M. avium infection promotes late Dnmt3a-mutant clonal peripheral blood expansion.
(A) WT recipient mice were transplanted with a minor population of “test” Dnmt3afl/fl or Dnmt3a−/− CD45.2 WBM and a major population of CD45.1 WT competitor. Two months after transplant, half of the mice were infected with M. avium, and the percent of CD45.2 PB leucocytes was measured eight and twelve months later likewise the percent of test CD45.2 HSCs in the BM after twelve months of infection. (B) Paired analysis of CD45.2 population of individual mice at engraftment and after 8-months of treatment with PBS (naïve). (C) Paired analysis of percentage CD45.2 population of individual mice at engraftment and after 8-months of infection with M. avium. (D) Fold change from starting engraftment of CD45.2 population in naïve and M. avium infected mice after 8-months of PBS treatment or infection. (E) Paired analysis of CD45.2 population of individual mice at engraftment and after 12-months of treatment with PBS (naïve). (F) Paired analysis of percentage CD45.2 population of individual mice at engraftment and after 12-months of infection with M. avium. (G) Fold change from starting engraftment of CD45.2 population in naïve and M. avium infected mice after 12-months of PBS treatment or infection. CD45.2 HSCs (KL CD150+ CD48− CD34−) shown as a percentage of WBM (H) or total HSCs (I) in mosaic mice after 12-month of infection. (I) Paired analysis were performed by Paired t-test (Figures 2B-C and 2E-F). Statistical analysis of Figures 2G and 2H-I were performed by using Mann-Whitney test. *, p < 0.05; **, p < 0.01; ***, p < 0.001.
Figure 3:
Figure 3:. Hematological responses of Dnmt3a−/− mice to infection with M. avium.
(A-C) WT and Dnmt3a−/− mice were infected with M. avium for 1 month. (A) Percentage of HSCs (KL CD150+ CD48− CD34−) of total WBM. n=10–20 per group; data are representative of 5 independent experiments. Error bars, mean ± SEM. P values calculated by ordinary one-way ANOVA. (B) Percentage of Annexin + HSCs. n=6–10 per group; data are representative of two independent experiments. Error bars, mean ± SEM. P values calculated by ordinary one-way ANOVA. (C) Percentage of Ki67+ HSCs. n=10–15 per group; data are representative of two independent experiments. Error bars, mean ± SEM. P values calculated by ordinary one-way ANOVA. (D) Hematocrit in WT and Dnmt3a−/− mice infected with M. avium for 1 month. n=10–20 per group. Error bars, mean ± SEM. P values calculated by ordinary one-way ANOVA. (E) 400 HSCs (KSL CD150+ CD48− CD34−) were sorted, treated for 12h with IFN-y in vitro prior to Caspase 3/7 assay. n=2–3 per group. Error bars, mean ± SEM. P values calculated by ordinary one-way ANOVA. (F) WT and Dnmt3a−/− mice were infected with M. avium for 3 consecutive months before we analyzed the absolute number of HSCs (KL CD150+ CD48− CD34−) of total WBM. (G) Mouse model of secondary transplant from primary mosaic mice (Figure 1A). 250 sorted donor CD45.2 HSCs (LK CD150+ CD48− CD34−) from previously transplanted animals were co-transplanted with 2.5 × 10⁵ CD45.1 rescue marrow into lethally irradiated mice. PB was assessed 12 weeks post-transplant, and engraftment is shown as percentage of CD45.2 cells in blood (H). Data are presented as mean ± SEM; n = 7–14 per group. P values calculated Kruskal-Wallis test. *, p < 0.05; **, p < 0.01; ***, p < 0.001.
Figure 4:
Figure 4:. Dnmt3a-mutant HSCs show defective differentiation and increased self-renewal in response to inflammatory insults.
(A-C) 80 LT-HSCs (LSK CD150+ CD48-) from the pool of 3 Dnmt3afl/fl and 3 Dnmt3a−/− mice were sorted and cultured in 2 ml of complete Methocult medium with the presence of absence of rm-IFNy. Two different doses of rm-IFNy were used: 100 ng/ml (Figure 4A) or 1 ng/ml (Figure 4B-C). After 10d of culture, colonies were counted and scored. (A) Number of colonies after 10d of culture with 100 ng/ml of rm-IFNy. Data are representative of 2 independent experiments. Error bars, mean ± SEM. P values calculated by ordinary one-way ANOVA. (B) Number of colonies after 10d of culture with 1 ng/ml of rm-IFNy. Data are representative of 2 independent experiments. Error bars, mean ± SEM. P values calculated by ordinary one-way ANOVA. (C) Morphology of colonies after 10d of culture with 1 ng/ml of rm-IFNy. Data are representative of 2 independent experiments. Error bars, mean ± SEM. P values calculated by Mann Whitney test. (D) Representative gel of Dnmt3a exon 13 region. Expected size of band from WT allele is 450 bp. (E) hDnmt3a RNA expression. P values calculated by two-sided t-test. Error bars, mean ± SEM. Data are representative of two independent experiments performed in triplicate. (F) Differentiation assay in human CD34+ cells treated for 72h with rhIFN-y. Fold change is relative to time 0. Error bars, mean ± SEM. P values calculated by two-sided t-test. Data are representative of three independent experiments. (D-E) Serial replating assay to compare the self-renew capacity of WBM cells from Mx1-Cre and Vav-Cre+ mice with/without pIpC treatment. Data are representative of two independent experiments. Error bars, mean ± SEM. P values calculated by two-way ANOVA. *, p < 0.05; **, p < 0.01; ***, p < 0.001.
Figure 5.
Figure 5.. IFN-y signaling is necessary for Dnmt3a-mutant clonal expansion in M. avium infection.
(A) Serum cytokine levels of IFNy, IL6, TNFa, IL1a, IL1b and IL12 in WT and Dnmt3a−/− (Mx1-Cre) mice that were naïve or infected for one month with M. avium. n=5 per group. P values calculated by ordinary one-way ANOVA or Kruskal-Wallis test. (B) Mosaic mouse model to compare Ifngr1−/− Dnmt3a−/− double KO (DKO) vs Dnmt3a−/− HSCs upon infection. WT recipient mice were transplanted with a minor population of “test” WT, Ifngr1−/−, Dnmt3a−/− or Ifngr1−/− Dnmt3a−/− DKO WBM and a major population of WT competitor. Two months after transplant, half of the mice were infected with M. avium, and the percent of test CD45.2 HSCs measured eight weeks later. (C) Percentage of CD45.2 HSCs of WBM in mosaic mice. Data are representative of two independent experiments; n=10–20 per group. Error bars, mean ± SEM. P values calculated by Kruskal-Wallis test. (D) Mosaic mouse model to compare Dnmt3afl/fl vs Dnmt3a−/− HSCs upon daily treatment with pro-inflammatory cytokines for 1-month. (E) Mosaic mice were injected daily with IFNy, LPS, IL1b, TNFa or pIpC for one month prior to determination of percentage of CD45.2 HSCs in WBM. Error bars, mean ± SEM. P values calculated by two-sided t-test. *, p < 0.05; **, p < 0.01; ***, p < 0.001.
Figure 6.
Figure 6.. Responses to infection are blunted in Dnmt3a-mutant HSCs.
(A) RNA-seq volcano plot showing genes with a significant change (q value<0.05) between HSCs from infected and naïve WT mice. (B) RNA-seq volcano plot showing genes with a significant change (q value<0.05) between HSCs from infected and naïve Dnmt3a−/− mice. (C) qPCR validation of genes from RNA seq data. n=3 per group. P values calculated by two-sided t-test. (D) Venn diagram with number of genes upregulated during infection in WT only (blue), Dnmt3a−/− only (light red), or both (dark red). (E) Gene ontology pathways enriched among genes upregulated in HSCs from WT but not Dnmt3a−/− mice during infection. (F) String interactions of validated genes with altered expression during infection in WT but not Dnmt3a−/− HSCs shows a network of transcription factors, including Batf2. (G) Percentage of HSCs (LK CD150+ CD48− CD34−) of total WBM in WT and Batf2−/− mice infected with M. avium for 4 months. Data are representative of two experiments, each with n=5–10 per group. Error bars, mean ± SEM. P values calculated by Kruskal-Wallis test. (H) CD45.2 HSCs (KL CD150+ CD48− CD34−) shown as a percentage of WBM in mosaic mice after two-month infection with M. avium. Error bars, mean ± SEM. P values calculated by Kruskal-Wallis test. *p < 0.05, **p < 0.01, ***p < 0.001.
Figure 7.
Figure 7.. Profound changes in the methylation landscape of Dnmt3a−/− HSCs in infection.
(A) Hierarchical clustering based on CpG methylation correlation in WT and Dnmt3a−/− HSCs naïve and after 1-month of M. avium infection (B) Number of hyper- or hypo-methylated DMRs in WT and Dnmt3a−/− HSCs naïve and after 1-month of M. avium infection. (C) Fraction of hyper- or hypo-methylated DMRs in WT and Dnmt3a−/− HSCs naïve and after 1-month of M. avium infection. (D) Enrichment analysis. Size of data points represents the overlap percentage with the size of the corresponding regulatory regions in the denominator. (E) DNA methylation profile of Batf2 in WT or Dnmt3a−/− HSCs naïve or after 1-month of infection. (F) DNA methylation profile of Jun in WT or Dnmt3a−/− HSCs naïve or after 1-month of infection. (G) DNA methylation profile of Fos in WT or Dnmt3a−/− HSCs naïve or after 1-month of infection. For Figures E-G, significance is shown at the top with light gray denoting p<0.05; medium gray denoting p<0.01, and black denoting p<0.001.

Comment in

References

    1. Abegunde SO, Buckstein R, Wells RA, and Rauh MJ (2018). An inflammatory environment containing TNFα favors Tet2-mutant clonal hematopoiesis. Experimental Hematology 59, 60–65. - PubMed
    1. Andrews S (2010). FastQC: a quality control tool for high throughput sequence data.
    1. Azrakhsh NA, Mensah-Glanowska P, Sand K, and Kittang AO (2019). Targeting Immune Signaling Pathways in Clonal Hematopoiesis. Current medicinal chemistry 26. - PubMed
    1. Baldridge MT, King KY, Boles NC, Weksberg DC, and Goodell MA (2010). Quiescent haematopoietic stem cells are activated by IFN-γ in response to chronic infection. Nature 465, 793–797. - PMC - PubMed
    1. Baldridge MT, King KY, and Goodell MA (2011). Inflammatory signals regulate hematopoietic stem cells. Trends in Immunology 32, 57–65. - PMC - PubMed

Publication types

Substances