. 2021 May 20;81(10):2148-2165.e9.
doi: 10.1016/j.molcel.2021.02.038. Epub 2021 Mar 19.

Targeting KDM4A epigenetically activates tumor-cell-intrinsic immunity by inducing DNA replication stress

Affiliations

Targeting KDM4A epigenetically activates tumor-cell-intrinsic immunity by inducing DNA replication stress

Wuchang Zhang et al. Mol Cell. .

Abstract

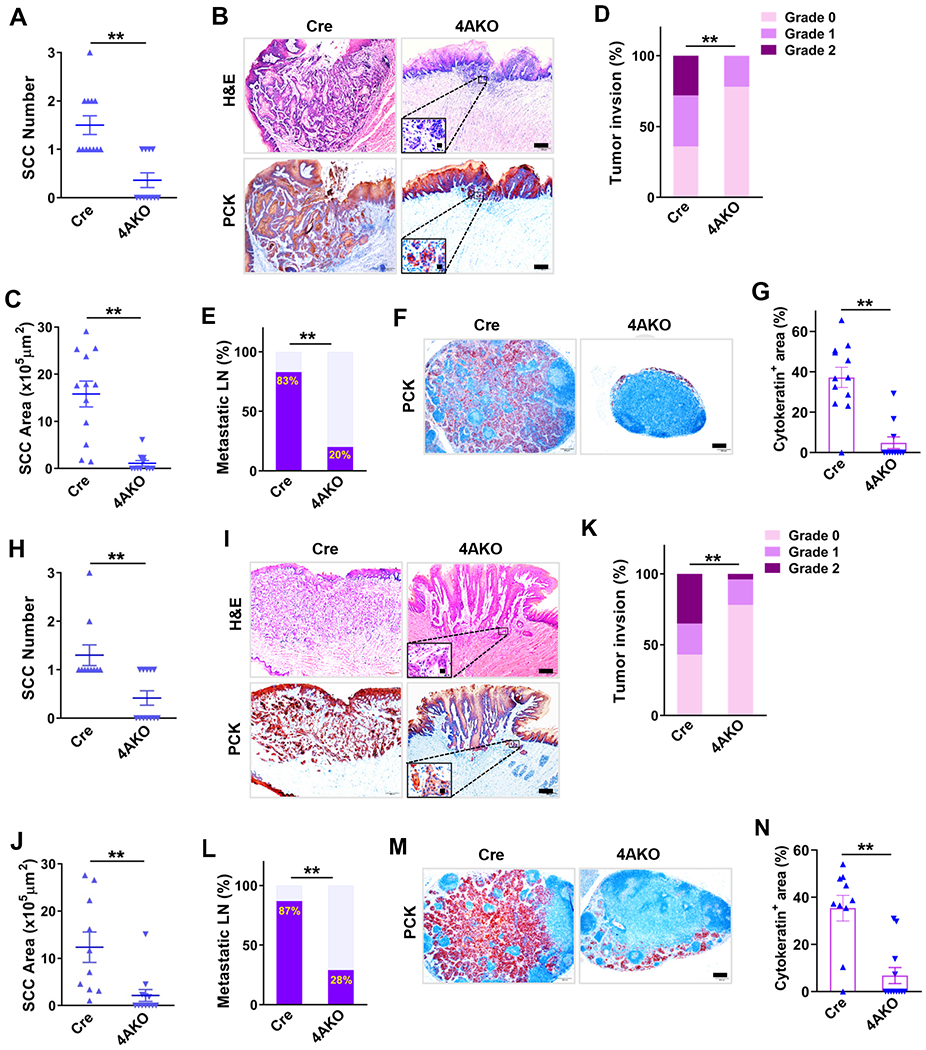
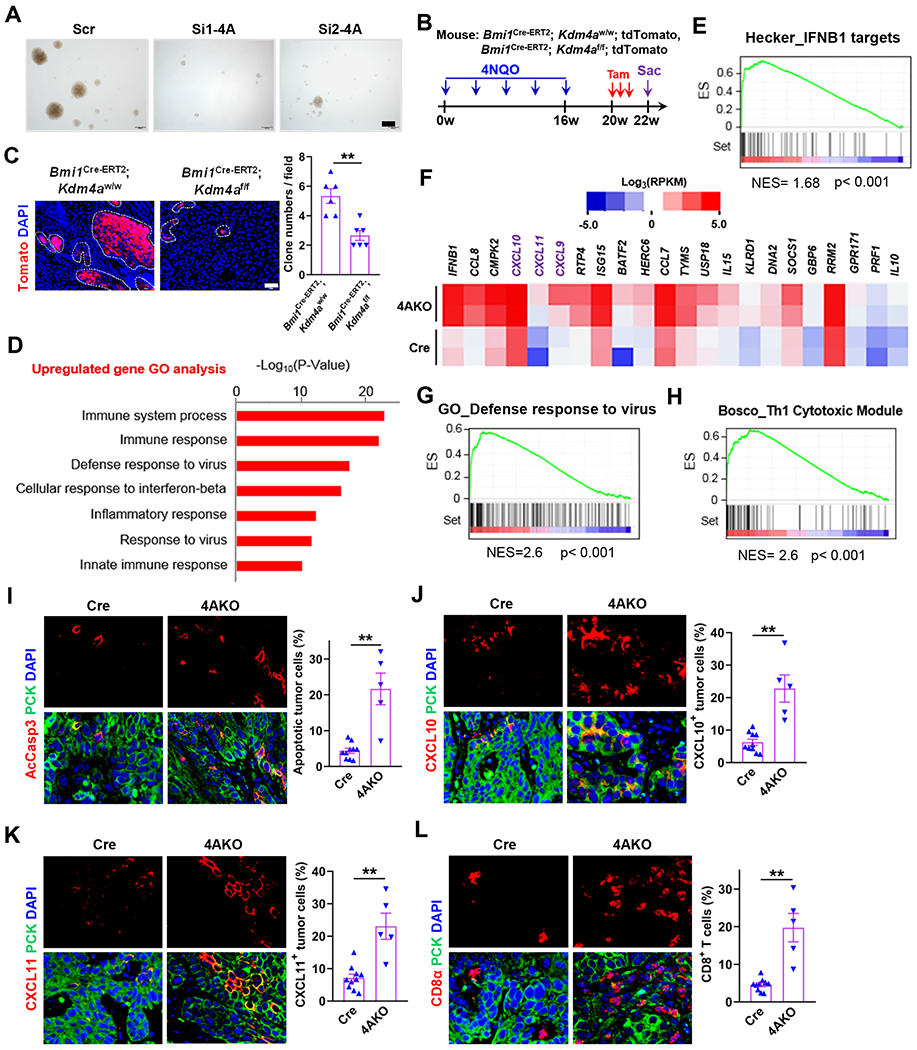
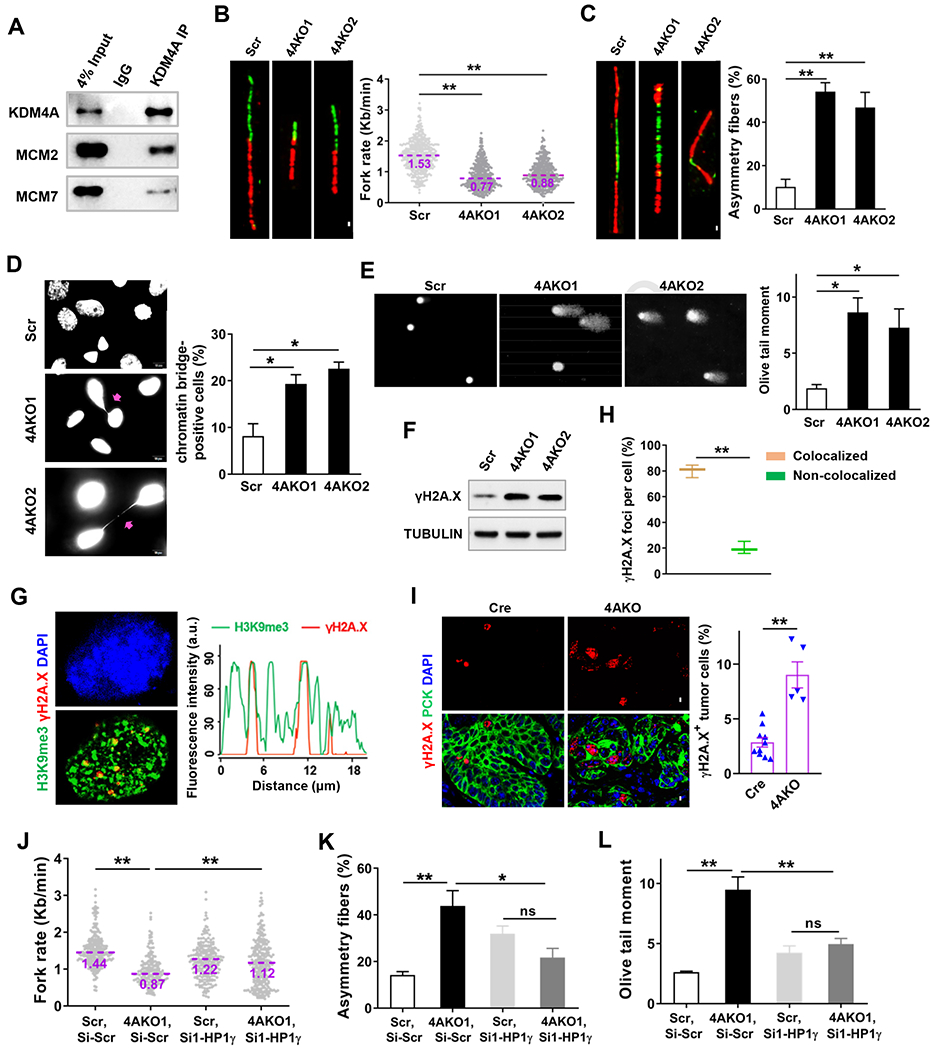
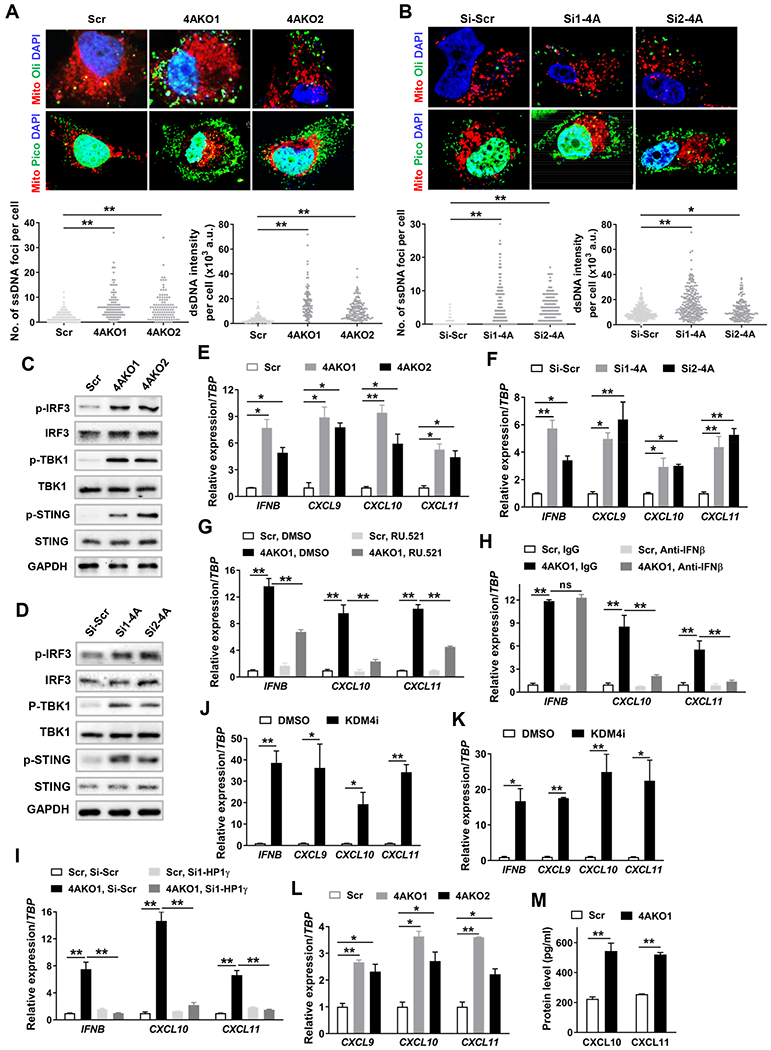
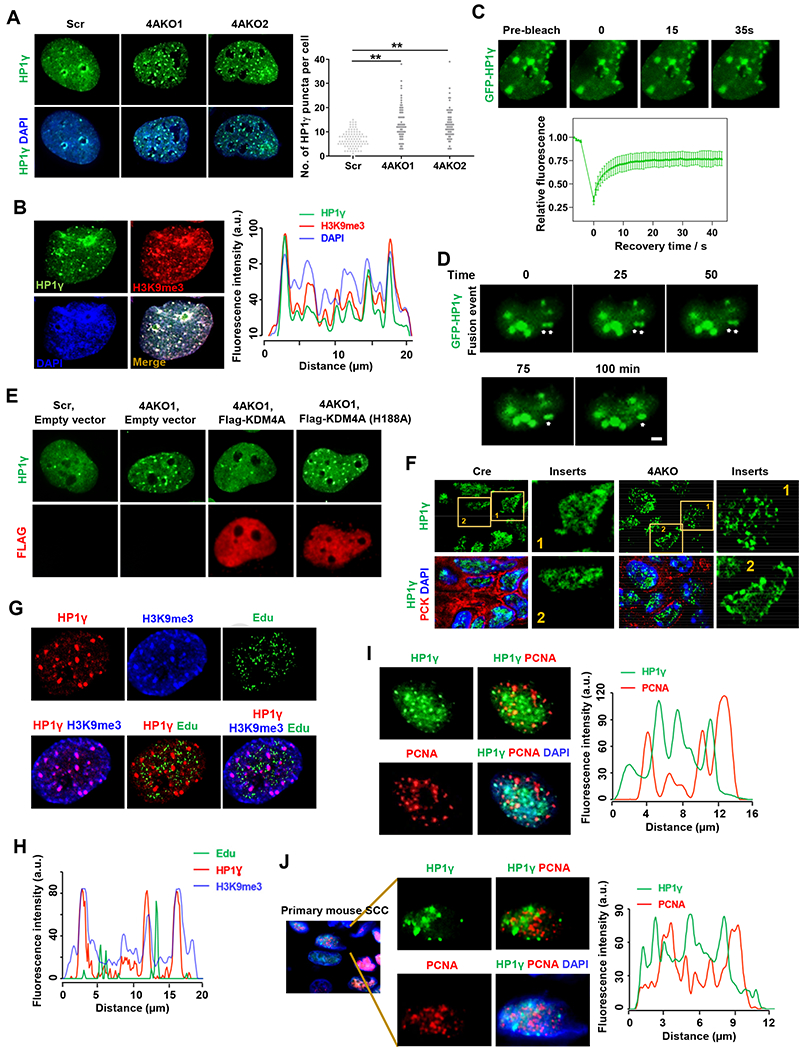
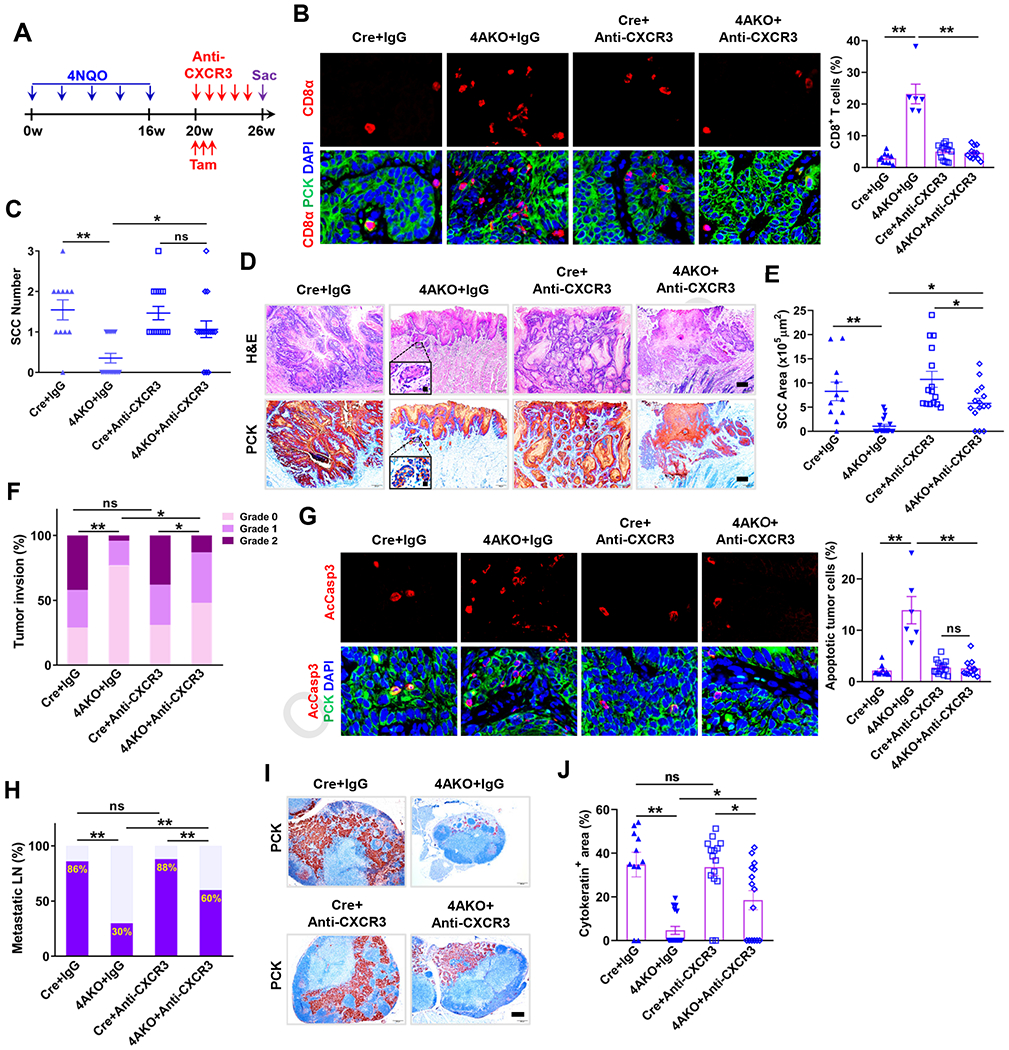
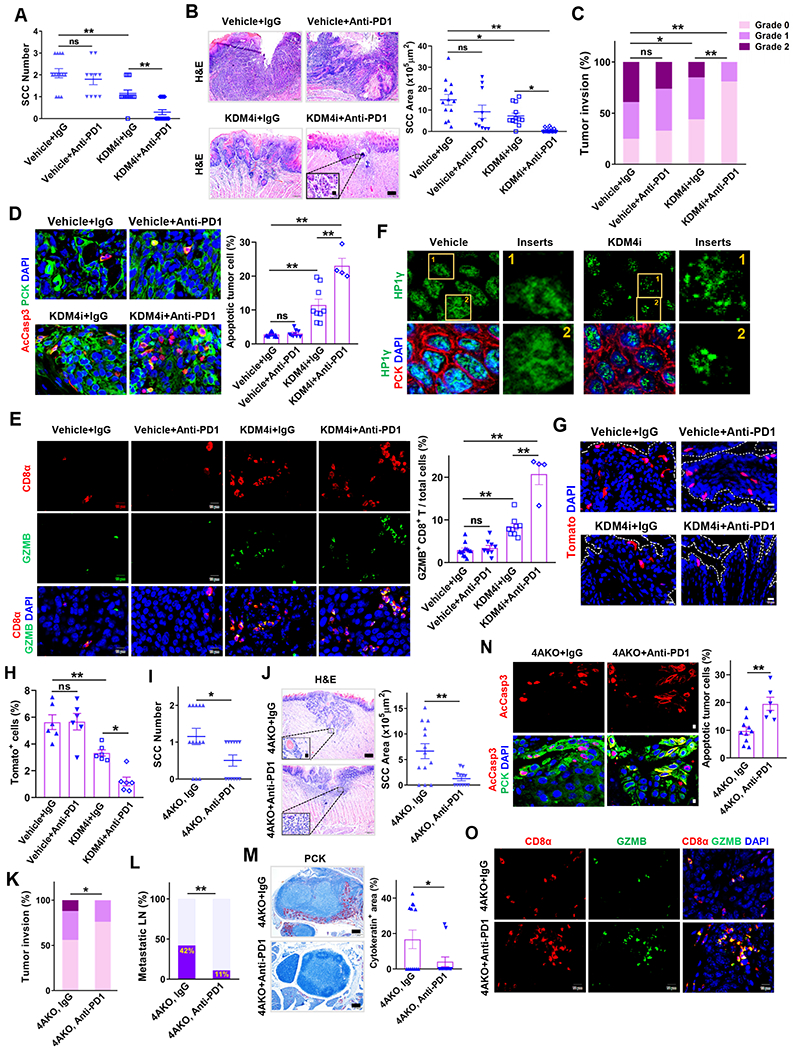
Developing strategies to activate tumor-cell-intrinsic immune response is critical for improving tumor immunotherapy by exploiting tumor vulnerability. KDM4A, as a histone H3 lysine 9 trimethylation (H3K9me3) demethylase, has been found to play a critical role in squamous cell carcinoma (SCC) growth and metastasis. Here we report that KDM4A inhibition promoted heterochromatin compaction and induced DNA replication stress, which elicited antitumor immunity in SCC. Mechanistically, KDM4A inhibition promoted the formation of liquid-like HP1γ puncta on heterochromatin and stall DNA replication, which activated tumor-cell-intrinsic cGAS-STING signaling through replication-stress-induced cytosolic DNA accumulation. Moreover, KDM4A inhibition collaborated with PD1 blockade to inhibit SCC growth and metastasis by recruiting and activating CD8+ T cells. In vivo lineage tracing demonstrated that KDM4A inhibition plus PD1 blockade efficiently eliminated cancer stem cells. Altogether, our results demonstrate that targeting KDM4A can activate anti-tumor immunity and enable PD1 blockade immunotherapy by aggravating replication stress in SCC cells.

Keywords: DNA replication stress; H3K9me3; KDM4A; PD-1 blockade; Phase separation; cancer stem cells; head and neck squamous cell carcinoma; heterochromatin condensates; immune surveillance; metastasis.


Conflict of interest statement

Declaration of interests The authors declare no competing interests.

Figures

Figure 1.
Figure 1.. Epithelial KDM4A Deletion Inhibits Mouse SCC Growth and Lymph Node Metastasis
(A) Quantification of tongue SCC number in both control (Cre, n = 12) and 4AKO (n = 11) mice. Values represent mean values ± SD from the pool of two independent experiments. **p < 0.01 by Student’s t test. (B) Representative images of H&E staining and immunostaining of PCK. Scale bar, 200 μm. Enlarged images are shown in the inserts. Scale bar in inserts, 10 μm. (C) Quantification of SCC area in both control (n = 12) and 4AKO (n = 11) mice. **p < 0.01 by Student’s t test. (D) Histogram of primary mouse tumor invasion degree in both control (n = 12) and 4AKO (n = 11) mice. **p < 0.01 by Cochran-Armitage test. (E) Percentage of metastatic lymph nodes in both control (n = 12) and 4AKO (n = 11) mice. **p < 0.01 by Chi-square test. (F) Immunostaining of PCK in lymph nodes in both control and 4AKO mice. Scale bar, 200μm. (G) Quantification of metastatic areas in lymph nodes from both control (n = 12) and 4AKO (n = 11) mice. Values are mean ± SEM. **p < 0.01 by Student’s t test. (H) Primary tongue SCC numbers in both control (n = 10) and 4AKO (n = 12) mice. Mean values ± SD are shown from the pool of two independent experiments. **p < 0.01 by Student’s t test. (I) Representative images of H&E staining and PCK staining of SCCs from mice. Scale bars, 200 μm. Inserts show the enlarged images with 10 μm scale bars. (J) Quantification of primary mouse SCC areas in both control and 4AKO mice. Values are mean ± SD from the pool of two independent experiments. **p < 0.01 by Student’s t test. (K) Histogram of primary tumor invasion degrees. **p < 0.01 by Cochran-Armitage test. (L) Quantification of metastatic lymph nodes. **p < 0.01 by Chi-square test. (M) Representative PCK immunostaining of lymph nodes. Scale bar, 200μm. (N) Quantification of metastatic areas in lymph nodes. Values are mean ± SEM. **p < 0.01 by Student t test. Also see Figure S1.
Figure 2.
Figure 2.. Tumor Cell KDM4A Ablation Suppresses Cancer Stemness and Stimulates Anti-tumor Immunity in Primary Mouse SCC
(A) Representative images of tumor spheres derived from Si-Scr, Si1-4A and Si2-4A ALDHhigh SCC23 cells. Scale bar, 200 μm. (B) Experimental schemes of Kdm4a knockout and simultaneous lineage tracing of CSCs in primary SCC. (C) Representative fluorescence images and quantification of BMI1+ CSC-derived clones in primary mouse SCCs. Values represent mean ± SEM from the pool of two independent experiments. n = 6:6. Scale bar 200 μm. **p<0.01 by Student t test. (D) Histogram showing top 7 upregulated biological processes in primary SCC of 4AKO mice. Samples were analyzed in duplicate. (E) Gene set enrichment analysis (GSEA) plot of IFNB1 targets of primary SCC in 4AKO mice versus control mice. ES, enrichment score. NES, normalized enrichment score. Samples were analyzed in duplicate. (F) Heat map showing enrichment of at least 3-fold upregulated genes inside the Bosco_Th1 cytotoxic module in 4AKO SCC. RPKM, Reads Per Kilobase of transcript, per Million mapped reads. (G) Gene set enrichment analysis (GSEA) plot of defense response to virus-related genes of primary SCC in 4AKO mice versus control mice. (H) Gene set enrichment analysis (GSEA) plot of Th1 cytotoxic genes of primary SCC in 4AKO mice versus control mice. (I) Immunofluorescence staining and quantification of AcCasp3-positive apoptotic cells in SCCs from both control and 4AKO mice. (J and K) Immunofluorescence staining and quantification of CXCL10 (J) and CXCL11(K) in primary mouse SCCs (L) Immunofluorescence staining and quantification of CD8+ T cells in primary mouse SCCs. (D-H) Tumor tissues were pooled for RNA sequencing (RNA-Seq), n = 2 (control mice); n = 2 (4AKO mice). (I-L) Values are mean ± SEM from two independent experiments. n = 10 (control mice); n = 5 (4AKO mice). **p < 0.01 by Student’s t test. All scale bars, 10 μm. Of note, we totally utilized 10 mice for the control group and 12 mice for the 4AKO group, respectively. However, the samples with SCCs only were stained and analyzed because we could not detect SCCs in some mice. Also see Figure S2
Figure 3.
Figure 3.. KDM4A Inhibition in SCC cells Induces Replication Stress and DNA Damage
(A) Western blot analysis of the Co-immunoprecipitation of endogenous KDM4A with MCM2 and MCM7 in SCC23 cells. (B) Representative images of DNA fibers and the quantification of replication fork progress rate in Scr and 4AKO SCC23 cells. The midlines show median values of each group. Scale bar, 5μm. **p<0.01 by Mann-Whitney test. (C) Representative images of bidirectional DNA fibers and the quantification of asymmetry forks (stalled forks) in Scr and 4AKO SCC23 cells. Fibers with more than 30% of asymmetry were considered. Value represents mean ± SD. Scale bar, 5 μm. **p < 0.01 by one-way ANOVA test. (D) Immunofluorescence staining of DAPI and quantification of chromatin bridges in Scr and 4AKO SCC23 cells. Arrows indicate the chromatin bridges. Values represent mean ± SEM from at least two independent experiments. *p<0.05 by one-way ANOVA. Scale bar, 10 μm. (E) Representative images and quantification of DNA Comet assays in Scr and 4AKO SCC23 cells. More than 300 cells were analyzed in every group. Values represent mean ± SEM from three independent experiments. Scale bar, 50 μm. *p<0.05 by one-way ANOVA test. (F) γH2A.X protein levels in Scr and 4AKO SCC23 cells by Western blot. (G) Representative confocal images showing DAPI (left upper panel) and the co-localization (left lower panel) of γH2A.X (red) with H3K9me3 (green), and localization analysis for γH2A.X and H3K9me3 along the indicated line scan in 4AKO SCC23 cells. Scale bar, 5 μm. (H) Quantification of γH2A.X foci in the experiment of (G). Values represent mean ± SEM from three independent experiments. **p < 0.01 by paired Student’s t test. (I) Immunofluorescence staining and quantification of γH2A.X in primary mouse SCCs. values are mean ± SEM from two independent experiments. n = 10 (control mice); n = 5 (4AKO mice). **p < 0.01 by Student’s t test. All scale bars, 10 μm. (J) Quantification of replication fork progress rate in both Scr and 4AKO SCC23 cells transfected with Si-scr or Si1-HP1γ. The midlines show median values of each group. **p<0.01 by two-way ANOVA. (K) Quantification of asymmetry forks in Scr and 4AKO SCC23 cells transfected by Si-scr or Si1-HP1γ. Mean ± SD are shown. ns, not significant, *p < 0.05 and **p < 0.01 by by Mann-Whitney test. (L) Quantification of DNA Comet assays in Scr and 4AKO SCC23 cells transfected by Si-scr or Si1-HP1γ. Data, shown by mean ± SEM, were collected from three independent experiments. ns, not significant and **p<0.01 by two-way ANOVA. Also see Figure S3
Figure 4.
Figure 4.. KDM4A Inhibition Promotes Th1-type Chemokine Expression by Activation of cGAS-STING Signaling
(A and B) Representative confocal images showing cytosolic DNA and mitochondria (red) as well as nuclei (blue), and quantification of cytosolic ssDNA (lower left panel) and dsDNA (lower right panel) in Scr and 4AKO SCC23 cells (A) and in SCC1 cells transfected with Si-Scr, Si1-4A and Si2-4A (B). Scale bar, 10 μm. Values are mean ± SD from the pool of three independent experiments. *p < 0.05, **p < 0.01 by one-way ANOVA. (C and D) Western blot analysis of phosphorylated and total IRF3, TBK1 and STING in Scr and 4AKO SCC23 cells (C) and in Si-Scr and Si-4A SCC1 cells (D). (E and F) Gene expression analysis of IFNB and Th1-type chemokines (CXCL9, CXCL10, CXCL11) in Scr and 4AKO SCC23 cells (E) and in Si-Scr and Si-4A SCC1 cells (F). Values are mean ±SD from three independent experiments. *p<0.05 and **p<0.01 by one-way ANOVA. (G) Gene expression analysis of IFNB, CXCL10 and CXCL11 in both Scr and 4AKO1 SCC23 cells treated with either DMSO or 10 μM RU.521. Values are mean ± SD from three independent experiments. **p<0.01 by two-way ANOVA. (H) Gene expression analysis of IFNB, CXCL10 and CXCL11 in both Scr and 4AKO1 SCC23 cells treated with either IgG or anti-IFNβ. Values are mean ± SD from three independent experiments. **p<0.01 and ns, not significant by two-way ANOVA. (I) qRT-PCR analysis of IFNB, CXCL10 and CXCL11 in both Scr and 4AKO1 SCC23 cells transfected with either Si-Scr or Si1-HP1γ. Values are mean ± SD from three independent experiments. **p<0.01 by two-way ANOVA. (J and K) Gene expression analysis of IFNB and Th1-type chemokines in SCC23 cells (J) and SCC1 cells (K). Values are mean ±SD from three independent experiments. *p<0.05 and **p<0.01 by Student’s t test. (L) Gene expression analysis of IFNγ-induced Th1-type chemokines in Scr and 4AKO SCC23 cells. Values are mean ± SD from three independent experiments. *p<0.05 and **p<0.01 by one-way ANOVA. (M) Analysis of CXCL10 and CXCL11 protein levels with ELISA assay in IFNγ-treated Scr and 4AKO1 SCC23 cells. Values are mean ± SD from three independent experiments. **p<0.01 by Student’s t test. Also see Figure S3
Figure 5.
Figure 5.. KDM4A Loss Increases Liquid-like HP1γ puncta in SCC cells
(A) Immunofluorescence staining of HP1γ and DAPI, and quantification of HP1γ puncta in Scr and 4AKO SCC23 cells. Values showed by mean ± SD were pooled from three independent experiments. Scale bar, 5 μm. **p<0.01 by one-way ANOVA. (B) Representative immunofluorescence images of HP1γ (green), H3K9me3 (red), DAPI (blue) and their merge, and localization analysis for HP1γ puncta, H3K9me3 and DAPI along the indicated line scan (white arrow) in 4AKO SCC23 cells. Scale bar, 2 μm. (C) Representative fluorescence images and quantitative analysis of fluorescence recovery after photobleaching (FRAP) on GFP-HP1γ puncta in 4AKO SCC23 cells. Arrowheads indicated the puncta that were analyzed by FRAP assay. Scale bar, 2 μm. Values were shown by mean ± SD (n=12, GFP-HP1γ puncta) from one representative of three independent experiments. (D) Live-cell imaging of 4AKO SCC23 cells expressing GFP-HP1γ. The arrows indicate two HP1γ puncta that are fusing over time. Three independent experiments show similar results. Scale bar, 5 γm. (E) Representative immunofluorescence staining of HP1γ and FLAG in Scr and 4AKO SCC23 cells transfected with empty or Flag-KDM4A expression vectors. Scale bar, 5 μm. (F) Representative confocal fluorescence images showing HP1γ (green), H3K9me3 (red) and DAPI (blue) in primary SCCs from both control (Cre) and 4AKO mice. Enlarged images were shown in the inserts. Scale bar, 2 μm. Scale bar in the insert, 1 μm. (G) Representative confocal fluorescence images of HP1γ (red), H3K9me3 (blue), Edu (green) and their merges in 4AKO SCC23 cells. Scale bar, 2 μm. (H) Localization analysis for Edu, HP1γ and H3K9me3 along the indicated line scan (white arrow) in (G). (I) Representative immunofluorescence images of HP1γ (green), PCNA (red), DAPI (blue) and their merge, and localization analysis for HP1γ puncta and PCNA along the indicated line scan (white arrow) in 4AKO SCC23 cells. Scale bars, 2 μm. (J) Immunofluorescence staining of HP1γ (green), PCNA (red) and DAPI (blue), and localization analysis for HP1γ condensates and PCNA along the indicated line scan (white arrow) in primary SCCs from 4AKO mice. Enlarged images of single channels and merge were shown in inserts. Scale bars for main images, 5 μm. Scale bars for inserts, 2 μm. Also see Figure S4 and S5
Figure 6.
Figure 6.. Th1-type Chemokines-induced CD8+ T Cell Infiltration Accounts for the Inhibitory Impacts of KDM4A Deletion on Primary Mouse SCC Growth and Lymphatic Metastasis
(A) Schematic diagram for anti-CXCR3 treatment in Cre and 4AKO mice with 4-NQO-induced SCCs. (B) Immunofluorescence staining and quantification of CD8+ T cell infiltration within primary mouse SCC in both Cre and 4AKO mice treated by IgG or anti-CXCR3. Scale bars, 10 μm. Values represent mean ± SEM from the pool of two independent experiments. n = 10:6:15:12. **p < 0.01 by two-way ANOVA. (C) Quantification of primary mouse SCC number in both Cre and 4AKO mice treated by either IgG or anti-CXCR3. Values are mean ±SD from the pool of two-independent experiments. n = 11:17:15:15. ns, not significant, *p<0.05 and **p<0.01 by two-way ANOVA. (D) Representative images showing H&E staining (upper) and PCK immunostaining (lower) of SCCs in both Cre and 4AKO mice treated by either IgG or anti-CXCR3. Scale bars, 200 μm. Inserts are enlarged images with 10 μm scale bars. (E) Quantification of primary SCC areas. *p<0.05 and **p<0.01 by two-way ANOVA. (F) Histogram analysis of tumor invasion degree. *p < 0.05, **p < 0.01 and ns, not significant by Cochran-Armitage test. (G) Immunofluorescence staining and quantification of AcCasp3–positive tumor cells. Scale bars, 10μm. Values represent mean ± SEM from the pool of two independent experiments. n = 10:6:15:12. **p < 0.01 and ns, not significant by two-way ANOVA. (H) Quantification of metastatic lymph nodes. ns, not significant and **p < 0.01 by Chisquare test. (I) Immunostaining of PCK in lymph nodes. Scale bar, 200 μm. (J) Quantification of metastatic areas in lymph nodes. Values represent mean ± SEM. n=11:17:15:15. ns, not significant, *p<0.05 and **p<0.01 by two-way ANOVA.
Figure 7.
Figure 7.. Targeting KDM4A Overcomes SCC Resistance to PD1 Blockade and Eliminates CSCs by Recruiting CD8+ T cells into Tumors.
(A) Quantification of primary SCC number in mice treated with anti-PD1, KDM4i or their combination. Values represent mean ± SD from the pool of two independent experiments. n=13:10:13:17. ns, not significant, and **p < 0.01 by one-way ANOVA. (B) H&E staining and area quantification of primary SCCs. Scale bar, 200 μm. Enlarged images were shown in inserts with 10 μm scale bar. n = 13:10:13:17. ns, not significant, *p < 0.05 and **p<0.01 by one-way ANOVA. (C) Histogram analysis of primary tumor invasion grades. ns, not significant, *p<0.05 and **p<0.01 by Cochran-Armitage test. (D) Immunofluorescence staining and quantification of apoptotic tumor cells. Values are mean ± SEM from the pool of two-independent experiments. n = 12:9:9:4. ns, and **p < 0.01 by one-way ANOVA. (E) Immunofluorescence staining and quantification of GZMB+CD8+ T cells within and around tumor islets. Values represent mean ± SEM from the pool of two independent experiments. Scale bars, 10 μm. n = 12:9:9:4. ns, not significant, and **p<0.01 by one-way ANOVA. (F) Representative immunofluorescence staining of HP1γ (green), PCK (red) and DAPI (blue) in primary SCCs of mice. Scale bar, 2 μm. Enlarged images were shown in inserts with 1 μm scale bar. (G and H) Representative fluorescence images (G) and quantification (H) of tdTomato+ cells (BMI1+ CSCs) in primary SCCs of mice. n = 6:6:6:6. Scale bar 10 μm. ns, not significant, *p<0.05 and **p<0.01 by one-way ANOVA. (I) Quantification of primary tongue SCC number in 4AKO mice treated with anti-PD1 or IgG. Values are mean ± SD from the pool of two independent experiments, n = 13:12. *p < 0.05 by Student’s t test. (J) H&E staining and area quantification of primary SCCs. Scale bar for the main image, 200 μm. Inserts are enlarged images with 10 μm scale bar. Values are mean ± SD from the pool of two independent experiments, n = 13:12. **p < 0.01 by Student’s t test. (K) Quantification of primary tumor invasion degree in 4AKO mice treated with anti-PD1 or IgG. n = 13:12. *p < 0.05 by Cochran-Armitage test. (L) Percentage of metastatic lymph nodes in 4AKO mice treated with anti-PD1 or IgG. Data are collected from two independent experiments. n = 13:12. **p < 0.01 by Chisquare test. (M) PCK immunostaining and quantification of metastatic areas in lymph nodes from 4AKO mice. n = 13:12. Values represent mean values ± SEM from two independent experiments. *p < 0.05 by Student’s t test. Scale bars, 200 μm. (N) Immunofluorescence staining and quantification of apoptotic tumor cells in primary mouse SCCs in 4AKO mice treated by either anti-PD1 (n = 6) or IgG (n = 10). Values are mean ± SEM from the pool of two independent experiments. Scale bars, 10μm. **p<0.01 by Student’s t test. (O) Immunofluorescence staining of GZMB+CD8+ T cells within and around tumor islets. Scale bars, 10 μm. Also see Figures S6 and S7.

References

    1. Black JC, Allen A, Van Rechem C, Forbes E, Longworth M, Tschop K, Rinehart C, Quiton J, Walsh R, Smallwood A, et al. (2010). Conserved antagonism between JMJD2A/KDM4A and HP1gamma during cell cycle progression. Mol. Cell 40, 736–748. - PubMed
    1. Black JC, Manning AL, Van Rechem C, Kim J, Ladd B, Cho J, Pineda CM, Murphy N, Daniels DL, Montagna C, et al. (2013). KDM4A lysine demethylase induces site-specific copy gain and rereplication of regions amplified in tumors. Cell 154, 541–555. - PMC - PubMed
    1. Bray F, Ferlay J, Soerjomataram I, Siegel RL, Torre LA, and Jemal A (2018). Global cancer statistics 2018: GLOBOCAN estimates of incidence and mortality worldwide for 36 cancers in 185 countries. CA Cancer J. Clin. 68, 394–424. - PubMed
    1. Chabanon RM, Muirhead G, Krastev DB, Adam J, Morel D, Garrido M, Lamb A, Henon C, Dorvault N, Rouanne M, et al. (2019). PARP inhibition enhances tumor cell-intrinsic immunity in ERCC1-deficient non-small cell lung cancer. J. Clin. Invest. 129, 1211–1228. - PMC - PubMed
    1. Chen D, Wu M, Li Y, Chang I, Yuan Q, Ekimyan-Salvo M, Deng P, Yu B, Yu Y, Dong J, et al. (2017). Targeting BMI1(+) Cancer Stem Cells Overcomes Chemoresistance and Inhibits Metastases in Squamous Cell Carcinoma. Cell Stem Cell 20, 621–634 e626. - PMC - PubMed

Publication types

MeSH terms