. 2021 Apr 1;184(7):1884-1894.e14.
doi: 10.1016/j.cell.2021.02.041. Epub 2021 Mar 19.

Delineating the conformational landscape of the adenosine A2A receptor during G protein coupling

Affiliations

Delineating the conformational landscape of the adenosine A2A receptor during G protein coupling

Shuya Kate Huang et al. Cell. .

Abstract

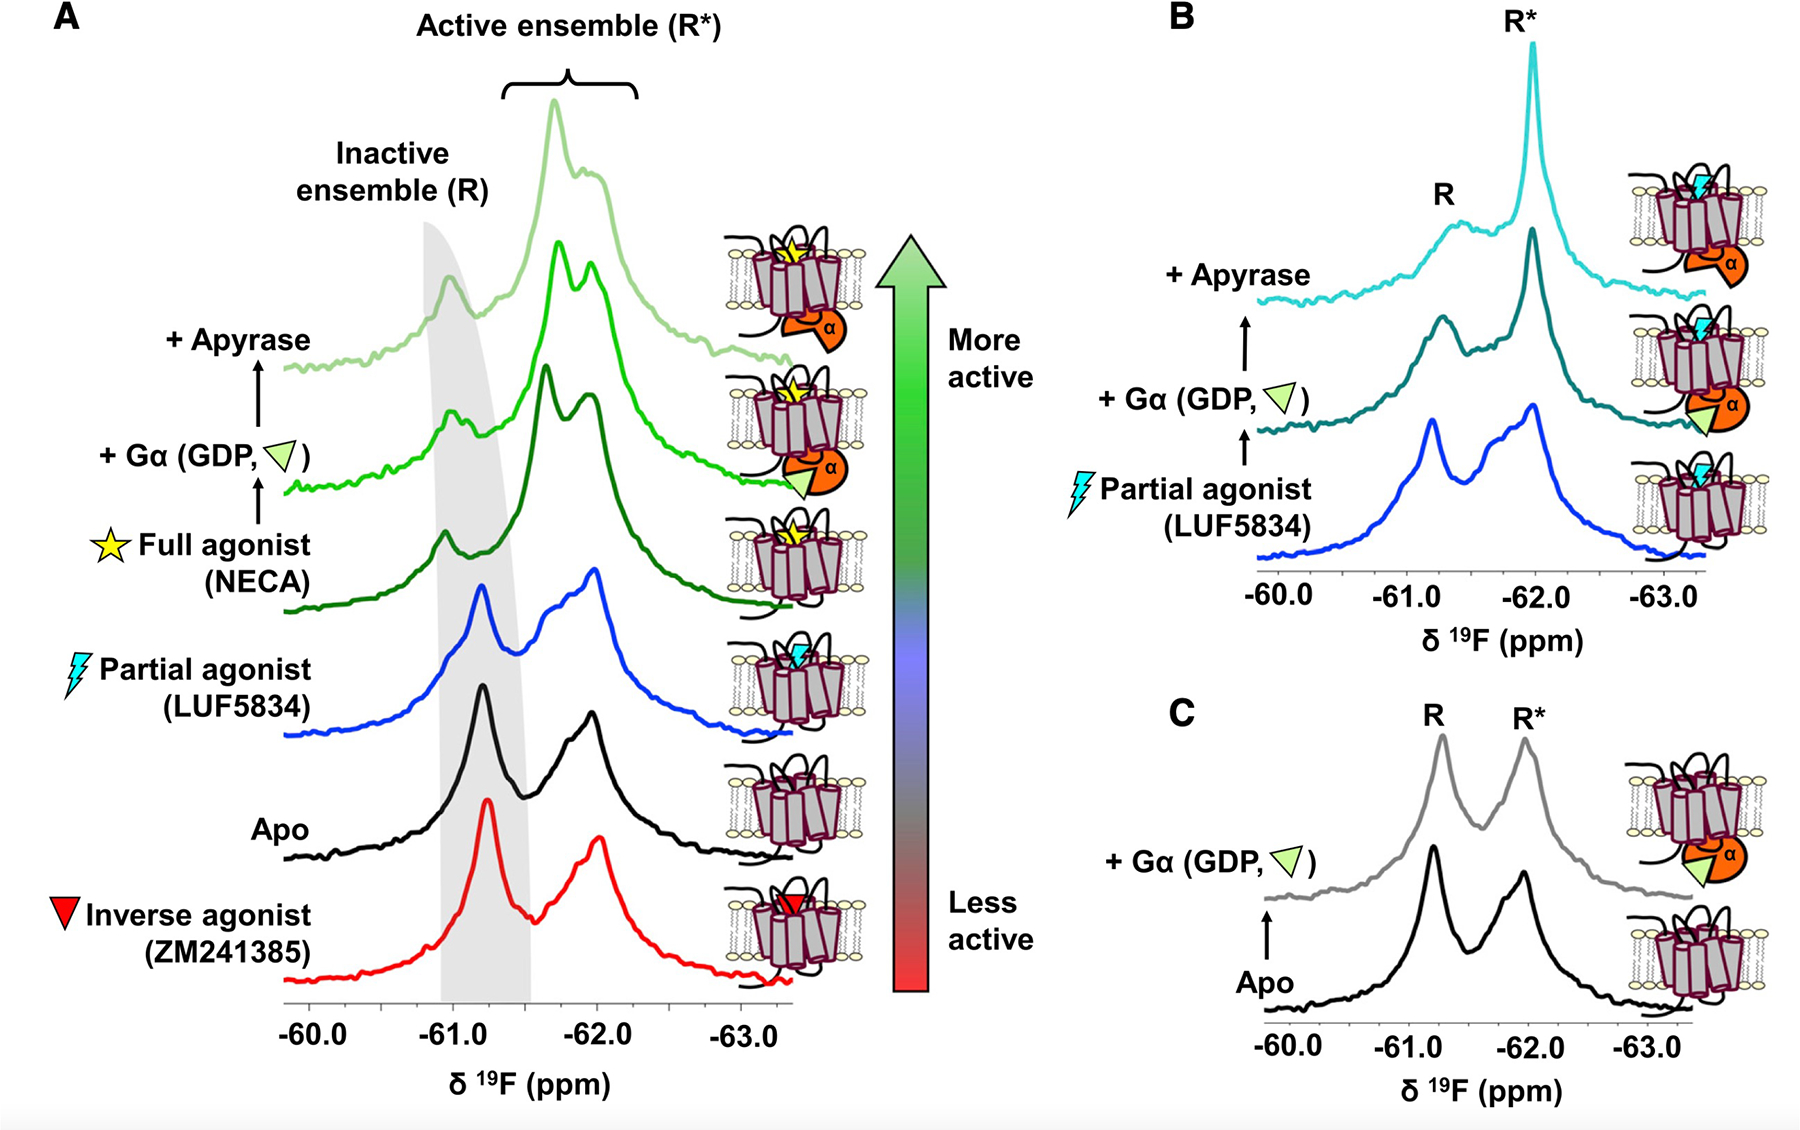
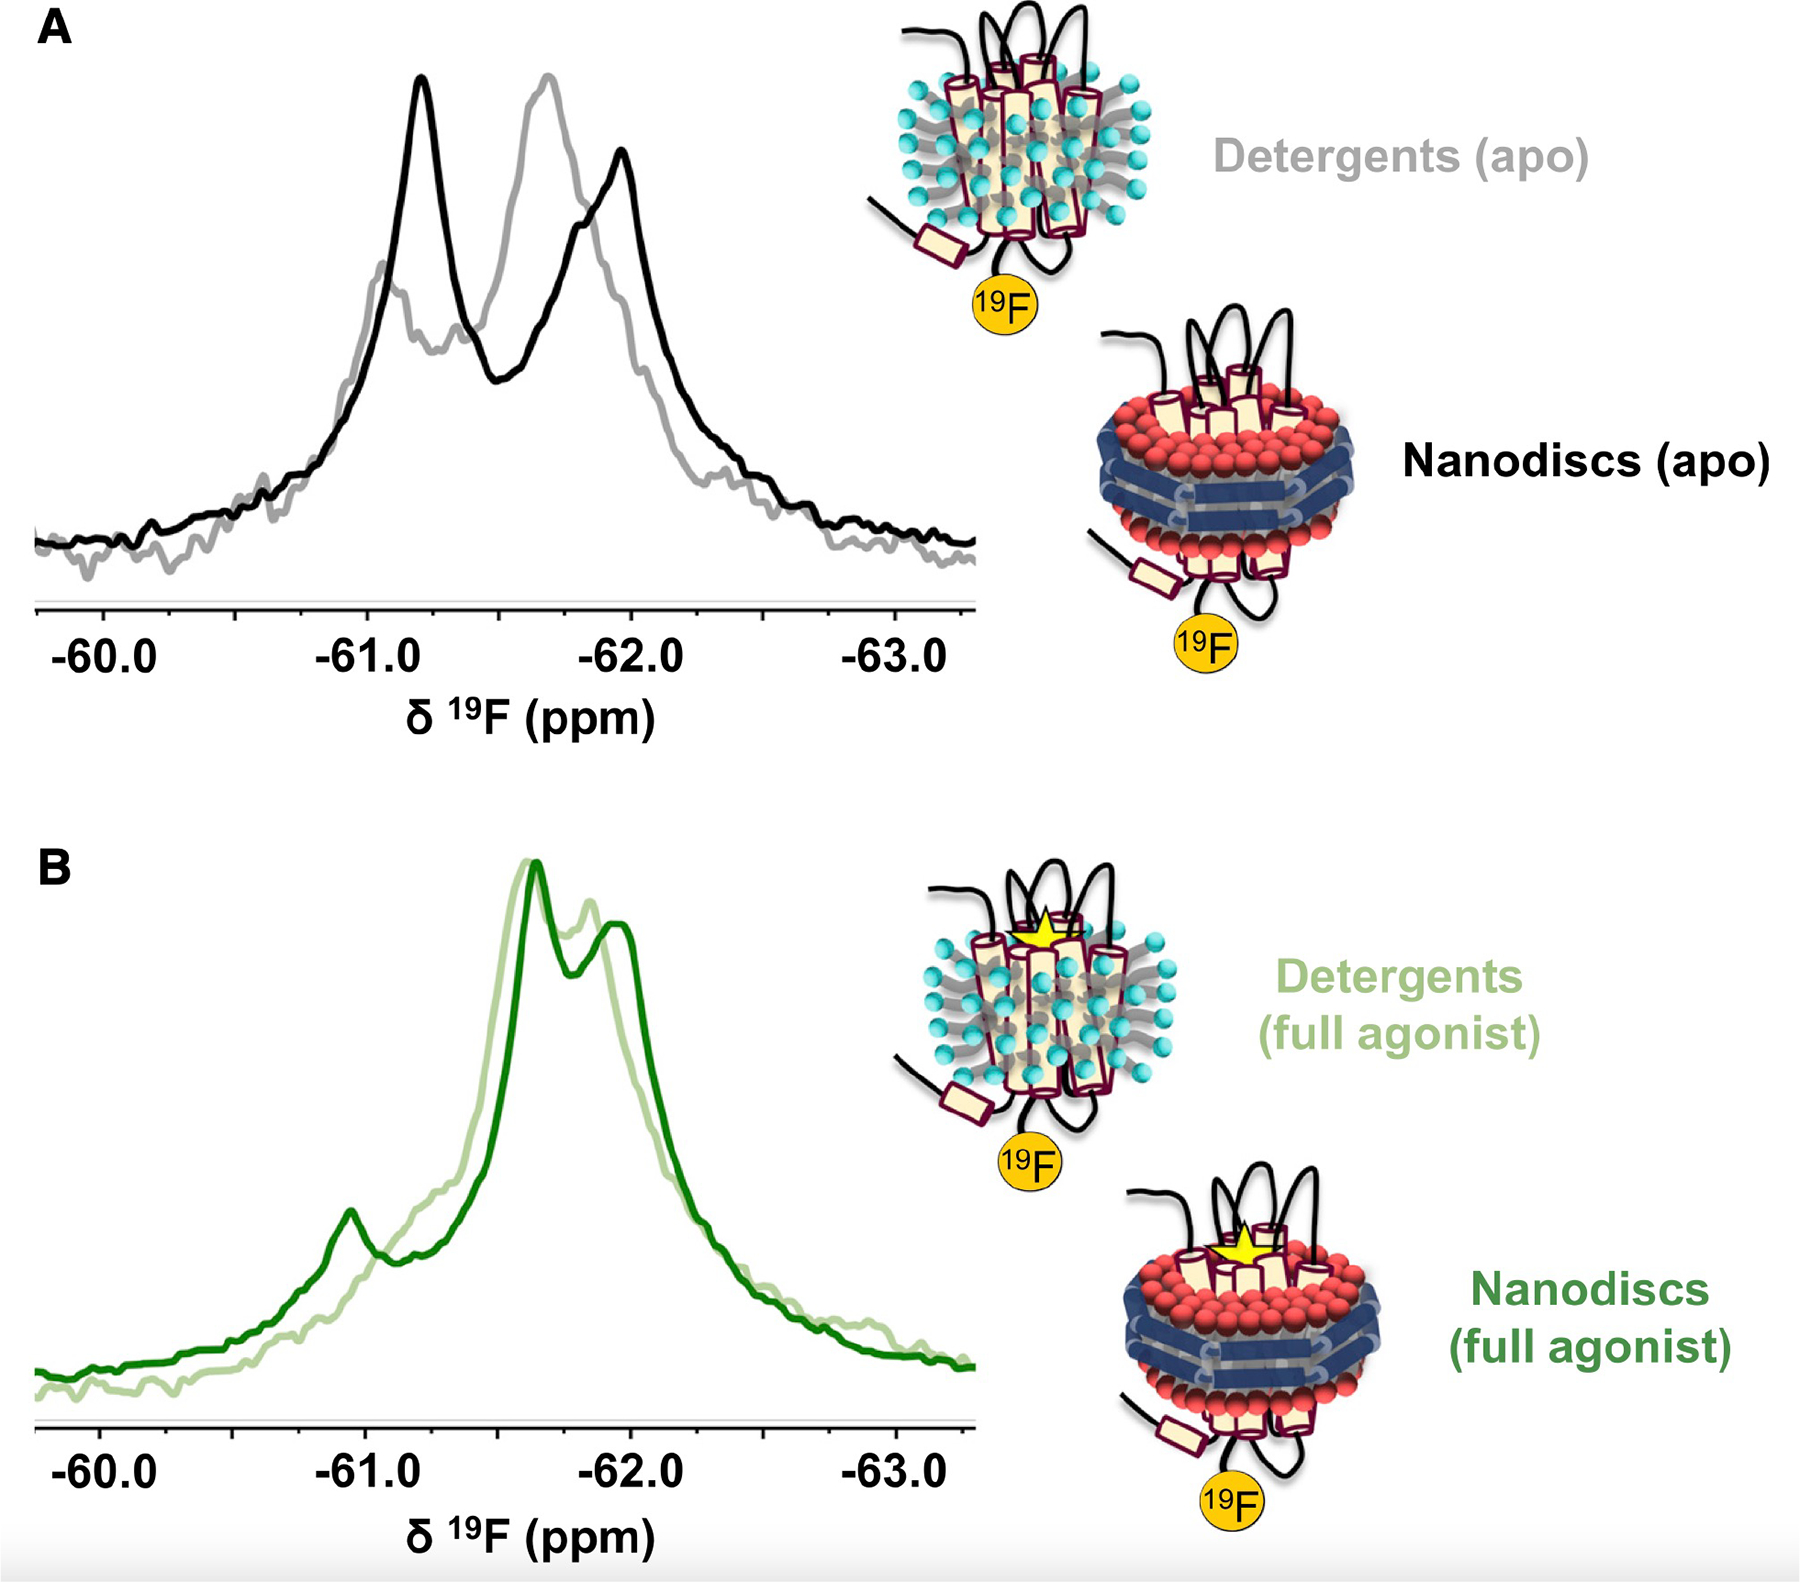
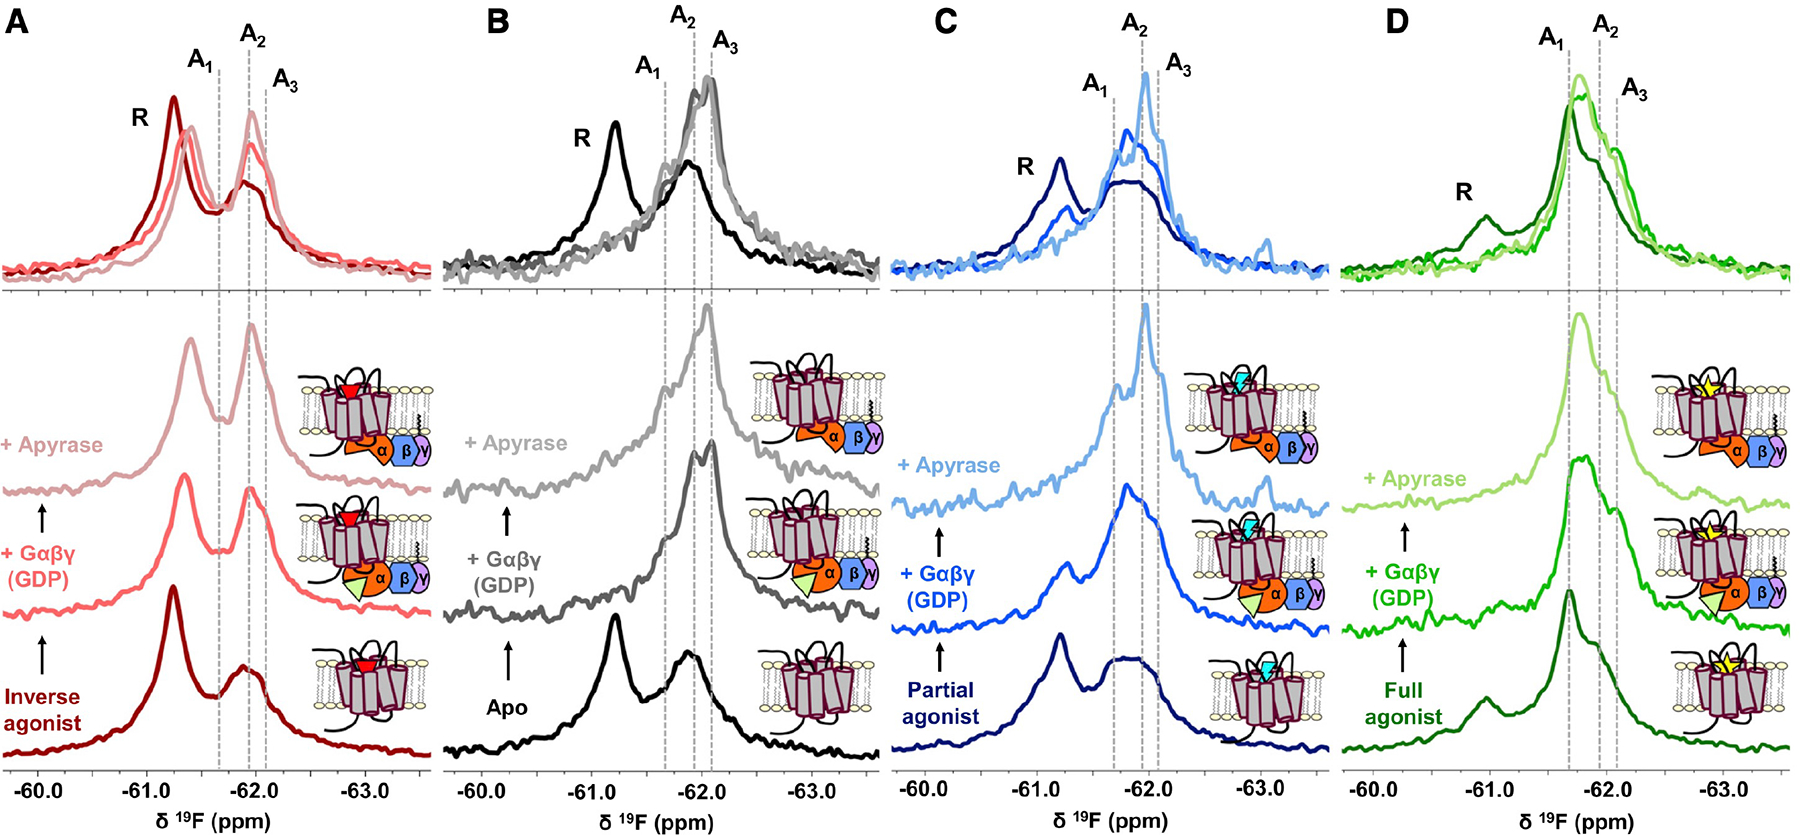
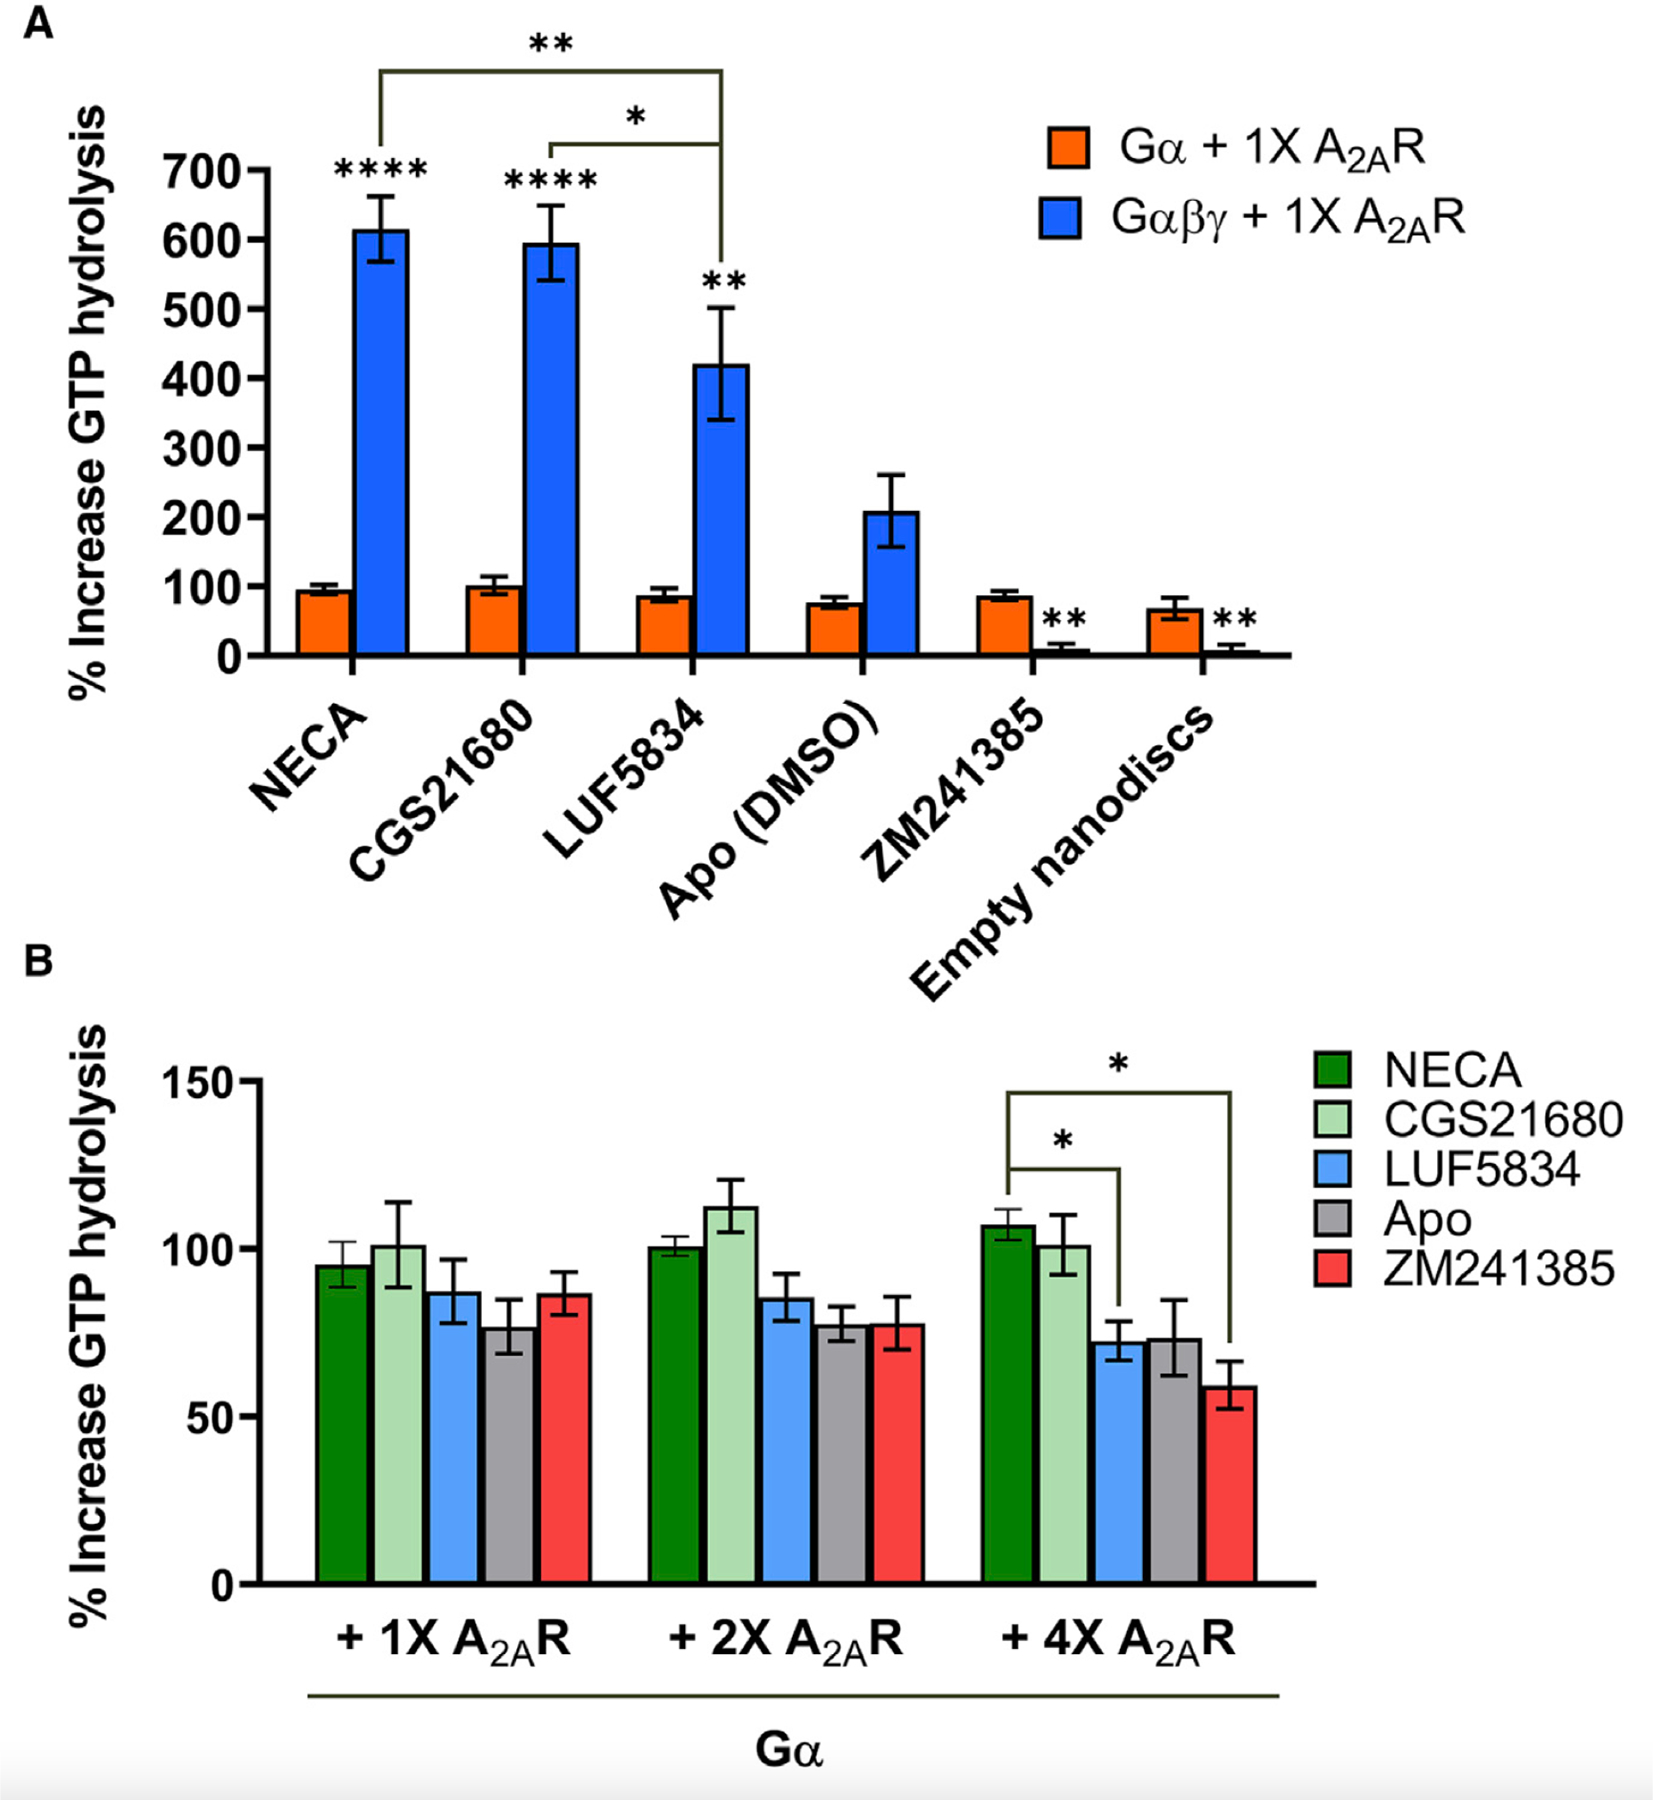
G-protein-coupled receptors (GPCRs) represent a ubiquitous membrane protein family and are important drug targets. Their diverse signaling pathways are driven by complex pharmacology arising from a conformational ensemble rarely captured by structural methods. Here, fluorine nuclear magnetic resonance spectroscopy (19F NMR) is used to delineate key functional states of the adenosine A2A receptor (A2AR) complexed with heterotrimeric G protein (Gαsβ1γ2) in a phospholipid membrane milieu. Analysis of A2AR spectra as a function of ligand, G protein, and nucleotide identifies an ensemble represented by inactive states, a G-protein-bound activation intermediate, and distinct nucleotide-free states associated with either partial- or full-agonist-driven activation. The Gβγ subunit is found to be critical in facilitating ligand-dependent allosteric transmission, as shown by 19F NMR, biochemical, and computational studies. The results provide a mechanistic basis for understanding basal signaling, efficacy, precoupling, and allostery in GPCRs.

Keywords: (19)F NMR; G protein; GPCR; adenosine A(2A) receptor; allostery; partial agonism; precoupling; rigidity transmission allostery.


Conflict of interest statement

Declaration of interests The authors declare no competing interests.

Figures

Figure 1.
Figure 1.. A2AR adopts an ensemble of conformational states and an activation mechanism consistent with conformational selection.
(A) 19F NMR spectra of nanodisc-reconstituted A2AR-V229C as a function of ligand, Gα, and nucleotide. Addition of apyrase removes nucleotide (GDP) from G proteins. The receptor was placed under increasingly activating conditions, as indicated by the color gradient bar. The apo receptor (black trace) samples both inactive (R, gray band) and active (R*) states, whose populations are modulated through the binding of ligands (antagonist, partial agonist, and full agonist), Gα, and GDP, in a lipid environment. (B and C) Spectra of partial agonist-bound (B) or apo (C) receptor with and without Gα.
Figure 2.
Figure 2.. A2AR exhibits a different distribution of states and slower exchange dynamics in a lipid bilayer environment than in detergent micelles.
(A and B) Comparison of the 19F NMR spectra of apo (A) or agonist-bound (B) A2AR reconstituted in either lauryl maltose-neopentyl glycol (LMNG) micelles or phospholipid nanodiscs. Data for the detergent spectra were obtained from Ye et al. (2016) with permission from the authors.
Figure 3.
Figure 3.. The precoupled state and nucleotide-free states are key facets of activation.
(A–D) 19F NMR spectra of A2AR-V229C as a function of ligands, Gαβγ, and GDP. The addition of Gs heterotrimer (Gαβγ) and subsequently apyrase to inverse agonist-bound (A), apo (B), partial-agonist-bound (C), and full-agonist-bound (D) A2AR enabled the assignment of at least three unique active state conformers as indicated by the gray dashed lines at 61.70 ppm (A1), 61.95 ppm (A2), and 62.10 ppm (A3). Stabilization of representative states by the GDP-bound Gαβγ and nucleotide-free Gαβγ can be directly visualized in the overlaid spectra.
Figure 4.
Figure 4.. Gβγ enhances receptor-mediated nucleotide exchange and ligand dependence of GEF action.
(A) Percent increase in GTP hydrolysis by either Gα or Gαβγ in the presence of one stoichiometric equivalence of A2AR bound to full agonists (NECA and CGS21680), partial agonist (LUF5834), inverse agonist (ZM241385), or no ligand, relative to the amount of GTP hydrolyzed by Gα or Gαβγ alone in the absence of A2AR over a 90-min period. Data represent mean ± SEM (n=3). Asterisks directly above the bars represent statistical significance relative to the apo condition. Statistical significance was determined by two-way ANOVA followed by the Bonferroni (comparison of Gα and Gαβγ for each ligand) or the Tukey test (comparison of each ligand condition to each other). In the case of Gα, there is no significant difference be-tween each ligand. (B) Percent increase in GTP hydrolysis by Gα in the presence of one, two, or four stoichiometric equivalence of A2AR bound to full agonists (NECA and CGS21680), partial agonist (LUF5834), inverse agonist (ZM241385), or no ligand, relative to the amount of GTP hydrolyzed in the absence of A2AR over a 90-min period. Data represent mean ± SEM (n=3). Statistical significance was determined by multiple t test using the Holm-Sidak method. *p ≤ 0.05; **p ≤ 0.01; ***p ≤ 0.001; ****p ≤ 0.0001.
Figure 5.
Figure 5.. The A2AR-Gsαβγ interaction is characterized by similar affinity and binding kinetics when bound to a full agonist or a partial agonist.
(A) A2AR-G protein interactions assessed by native-PAGE. Note that due to negatively charged lipids and the natural size distribution of nanodiscs, A2AR migrated further down the gel and the corresponding band appears smeared relative to that in the presence of Gα and Gαβγ. Consequently, complexation with receptor resulted in a band for the A2AR-Gαβγ complex that appeared lower on the gel than Gαβγ alone. This effect is absent in the case of Gα. (B and C) Representative SPR binding curves (solid lines) for the interaction of Gαβγ with immobilized A2AR saturated with either partial agonist (B) or full agonist (C). Curves obtained at the three indicated concentrations were simultaneously fitted to a one-to-one binding model (dotted lines). (D) SPR-derived Kd values and on/off rates for the interaction between A2AR and Gαβγ in the presence of indicated ligands. Data represent mean ± SD (n = 3).
Figure 6.
Figure 6.. Gβγ plays a key role in reinforcing allosteric pathways and signal transmission.
(A) The allosteric network within the ternary complex is revealed through rigidity theory analysis. Here, allosteric transmission is measured by regiospecific changes in degrees of freedom (red/blue color gradient bar) experienced upon rigidification of the agonist NECA (yellow spheres). An allosteric pathway can be defined between the orthosteric pocket and Gsαβγ that, in turn, connects with the nucleotide-binding region. Green spheres designate GDP, and the orange sphere represents Mg2+. (B) The symmetric property of allosteric transmission means that Gβγ, despite not being in direct contact with the receptor, may impart allosteric effects on remote regions in the pathway such as the orthosteric binding site (curved purple arrow). Nucleotide exchange involves structural rearrangement of Gα facilitated by movements of conserved motifs (annotated inset). This likely requires a concerted interplay between receptor and both the Gα and Gβγ subunits acting on the nucleotide-binding pocket (gray block arrows).
Figure 7.
Figure 7.. A2AR populates a dynamic energy landscape encompassing key functional states associated with activation, G protein coupling, and nucleotide exchange.
The conformational ensemble of A2AR is represented by five key functional states—two inactive states (S1 and S2) differentiated by the switching of a conserved ionic lock and three active states (A1, A2, and A3) associated with G protein coupling. A3, an intermediate or precoupled state, plays a role in the recognition and binding of the G protein. A1 and A2, on the other hand, are responsible for GDP release and stabilization of the nucleotide-free complex. While A1 is more efficacious (thicker downward arrow) and stabilized to a larger extent by the full agonist, A2 is less efficacious (thinner downward arrow) and is preferentially stabilized by a partial agonist. Although not included in this work, we also envision a state where the receptor forms a transiently stable complex with a GTP-bound G protein. The activation pathway can be considered as a series of reversible transformations between states (red arrows), whose populations and lifetimes are modulated through the presence of ligands, G protein, nucleotides, and other allosteric factors.

Comment in

References

    1. Ballesteros JA, and Weinstein H (1995). Integrated methods for the construction of three-dimensional models and computational probing of structure-function relations in G protein-coupled receptors. Methods Neurosci. 25, 366–428.
    1. Ballesteros JA, Jensen AD, Liapakis G, Rasmussen SGF, Shi L, Gether U, and Javitch JA (2001). Activation of the b 2-adrenergic receptor involves disruption of an ionic lock between the cytoplasmic ends of transmembrane segments 3 and 6. J. Biol. Chem 276, 29171–29177. - PubMed
    1. Bockenhauer S, Furstenberg A, Yao XJ, Kobilka BK, and Moerner WE (2011). Conformational dynamics of single G protein-coupled receptors in solution. J. Phys. Chem. B 115, 13328–13338. - PMC - PubMed
    1. Bradford W, Buckholz A, Morton J, Price C, Jones AM, and Urano D (2013). Eukaryotic G protein signaling evolved to require G protein-coupled receptors for activation. Sci. Signal 6, ra37. - PMC - PubMed
    1. Braun S, and Levitzki A (1979). Adenosine receptor permanently coupled to turkey erythrocyte adenylate cyclase. Biochemistry 18, 2134–2138. - PubMed

Publication types

MeSH terms