. 2021 Apr 29;184(9):2394-2411.e16.
doi: 10.1016/j.cell.2021.03.012. Epub 2021 Mar 11.

Discovery and functional interrogation of SARS-CoV-2 RNA-host protein interactions

Affiliations

Discovery and functional interrogation of SARS-CoV-2 RNA-host protein interactions

Ryan A Flynn et al. Cell. .

Abstract

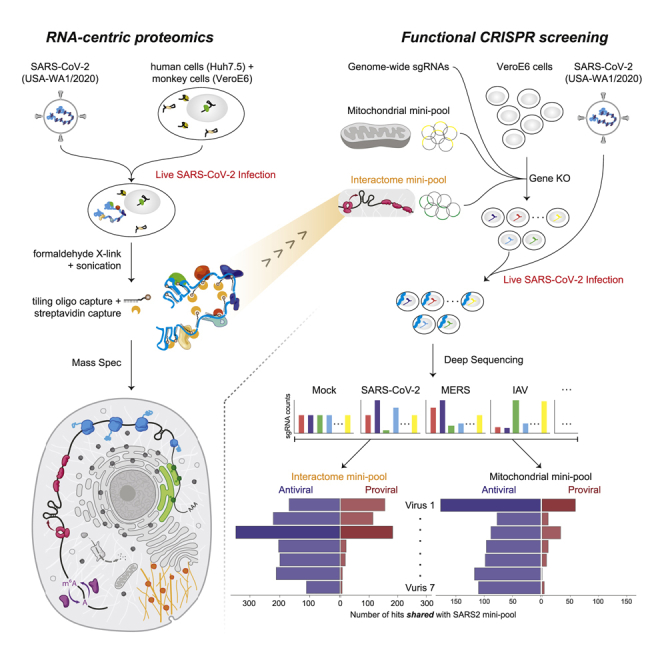
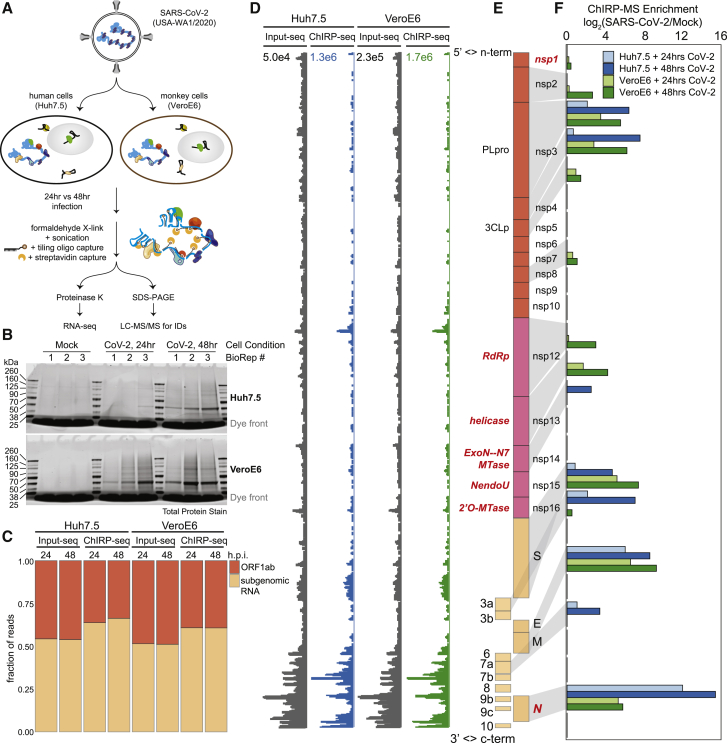
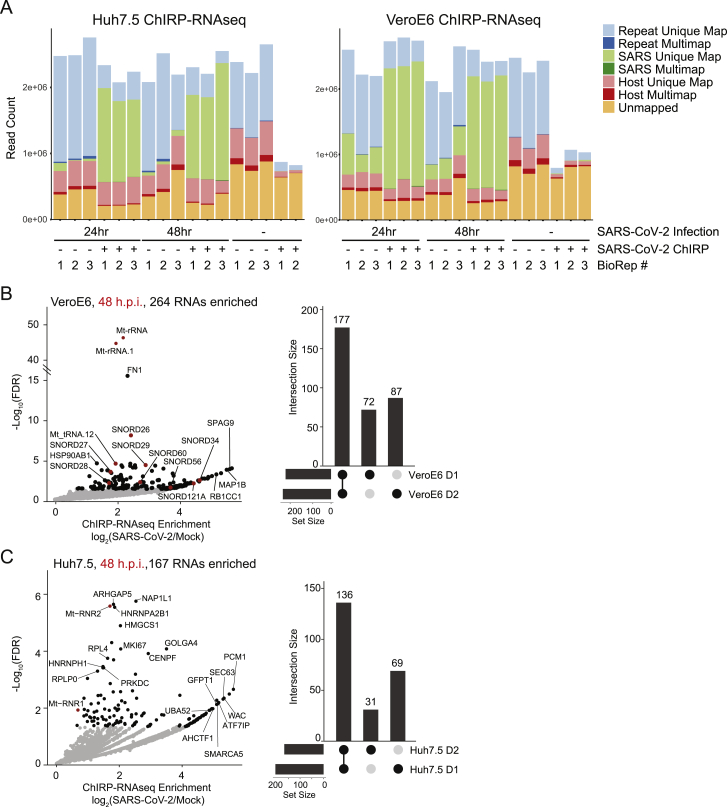
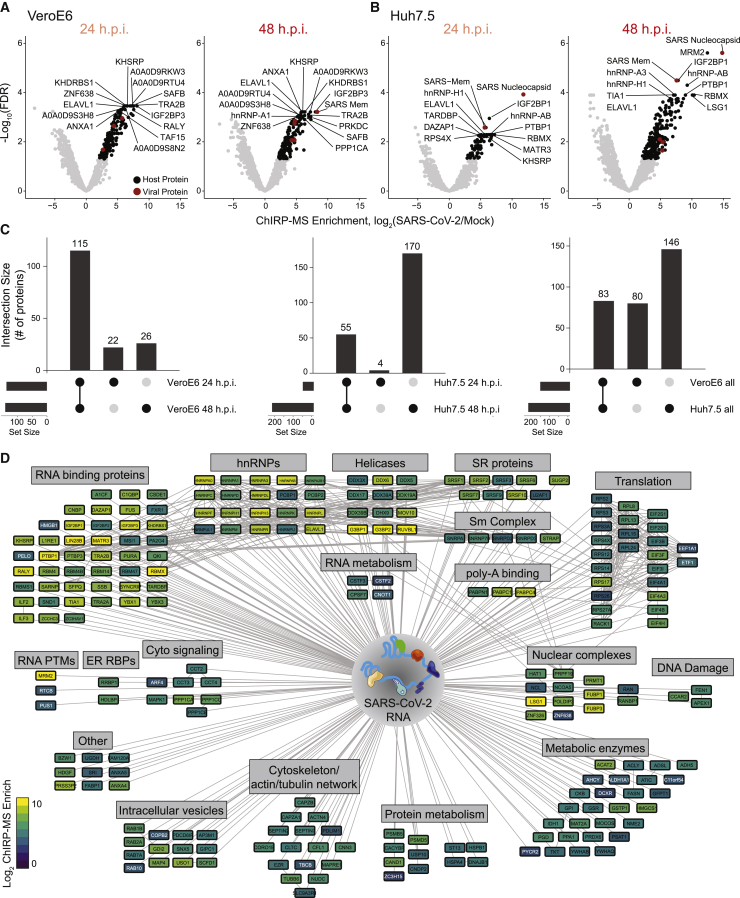
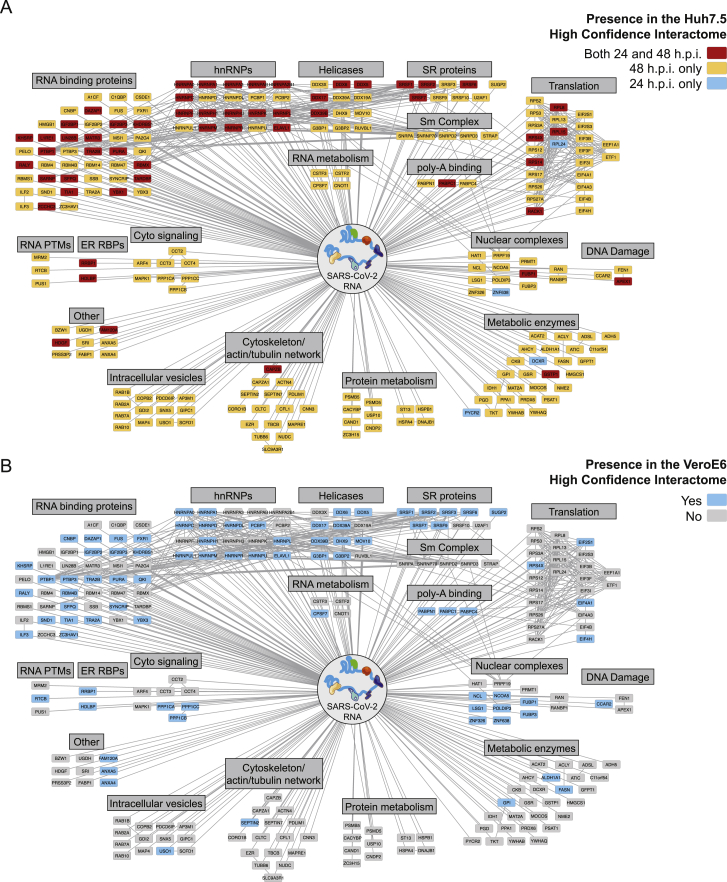
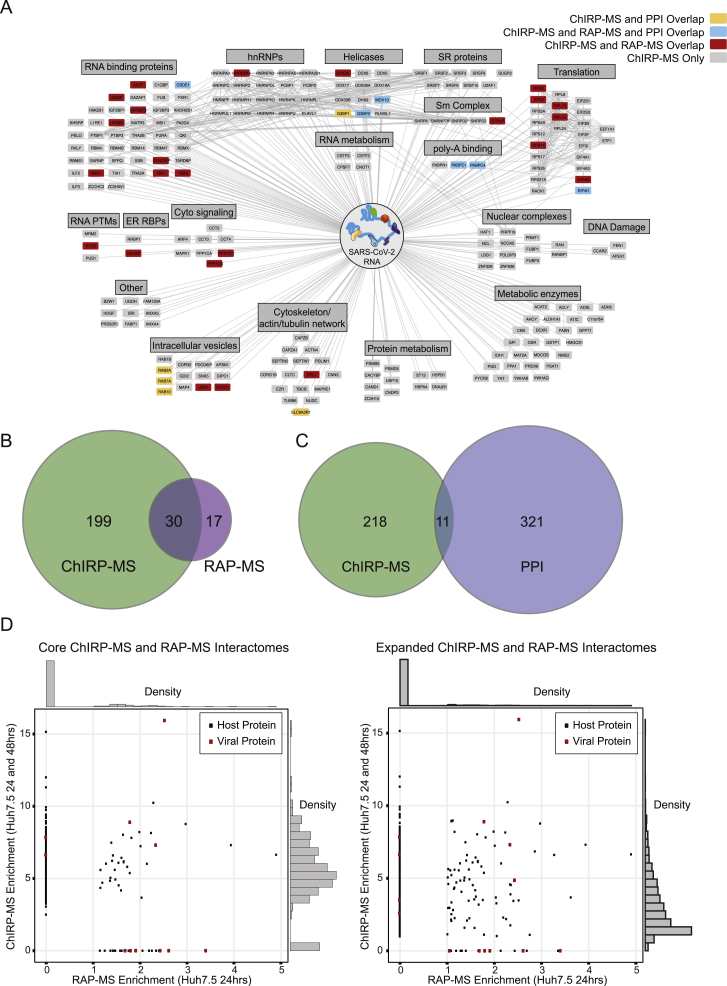
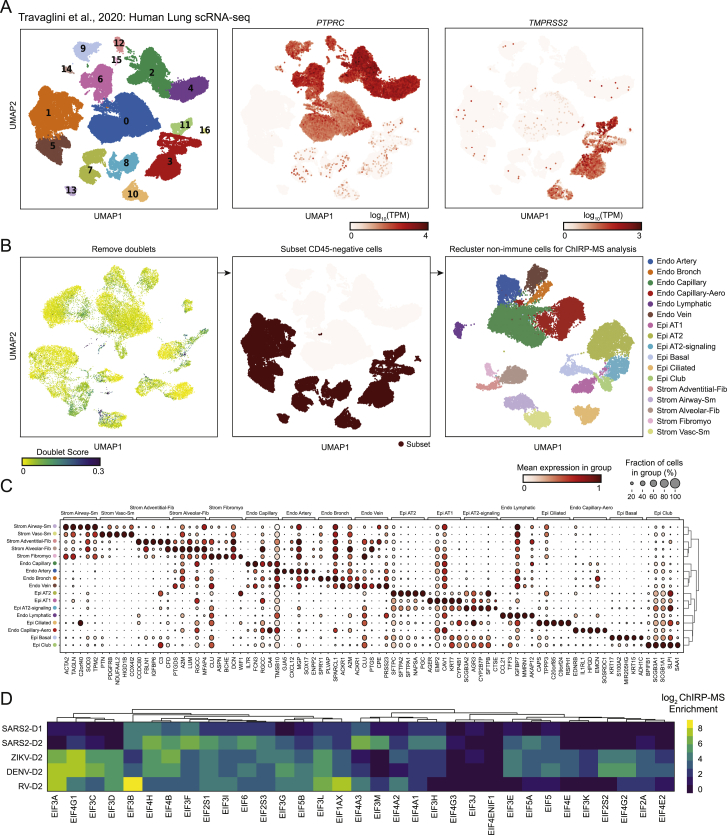
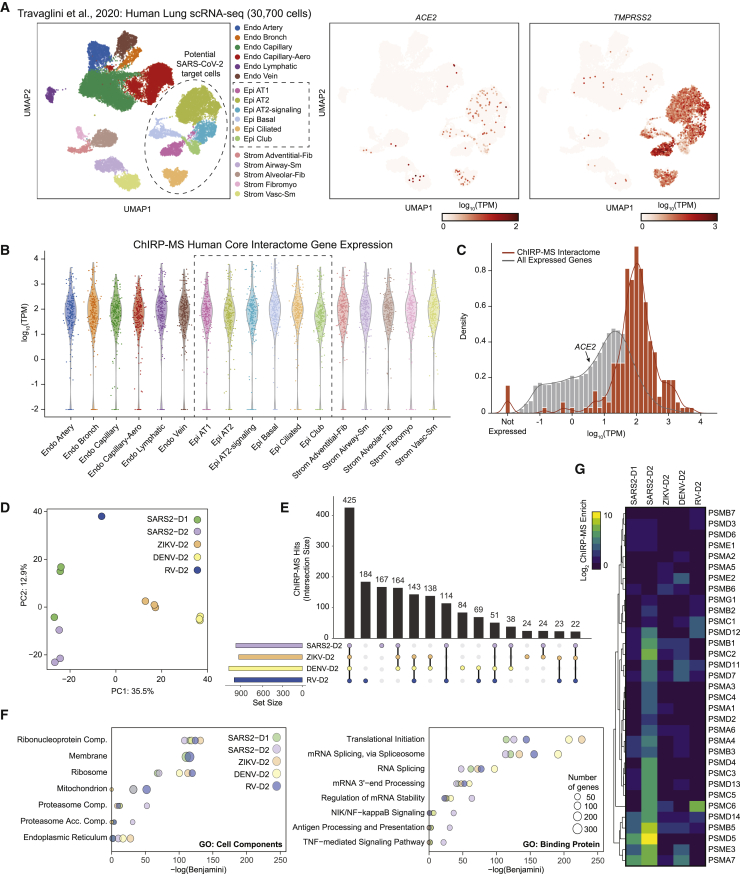
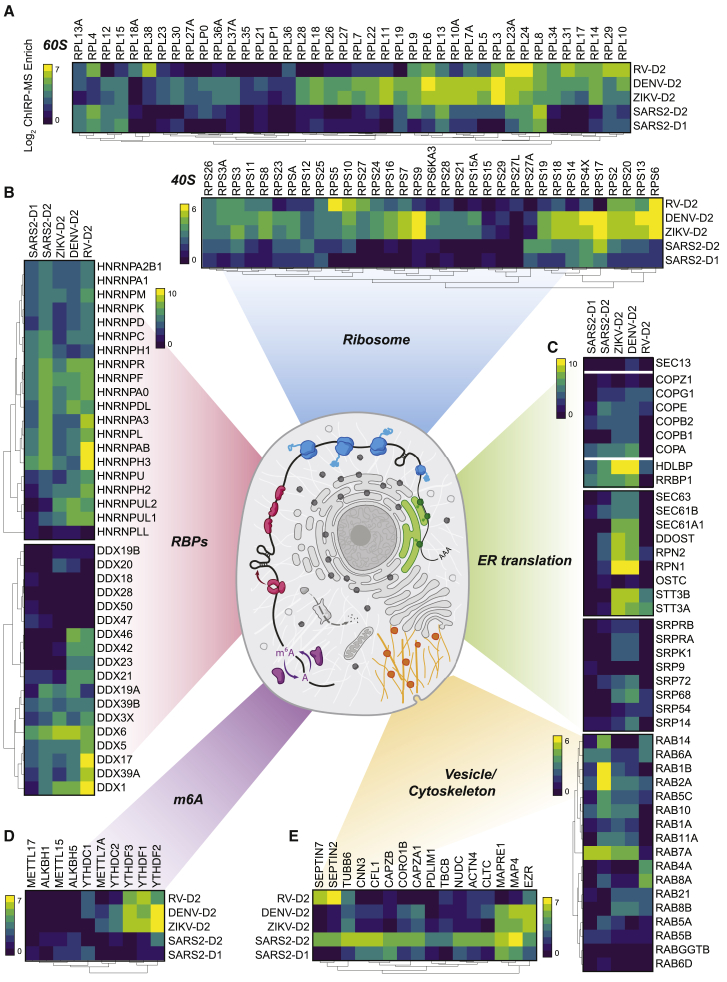
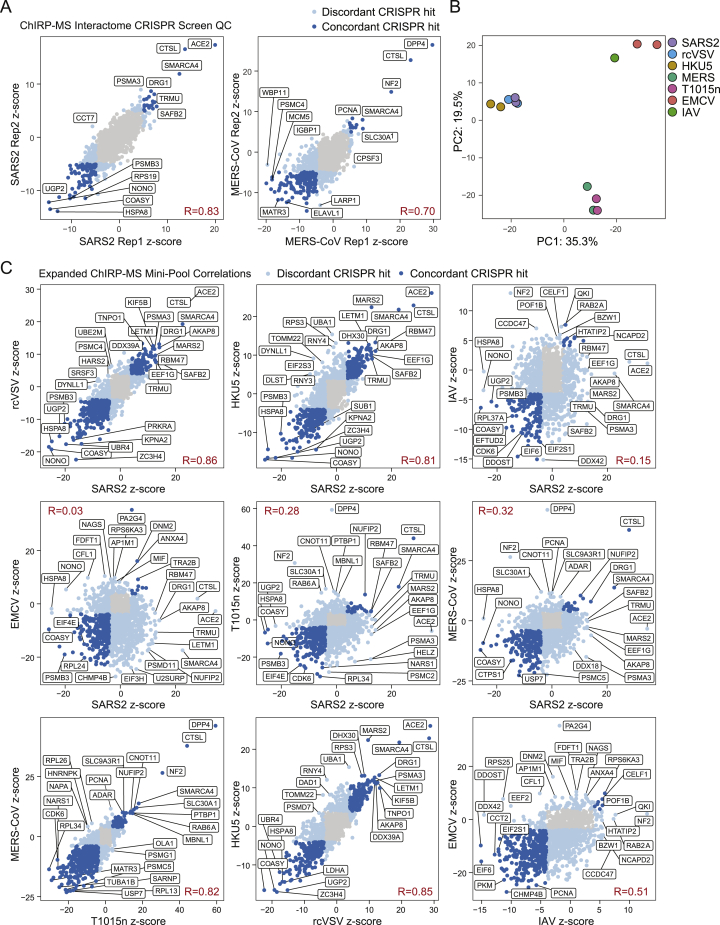
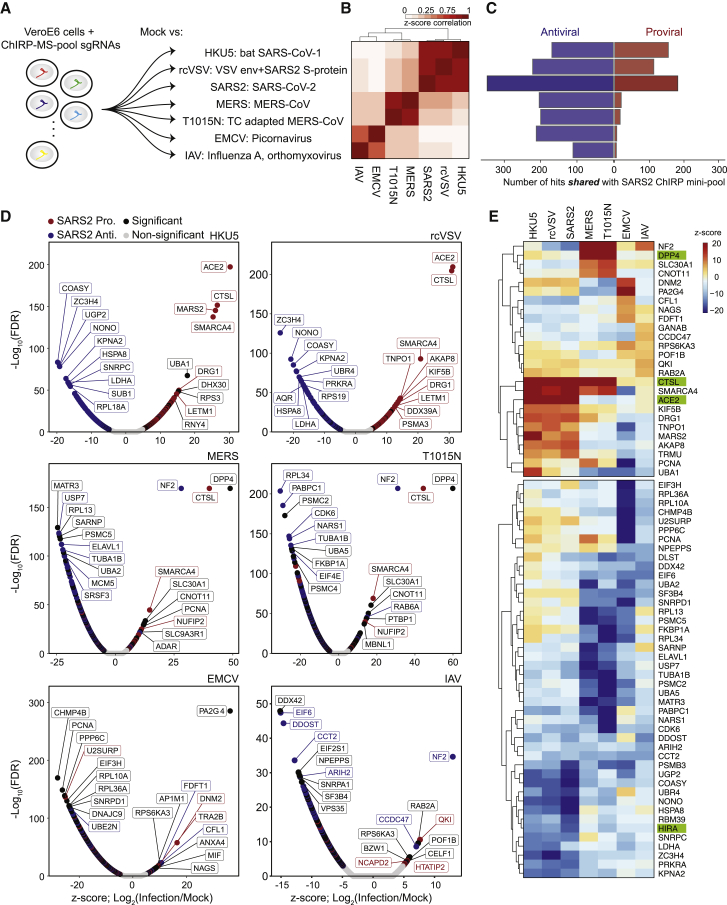
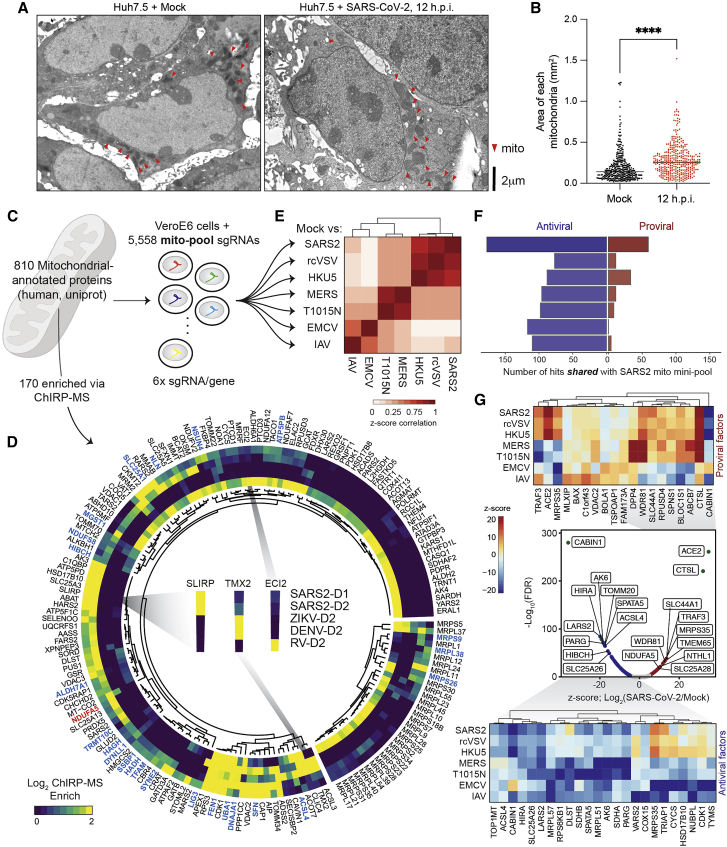
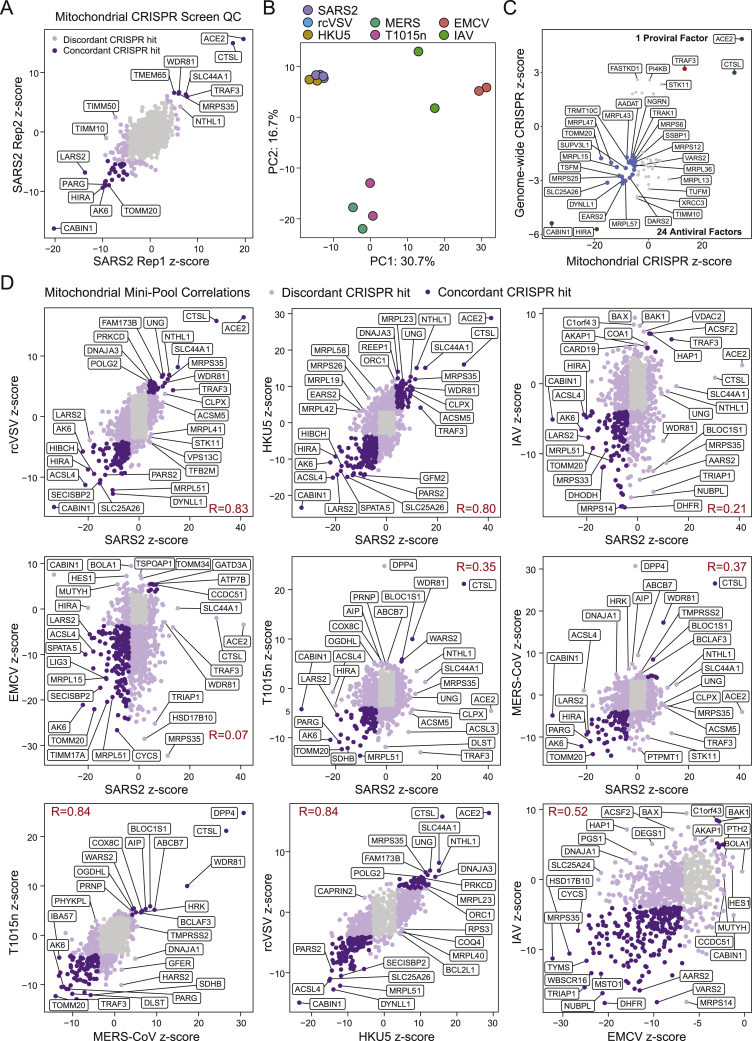
SARS-CoV-2 is the cause of a pandemic with growing global mortality. Using comprehensive identification of RNA-binding proteins by mass spectrometry (ChIRP-MS), we identified 309 host proteins that bind the SARS-CoV-2 RNA during active infection. Integration of this data with ChIRP-MS data from three other RNA viruses defined viral specificity of RNA-host protein interactions. Targeted CRISPR screens revealed that the majority of functional RNA-binding proteins protect the host from virus-induced cell death, and comparative CRISPR screens across seven RNA viruses revealed shared and SARS-specific antiviral factors. Finally, by combining the RNA-centric approach and functional CRISPR screens, we demonstrated a physical and functional connection between SARS-CoV-2 and mitochondria, highlighting this organelle as a general platform for antiviral activity. Altogether, these data provide a comprehensive catalog of functional SARS-CoV-2 RNA-host protein interactions, which may inform studies to understand the host-virus interface and nominate host pathways that could be targeted for therapeutic benefit.

Keywords: CRISPR; ChIRP-MS; RNA virus; RNA-binding proteins; SARS-CoV-2; host-pathogen interactions; mitochondria.


Conflict of interest statement

Declaration of interests A.T.S. is a scientific co-founder of Immunai and receives research funding from Arsenal Biosciences and 10x Genomics. K.R.P., H.Y.C., and A.T.S. are co-founders of Cartography Biosciences. H.Y.C. is a co-founder of Accent Therapeutics, Boundless Bio, and an advisor for 10x Genomics, Arsenal Biosciences, and Spring Discovery. Yale University (C.B.W.) has a patent pending related to this work entitled: “Compounds and Compositions for Treating, Ameliorating, and/or Preventing SARS-CoV-2 Infection and/or Complications Thereof.” Yale University has committed to rapidly executable non-exclusive royalty-free licenses to intellectual property rights for the purpose of making and distributing products to prevent, diagnose, and treat COVID-19 infection during the pandemic and for a short period thereafter.

Figures

None
Graphical abstract
Figure 1
Figure 1
ChIRP-MS identifies host and viral proteins associated with the SARS-CoV-2 RNA genome in infected cells (A) Schematic of the ChIRP-MS protocol. (B) SDS-PAGE analysis of total protein samples enriched using SARS-CoV-2 targeting biotinylated oligonucleotides from mock (uninfected) cells or cells infected for 24 or 48 h with SARS-CoV-2. (C) Quantification of the percentage of reads mapping to SARS-CoV-2 gRNA (ORF1a/b) versus the subgenomic RNA before and after pull-down. (D) RNA-seq coverage of the SARS-CoV-2 genome before and after pull-down. (E) Structure of the SARS-CoV-2 genome. (F) ChIRP-MS enrichment of each viral protein in Huh7.5 and Vero E6 cells at the indicated time points.
Figure S1
Figure S1
SARS-CoV-2 ChIRP-RNA-seq in Huh7.5 and Vero E6 cells, related to Figure 1 (A) Host and viral RNA-seq alignment statistics for all samples across Huh7.5 (left) and VeroE6 (right) cell lines. (B) Enriched host RNAs after viral RNA pulldown in VeroE6 cell line 48 h.p.i. (left) and conservation across time points (right). (C) Enriched host RNAs after viral RNA pulldown in Huh7.5 cell line 48 h.p.i. (left) and comparison across time points (right).
Figure 2
Figure 2
Changes in the SARS-CoV-2-associated proteome across time points and cell lines (A and B) ChIRP-MS results in Vero E6 (A) or Huh7.5 (B) cells after viral RNA pull-down at 24 and 48 h.p.i. Significantly enriched proteins indicated in black (host proteins) or red (viral proteins). (C) Conservation of enriched proteins between time points (left, middle) and cell lines (right). (D) Cytoscape network representation of the SARS-CoV-2-associated human proteome. Colors indicate ChIRP enrichment in Huh7.5 cells 48 h.p.i.
Figure S2
Figure S2
SARS-CoV-2 ChIRP-MS across infection times and between cell types, related to Figure 2 (A) High-confidence SARS-CoV-2 human interactome network colored by time point (24 h.p.i., 48 h.p.i., or both). (B) High-confidence SARS-CoV-2 human interactome network colored by cell line conservation.
Figure S3
Figure S3
Comparison of SARS-CoV-2 ChIRP-MS to other RNA- and protein-centric views of the viral interactome in human cells, related to Figure 3 (A) Comparison of the high-confidence SARS-CoV-2 RNA associated human proteome obtained by RAP-MS (UV crosslinking; (Schmidt et al., 2021)) to that by formaldehyde crosslinking (ChIRP-MS; this study) and comparison of the SARS-CoV-2 RNA associated proteome to the SARS-CoV-2 protein associated proteome (PPI; (Gordon et al., 2020)). (B) Overlap of human high-confidence interactomes obtained by RAP-MS or ChIRP-MS. (C) Overlap of PPI and ChIRP-MS interactomes. (D) Left: enrichment correlation of the human high-confidence interactomes obtained by RAP-MS or ChIRP-MS (FDR ≤ 0.05). Right: enrichment correlation of the human expanded interactomes obtained by RAP-MS or ChIRP-MS (average enrichment > = 1).
Figure S4
Figure S4
Re-analysis of single-cell RNA-seq analysis of human lung tissue, related to Figure 4 (A) Louvain clustering of all cells in the human lung scRNA-seq dataset are shown, alongside the expression of PTPRC (CD45) and TMPRSS2. (B) For the final filtered dataset, putative doublets (doublet score > 0.15) were removed, and the subset of CD45-negative cells was identified. The resulting data was re-clustered and the cluster labels are shown. (C) Representative marker genes for each cluster. (D) Multi-viral comparison of associations with translation initiation (EIF) factors.
Figure 3
Figure 3
Expression of the SARS-CoV-2 RNA-associated proteome across lung cell types and comparison to other RNA virus-associated proteomes (A) Clustering and dimensionality reduction and gene expression of non-immune single-cell RNA-seq profiles from primary human lung tissue. (B) Expression in single cells of the SARS-CoV-2 human core interactome. SARS-CoV-2 target clusters indicated with a box. Each dot represents the mean expression of a given gene in the core ChIRP-MS interactome across all cells in the indicated cluster. (C) Histogram of expression of each gene in the core ChIRP-MS interactome (orange) compared with all other genes (gray) in the lung epithelial ciliated cell cluster. (D) Principal component analysis of ChIRP enrichments in human cells across time points and viruses. (E) Upset plot comparing expanded interactomes of each virus. (F) GO term analysis of the expanded interactome of each virus. (G) Comparison of proteasome subunits and proteasome accessory factor associations across viruses.
Figure 4
Figure 4
Cellular context of expanded interactomes across viruses Selected groups of proteins; their enrichment in SARS-CoV-2, ZIKV, DENV, and RV ChIRP-MS; and their approximate subcellular localization or categorization in the ribosome (A), classical RBPs and RNA helicases (B), ER and ER-targeting factors (C), RNA post-transcriptional modification factors including m6A family proteins (D), and cytoskeleton and cellular vesicle factors (E). Heatmap colors indicate the log2 of ChIRP-MS enrichment values. Each heatmap has a separate scale bar.
Figure 5
Figure 5
Integration of ChIRP-MS and genome-wide and targeted interactome CRISPR screens identify pro- and antiviral host factors (A) CRISPR screen schematic for genome-wide and targeted interactome screens. (B) Expanded SARS-CoV-2 interactome overlaid on genome-wide CRISPR screen data. (C) Comparison of sgRNA residuals for significant hits (FDR ≤ 0.05) of all sgRNAs (left, black, n = 3,189), sgRNAs targeting genes present in the high-confidence SARS-CoV-2 RNA interactome (purple, middle, n = 132), or sgRNAs targeting genes present in the expanded SARS-CoV-2 RNA interactome (right, blue, n = 400). p values computed from Mann-Whitney test. (D) Focused interactome screening results for the high-confidence interactome (left) and the rest of the expanded interactome (right). (E) Expanded interactome mini-pool results for hits identified in the genome-wide screen, showing proviral hits (red), antiviral hits (blue), or positive controls (green). (F) Cytoscape network colored by enrichment or depletion in CRISPR screen. (G) sgRNA Z scores for top mini-pool CRISPR hits. Individual CRISPR guides are represented by black lines. The average of these is shown in red. (H) Inter-virus ChIRP-MS comparison of human ChIRP-MS/CRISPR hits identified in (E).
Figure S5
Figure S5
Correlation analysis of expanded interactome CRISPR mini-pool screens, related to Figure 5 (A) Replicate correlations for SARS-CoV-2 (left) and MERS (right) expanded interactome CRISPR mini-pool screens. (B) Principal component analysis of gene-level z-scores for all expanded interactome CRISPR mini-pool screen conditions and replicates. (C) Pairwise correlations of selected pairs of conditions.
Figure 6
Figure 6
SARS-CoV-2 ChIRP-MS interactome CRISPR screen in a panel of seven RNA viruses (A) CRISPR screen schematic. (B) Correlation of gene Z scores for each condition. (C) Number of proviral and antiviral hits (FDR ≤ 0.001) overlapping with the SARS-CoV-2 hits (FDR ≤ 0.001) for all conditions. (D) Volcano plot for each condition. (E) CRISPR Z scores for top hits for each virus. Top: proviral hits. Bottom: antiviral hits. Positive controls indicated in green.
Figure S6
Figure S6
ChIRP-MS and electron microscopy analysis of mitochondria during SARS-CoV-2 infection, related to Figure 6 (A) ChIRP-MS enrichment of rRNA 2’-O-ribose methyltransferases across viruses. (B) Identification of SARS-CoV-2 virions (highlighted with orange arrow heads) in the 12 h.p.i. EM images, taken from the same samples as in Figure 6 at different imaging depths. (C) EM imaging of SARS-CoV-2 infected Huh7.5 cells at 24 and 48 h.p.i. Mitochondria are highlighted with red arrow heads. (D) EM analysis of mitochondria in human bronchial epithelial cells (HBECs). Mitochondria are highlighted with red arrow heads. (D) Quantification of (C), n = 190 mitochondria in five infected or mock ciliated cells. P ≤ 0.001 by two-tailed Student’s t test.
Figure 7
Figure 7
SARS-CoV-2-associated proteins and a targeted mitochondrial CRISPR screen identify functional interactions between SARS-CoV-2 and host mitochondria. (A) Electron microscopy (EM) of Huh7.5 cells uninfected (left, mock) or infected by SARS-CoV-2 (right). (B) Quantification of mitochondria size by EM in infected cells. n = 348 and n = 361 mitochondria from 15 (mock) and 12 (12 h.p.i.) Huh 7.5 cells were analyzed. p ≤ 0.0001 by two-tailed Student’s t test. (C) Mini-pool CRISPR screen design. (D) ChIRP-MS enrichments of mitochondrial proteins present in the expanded interactome of at least one virus. The larger segment of the circle corresponds to proteins encoded by the mitochondrial genome or proteins encoded by the nuclear genome which are localized or associated with the mitochondria. Components of the mitochondrial ribosome are shown on the smaller segment. Proteins that are significant hits in the CRISPR screen data in Figure 5 are indicated with red labels (proviral hits) or blue labels (antiviral hits). (E) Correlation of gene Z scores for each condition. (F) Number of proviral and antiviral hits (FDR ≤ 0.001) overlapping with the SARS-CoV-2 hits (FDR ≤ 0.001) for all conditions. (G) Center: volcano plot for SARS-CoV-2 condition. Significant hits (FDR ≤ 0.001) indicated in black. Top: CRISPR Z scores for top proviral hits. Bottom: CRISPR Z scores for top antiviral hits.
Figure S7
Figure S7
Correlation analysis of mitochondria CRISPR mini-pool screens, related to Figure 7 (A) Replicate correlations for SARS-CoV-2 mitochondria mini-pool CRISPR screens. (B) Principal component analysis of gene-level z-scores for all mitochondria mini-pool screen conditions. (C) Mitochondria mini-pool CRISPR screen results for hits identified in the genome-wide screen. Red dots indicate proviral hits in both screens, blue dots indicate antiviral hits in both screens, and green dots indicate positive controls. (D) Pairwise correlations of selected pairs of conditions.

Update of

Comment in

References

    1. Agnihothram S., Yount B.L., Jr., Donaldson E.F., Huynh J., Menachery V.D., Gralinski L.E., Graham R.L., Becker M.M., Tomar S., Scobey T.D. A Mouse Model for Betacoronavirus Subgroup 2c Using a Bat Coronavirus Strain HKU5 Variant. mBio. 2014;5 e00047–14. - PMC - PubMed
    1. Ahlquist P. Parallels among positive-strand RNA viruses, reverse-transcribing viruses and double-stranded RNA viruses. Nat. Rev. Microbiol. 2006;4:371–382. - PMC - PubMed
    1. Baggen J., Thibaut H.J., Hurdiss D.L., Wahedi M., Marceau C.D., van Vliet A.L.W., Carette J.E., van Kuppeveld F.J.M. Identification of the Cell-Surface Protease ADAM9 as an Entry Factor for Encephalomyocarditis Virus. MBio. 2019;10:e01780-19. - PMC - PubMed
    1. Banerjee A.K., Blanco M.R., Bruce E.A., Honson D.D., Chen L.M., Chow A., Bhat P., Ollikainen N., Quinodoz S.A., Loney C. SARS-CoV-2 Disrupts Splicing, Translation, and Protein Trafficking to Suppress Host Defenses. Cell. 2020;183:1325–1339.e21. - PMC - PubMed
    1. Bazzone L.E., King M., MacKay C.R., Kyawe P.P., Meraner P., Lindstrom D., Rojas-Quintero J., Owen C.A., Wang J.P., Brass A.L. A Disintegrin and Metalloproteinase 9 Domain (ADAM9) Is a Major Susceptibility Factor in the Early Stages of Encephalomyocarditis Virus Infection. MBio. 2019;10:e02734-18. - PMC - PubMed

Publication types