

Trends in urinary metabolites of polycyclic aromatic hydrocarbons (PAHs) in the non-smoking U.S. population, NHANES 2001-2014
- PMID: 33743418
- PMCID: PMC8172479
- DOI: 10.1016/j.chemosphere.2021.130211
Trends in urinary metabolites of polycyclic aromatic hydrocarbons (PAHs) in the non-smoking U.S. population, NHANES 2001-2014
Abstract
Background: Recent studies indicate airborne PAH levels have decreased in the U.S., but it is unclear if this has resulted in PAH exposure changes in the U.S.
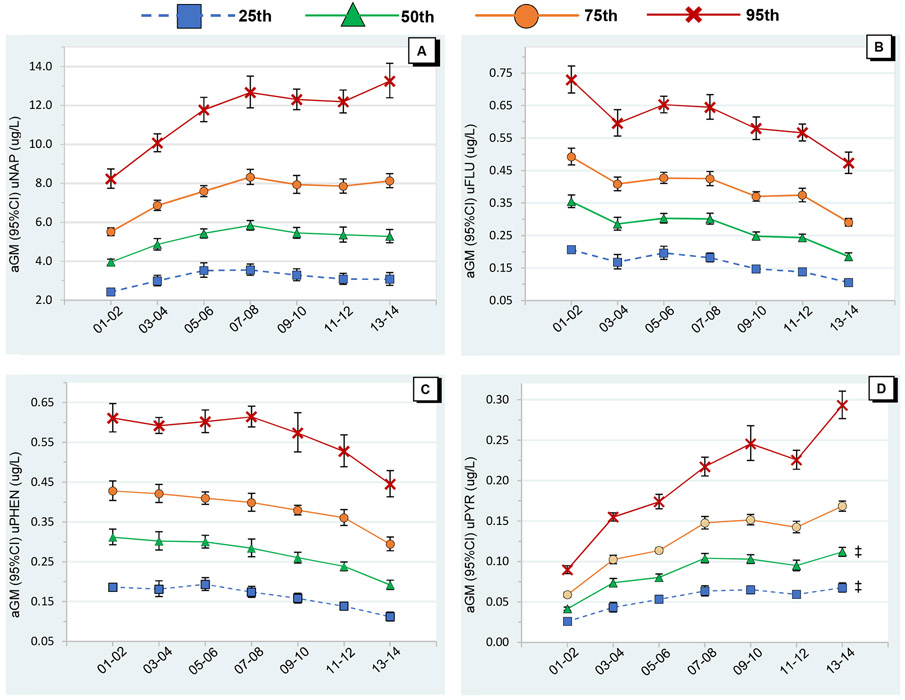
Objective: Examine temporal trends in urinary metabolites of Naphthalene, Fluorene, Phenanthrene, and Pyrene in U.S. non-smokers, 6+ years old.
Methods: We used biomonitoring data from the National Health and Nutrition Examination Survey (NHANES) program, 2001-2014, (N = 11,053) using survey weighted linear regression. Models were adjusted for age, sex, race/ethnicity, creatinine, BMI, income, diet, and seasonality. Stratified models evaluated the effect of age, sex, and race/ethnicity on trends.
Results: Between 2001 and 2014, Naphthalene exposure increased 36% (p < 0.01); Pyrene exposure increased 106% (p < 0.01); Fluorene and Phenanthrene exposure decreased 55% (p < 0.01), and 37% (p < 0.01), respectively. Naphthalene was the most abundant urinary PAH, 20-fold higher than Fluorene and Phenanthrene, and over 50-fold higher than Pyrene compared to reference groups, effect modification was observed by age (Naphthalene, Pyrene), sex (Fluorene, Pyrene), and race/ethnicity (Naphthalene, Fluorene, Phenanthrene, Pyrene).
Significance: This study shows exposure to Naphthalene and Pyrene increased, while exposure to Fluorene and Phenanthrene decreased among the non-smoking U.S. general population between 2001 and 2014, suggesting environmental sources of PAHs have changed over the time period.
Keywords: Air pollution; Human biomonitoring; NHANES; Naphthalene; PAHs; Pyrene.
Copyright © 2021 Elsevier Ltd. All rights reserved.
Conflict of interest statement
Declaration of Competing Interest
The authors declare that they have no conflicts of interest.
Figures


Similar articles
-
Urinary polycyclic aromatic hydrocarbon excretion and regional body fat distribution: evidence from the U.S. National Health and Nutrition Examination Survey 2001-2016.Environ Health. 2022 Aug 10;21(1):75. doi: 10.1186/s12940-022-00890-8. Environ Health. 2022. PMID: 35945606 Free PMC article.
-
Analysis of polycyclic aromatic hydrocarbon intake in the US adult population from NHANES 2005-2014 identifies vulnerable subpopulations, suggests interaction between tobacco smoke exposure and sociodemographic factors.Environ Res. 2021 Oct;201:111614. doi: 10.1016/j.envres.2021.111614. Epub 2021 Jul 1. Environ Res. 2021. PMID: 34216610 Free PMC article.
-
Polycyclic aromatic hydrocarbons (PAH) in urine of children and adolescents in Germany - human biomonitoring results of the German Environmental Survey 2014-2017 (GerES V).Int J Hyg Environ Health. 2020 May;226:113491. doi: 10.1016/j.ijheh.2020.113491. Epub 2020 Feb 21. Int J Hyg Environ Health. 2020. PMID: 32092491
-
Biomarkers for polycyclic aromatic hydrocarbons in human excreta: recent advances in analytical techniques-a review.Environ Geochem Health. 2023 Oct;45(10):7099-7113. doi: 10.1007/s10653-023-01699-1. Epub 2023 Aug 2. Environ Geochem Health. 2023. PMID: 37530922 Free PMC article. Review.
-
Porphyrinoid framework embedded with polycyclic aromatic hydrocarbons: new synthetic marvels.Org Biomol Chem. 2024 Mar 6;22(10):1932-1960. doi: 10.1039/d3ob02116e. Org Biomol Chem. 2024. PMID: 38376865 Review.
Cited by
-
Urinary polycyclic aromatic hydrocarbon metabolites and mortality in the United States: A prospective analysis.PLoS One. 2021 Jun 4;16(6):e0252719. doi: 10.1371/journal.pone.0252719. eCollection 2021. PLoS One. 2021. PMID: 34086784 Free PMC article.
-
Characterizing Chemical Exposure Trends from NHANES Urinary Biomonitoring Data.Environ Health Perspect. 2024 Jan;132(1):17009. doi: 10.1289/EHP12188. Epub 2024 Jan 29. Environ Health Perspect. 2024. PMID: 38285237 Free PMC article.
-
Prenatal polycyclic aromatic hydrocarbon (PAH) exposure in relation to placental corticotropin releasing hormone (pCRH) in the CANDLE pregnancy cohort.Front Endocrinol (Lausanne). 2022 Nov 11;13:1011689. doi: 10.3389/fendo.2022.1011689. eCollection 2022. Front Endocrinol (Lausanne). 2022. PMID: 36440232 Free PMC article.
-
Urinary polycyclic aromatic hydrocarbon excretion and regional body fat distribution: evidence from the U.S. National Health and Nutrition Examination Survey 2001-2016.Environ Health. 2022 Aug 10;21(1):75. doi: 10.1186/s12940-022-00890-8. Environ Health. 2022. PMID: 35945606 Free PMC article.
-
Predictors of urinary polycyclic aromatic hydrocarbon metabolites in girls from the San Francisco Bay Area.Environ Res. 2022 Apr 1;205:112534. doi: 10.1016/j.envres.2021.112534. Epub 2021 Dec 10. Environ Res. 2022. PMID: 34896321 Free PMC article.
References
-
- ATSDR. Toxicological profile for polycyclic aromatic hydrocarbons (PAHs). Atlanta, GA, USA: Agency for Toxic Substances and Disease Registry; 1995. p. 487. Report No.: 1995-639–298. - PubMed
-
- US EPA. Clean Air Act Amendments of 1990, Appendix B: Documentation of 7-PAH and 16-PAH National Emission Estimates. Research Triangle Park, NC: U.S. Environmental Protection Agency; 1998. p. 135.
-
- Grainger J, Huang W, Patterson DG, Turner WE, Pirkle J, Caudill SP, et al. Reference range levels of polycyclic aromatic hydrocarbons in the US population by measurement of urinary monohydroxy metabolites. Environ Res. 2006;100(3):394–423. - PubMed
MeSH terms
Substances
Grants and funding
LinkOut - more resources
Full Text Sources
Other Literature Sources
