. 2021 May:138:109650.
doi: 10.1016/j.ejrad.2021.109650. Epub 2021 Mar 11.

Correlation between lung ultrasound and chest CT patterns with estimation of pulmonary burden in COVID-19 patients

Affiliations

Correlation between lung ultrasound and chest CT patterns with estimation of pulmonary burden in COVID-19 patients

Francesco Rizzetto et al. Eur J Radiol. 2021 May.

Abstract

Purpose: The capability of lung ultrasound (LUS) to distinguish the different pulmonary patterns of COVID-19 and quantify the disease burden compared to chest CT is still unclear.

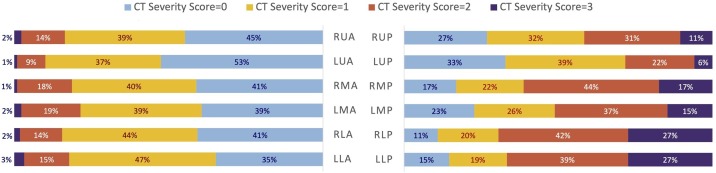
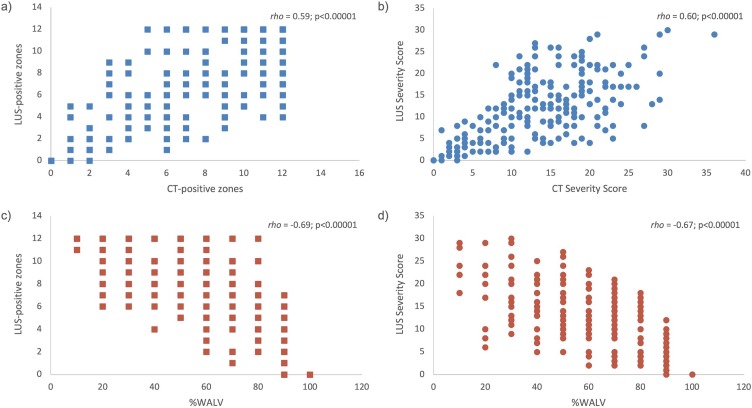
Methods: PCR-confirmed COVID-19 patients who underwent both LUS and chest CT at the Emergency Department were retrospectively analysed. In both modalities, twelve peripheral lung zones were identified and given a Severity Score basing on main lesion pattern. On CT scans the well-aerated lung volume (%WALV) was visually estimated. Per-patient and per-zone assessments of LUS classification performance taking CT findings as reference were performed, further revisioning the images in case of discordant results. Correlations between number of disease-positive lung zones, Severity Score and %WALV on both LUS and CT were assessed. The area under receiver operating characteristic curve (AUC) was calculated to determine LUS performance in detecting %WALV ≤ 70 %.

Results: The study included 219 COVID-19 patients with abnormal chest CT. LUS correctly identified as positive 217 (99 %) patients, but per-zone analysis showed sensitivity = 75 % and specificity = 66 %. The revision of the 121 (55 %) cases with positive LUS and negative CT revealed COVID-compatible lesions in 42 (38 %) CT scans. Number of disease-positive zones, Severity Score and %WALV between LUS and CT showed moderate correlations. The AUCs for LUS Severity Score and number of LUS-positive zones did not differ in detecting %WALV ≤ 70 %.

Conclusion: LUS in COVID-19 is valuable for case identification but shows only moderate correlation with CT findings as for lesion patterns and severity quantification. The number of disease-positive lung zones in LUS alone was sufficient to discriminate relevant disease burden.

Keywords: COVID-19; Diagnostic techniques and procedures; Lung; Tomography; Ultrasonography; X-Ray computed.


Conflict of interest statement

The authors of this manuscript declare no relationships with any companies, whose products or services may be related to the subject matter of the article.

Figures

Fig. 1
Fig. 1
Examples of CT patterns: a) normal pulmonary parenchyma (Severity Score = 0) in the anterior and posterior zones of the right lung, while GGOs (Severity Score = 1) are visible in the anterior zone of the left lung; b) bilateral diffuse GGOs (Severity Score = 1); c) two examples of crazy paving pattern (Severity Score = 2), with predominant septal thickening on the left panel and in progression to consolidation on the right panel; d) two examples of consolidations (Severity Score = 3), localized to the posterior lung zone on the left panel and widely distributed on the right panel.
Fig. 2
Fig. 2
Example of lung ultrasound patterns in COVID-19: a) lines A (Severity Score = 0); b) separated lines B (Severity Score = 1); c) coalescent lines B (Severity Score = 2); d) consolidations (Severity Score = 3).
Fig. 3
Fig. 3
Distribution of the CT Severity Score values in the different zones of the lungs expressed as percentage of the total scores (n = 219) assigned to each zone. The lung zones were named after the following three-letter code: first letter: Right (R) or Left (L); second letter: Upper (U), Middle (M) or Lower (L); third letter: Anterior (A) or Posterior (P).
Fig. 4
Fig. 4
Sensitivity and specificity (95 % confidence interval in parentheses) of lung ultrasound for each of the 12 peripheral zones identified in the lungs. CT findings were used as reference. The p values adjusted after Bonferroni’s correction were reported, referring to the null hypothesis that there were no differences between different lung zones in terms of sensitivity and specificity. The lung zones were named after the following three-letter code: first letter: Right (R) or Left (L); second letter: Upper (U), Middle (M) or Lower (L); third letter: Anterior (A) or Posterior (P).
Fig. 5
Fig. 5
Examples from different patients of reviewed lung zones with discordant findings between lung ultrasound (Severity Score>0) and chest CT (Severity Score = 0): a) bilateral emphysema and interstitial fibrosis of the upper lung zones (non-COVID-19 lesions); b) a small round COVID-compatible opacity (arrow) is visible in the lower posterior zone of the right lung, despite confusable with the motion artifacts; c) a very low-contrast COVID-compatible opacity (arrows) is present in the upper posterior zone of the left lung, barely visible in the routine preset lung window (left panel) but more evident narrowing the window (right panel).
Fig. 6
Fig. 6
Correlation between number of CT-positive zones and number of LUS-positive score (a), CT Severity Score and LUS Severity Score (b), percentage of well-aerated lung volume (%WALV) and LUS-positive zones (c) and %WALV and LUS Severity Score (d). Spearman’s rho coefficient and p values are reported.
Fig. 7
Fig. 7
Receiver Operator Curves of lung ultrasound (LUS) Severity Score and number of LUS-positive zones for detecting COVID-19 patients with %WALV ≤ 70 %.

Similar articles

Cited by

References

    1. World Health Organization . 2020. Novel Coronavirus (2019-nCoV) Situation Report - 11.https://www.who.int/docs/default-source/coronaviruse/situation-reports/2... Geneva (Switzerland)
    1. World Health Organization . 2020. Coronavirus Disease 2019 (COVID-19) Situation Report – 51.https://www.who.int/docs/default-source/coronaviruse/situation-reports/2... Geneva (Switzerland)
    1. Kim H., Hong H., Yoon S.H. Diagnostic performance of CT and reverse transcriptase-polymerase chain reaction for coronavirus disease 2019: a meta-analysis. Radiology. 2020 doi: 10.1148/radiol.2020201343. - DOI - PMC - PubMed
    1. Kanne J.P., Little B.P., Chung J.H., Elicker B.M., Ketai L.H. Essentials for radiologists on COVID-19: an update— radiology scientific expert panel. Radiology. 2020;78 doi: 10.1148/radiol.2020200527. - DOI - PMC - PubMed
    1. Yang W., Sirajuddin A., Zhang X., Liu G., Teng Z., Zhao S., Lu M. The role of imaging in 2019 novel coronavirus pneumonia (COVID-19) Eur. Radiol. 2020;30:4874–4882. doi: 10.1007/s00330-020-06827-4. - DOI - PMC - PubMed