

Comparing low-pass sequencing and genotyping for trait mapping in pharmacogenetics
- PMID: 33743587
- PMCID: PMC7981957
- DOI: 10.1186/s12864-021-07508-2
Comparing low-pass sequencing and genotyping for trait mapping in pharmacogenetics
Abstract
Background: Low pass sequencing has been proposed as a cost-effective alternative to genotyping arrays to identify genetic variants that influence multifactorial traits in humans. For common diseases this typically has required both large sample sizes and comprehensive variant discovery. Genotyping arrays are also routinely used to perform pharmacogenetic (PGx) experiments where sample sizes are likely to be significantly smaller, but clinically relevant effect sizes likely to be larger.
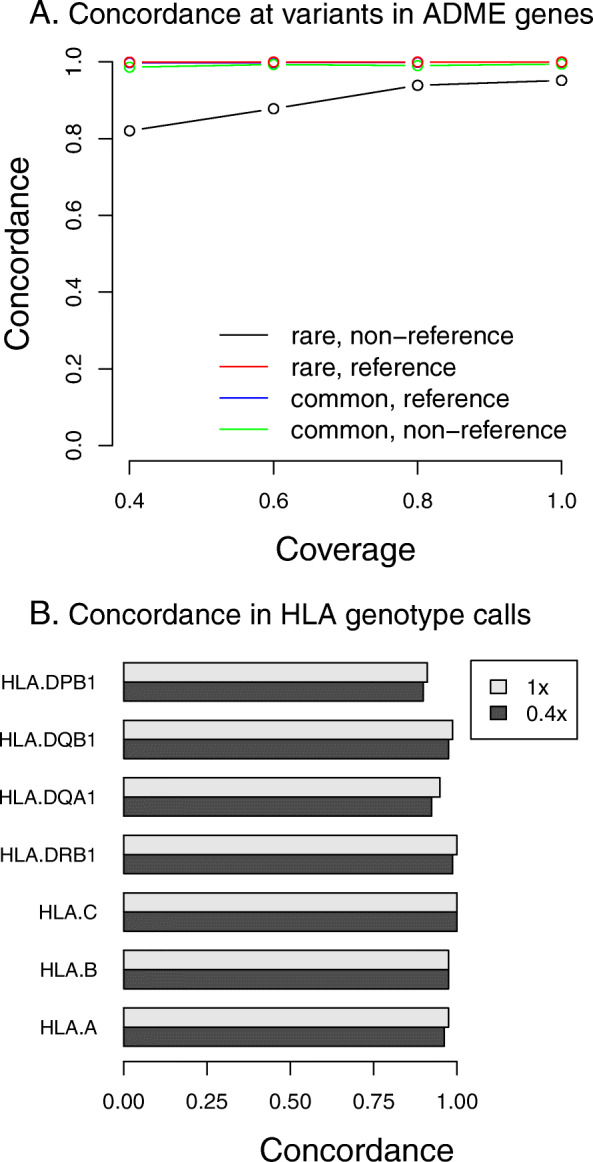
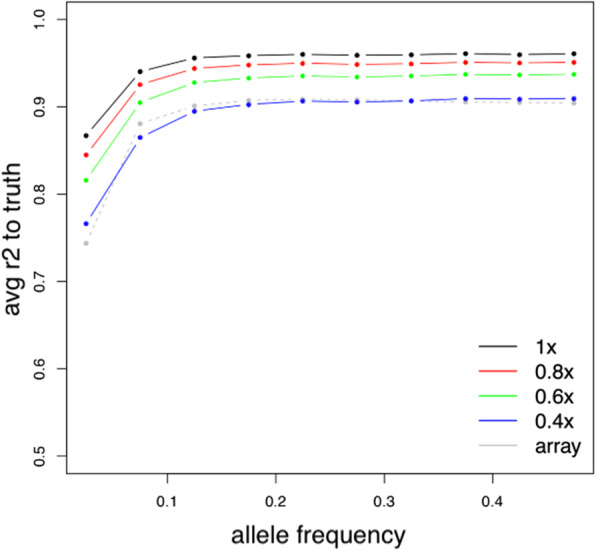
Results: To assess how low pass sequencing would compare to array based genotyping for PGx we compared a low-pass assay (in which 1x coverage or less of a target genome is sequenced) along with software for genotype imputation to standard approaches. We sequenced 79 individuals to 1x genome coverage and genotyped the same samples on the Affymetrix Axiom Biobank Precision Medicine Research Array (PMRA). We then down-sampled the sequencing data to 0.8x, 0.6x, and 0.4x coverage, and performed imputation. Both the genotype data and the sequencing data were further used to impute human leukocyte antigen (HLA) genotypes for all samples. We compared the sequencing data and the genotyping array data in terms of four metrics: overall concordance, concordance at single nucleotide polymorphisms in pharmacogenetics-related genes, concordance in imputed HLA genotypes, and imputation r2. Overall concordance between the two assays ranged from 98.2% (for 0.4x coverage sequencing) to 99.2% (for 1x coverage sequencing), with qualitatively similar numbers for the subsets of variants most important in pharmacogenetics. At common single nucleotide polymorphisms (SNPs), the mean imputation r2 from the genotyping array was 0.90, which was comparable to the imputation r2 from 0.4x coverage sequencing, while the mean imputation r2 from 1x sequencing data was 0.96.
Conclusions: These results indicate that low-pass sequencing to a depth above 0.4x coverage attains higher power for association studies when compared to the PMRA and should be considered as a competitive alternative to genotyping arrays for trait mapping in pharmacogenetics.
Keywords: Genotype imputation; Low-pass sequencing; Pharmacogenetics; Trait mapping.
Conflict of interest statement
K. W., T.B., J.K.P., and J.H.L were employees of Gencove, Inc. at the time of writing.
Figures
Similar articles
-
Accurate genotype imputation from low-coverage whole-genome sequencing data of rainbow trout.G3 (Bethesda). 2024 Sep 4;14(9):jkae168. doi: 10.1093/g3journal/jkae168. G3 (Bethesda). 2024. PMID: 39041837 Free PMC article.
-
Low-depth genotyping-by-sequencing (GBS) in a bovine population: strategies to maximize the selection of high quality genotypes and the accuracy of imputation.BMC Genet. 2017 Apr 5;18(1):32. doi: 10.1186/s12863-017-0501-y. BMC Genet. 2017. PMID: 28381212 Free PMC article.
-
A cautionary tale of low-pass sequencing and imputation with respect to haplotype accuracy.Genet Sel Evol. 2024 Jan 12;56(1):6. doi: 10.1186/s12711-024-00875-w. Genet Sel Evol. 2024. PMID: 38216889 Free PMC article.
-
Accurate Imputation of Untyped Variants from Deep Sequencing Data.Methods Mol Biol. 2021;2243:271-281. doi: 10.1007/978-1-0716-1103-6_13. Methods Mol Biol. 2021. PMID: 33606262 Review.
-
Genotype Imputation in Genome-Wide Association Studies.Curr Protoc Hum Genet. 2019 Jun;102(1):e84. doi: 10.1002/cphg.84. Curr Protoc Hum Genet. 2019. PMID: 31216114 Review.
Cited by
-
Low-pass sequencing increases the power of GWAS and decreases measurement error of polygenic risk scores compared to genotyping arrays.Genome Res. 2021 Apr;31(4):529-537. doi: 10.1101/gr.266486.120. Epub 2021 Feb 3. Genome Res. 2021. PMID: 33536225 Free PMC article.
-
Characterization of a haplotype-reference panel for genotyping by low-pass sequencing in Swiss Large White pigs.BMC Genomics. 2021 Apr 21;22(1):290. doi: 10.1186/s12864-021-07610-5. BMC Genomics. 2021. PMID: 33882824 Free PMC article.
-
Genotype imputation from low-coverage data for medical and population genetic analyses.Genome Res. 2025 Sep 2;35(9):1929-1941. doi: 10.1101/gr.280175.124. Genome Res. 2025. PMID: 40695596 Free PMC article.
-
Ancestry-inclusive dog genomics challenges popular breed stereotypes.Science. 2022 Apr 29;376(6592):eabk0639. doi: 10.1126/science.abk0639. Epub 2022 Apr 29. Science. 2022. PMID: 35482869 Free PMC article.
-
Cytogenetics analysis as the central point of genetic testing in acute myeloid leukemia (AML): a laboratory perspective for clinical applications.Clin Exp Med. 2023 Aug;23(4):1137-1159. doi: 10.1007/s10238-022-00913-1. Epub 2022 Oct 13. Clin Exp Med. 2023. PMID: 36229751 Review.
References
-
- Cai N, Li Y, Chang S, Liang J, Lin C, Zhang X, Liang L, Hu J, Chan W, Kendler KS, Malinauskas T, Huang GJ, Li Q, Mott R, Flint J, et al. Genetic control over mtDNA and its relationship to major depressive disorder. Curr Biol. 2015;25(24):3170–3177. doi: 10.1016/j.cub.2015.10.065. - DOI - PMC - PubMed
-
- Caldwell MD, Awad T, Johnson JA, Gage BF, Falkowski M, Gardina P, Hubbard J, Turpaz Y, Langaee TY, Eby C, King CR, Brower A, Schmelzer JR, Glurich I, Vidaillet HJ, Yale SH, Qi Zhang K, Berg RL, Burmester JK, et al. CYP4F2 genetic variant alters required warfarin dose. Blood. 2008;111(8):4106–4112. doi: 10.1182/blood-2007-11-122010. - DOI - PMC - PubMed
Publication types
MeSH terms
LinkOut - more resources
Full Text Sources
Other Literature Sources
Research Materials
