. 2021 Jan-Jun:296:100550.
doi: 10.1016/j.jbc.2021.100550. Epub 2021 Mar 18.

Retroviral prototype foamy virus intasome binding to a nucleosome target does not determine integration efficiency

Affiliations

Retroviral prototype foamy virus intasome binding to a nucleosome target does not determine integration efficiency

Randi M Kotlar et al. J Biol Chem. 2021 Jan-Jun.

Abstract

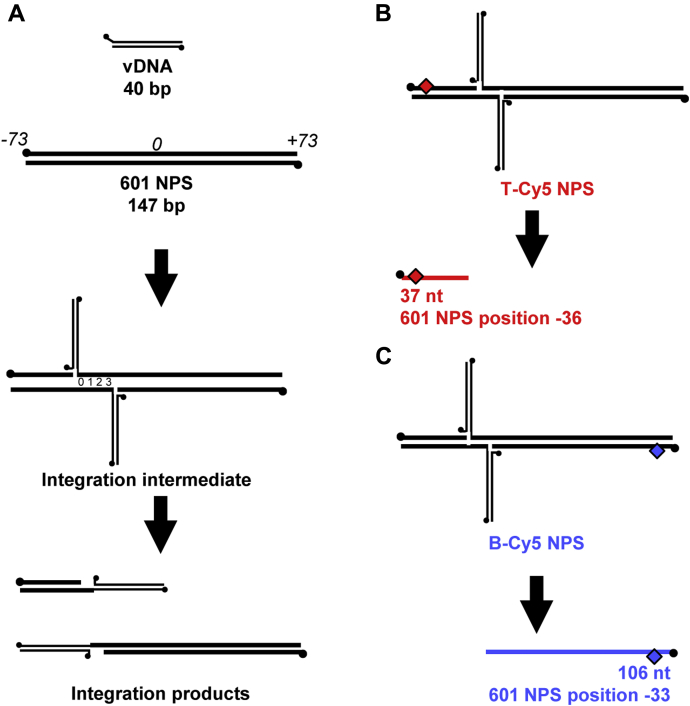
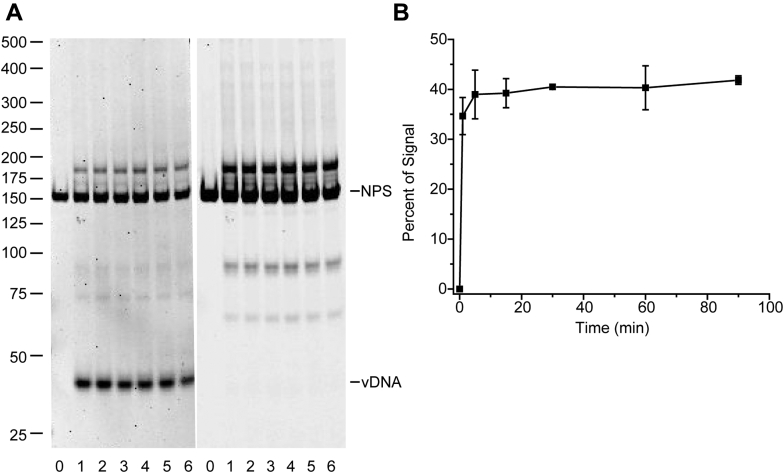
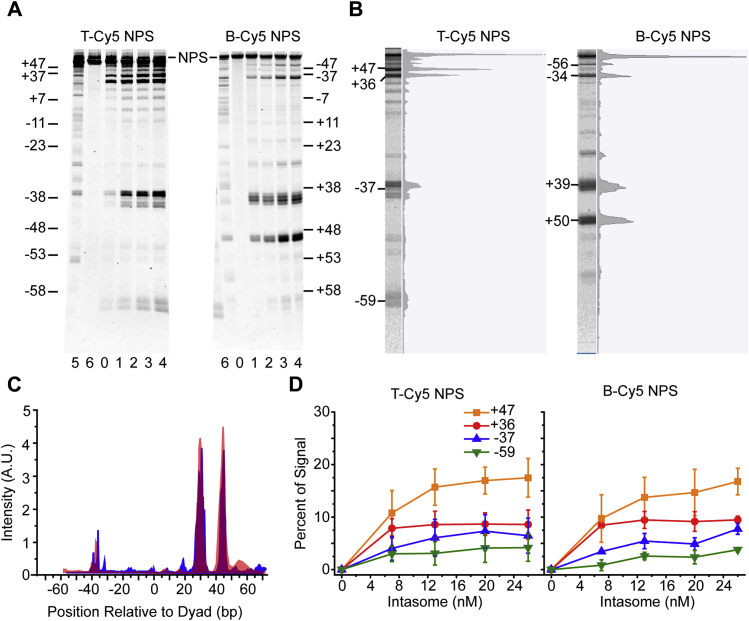
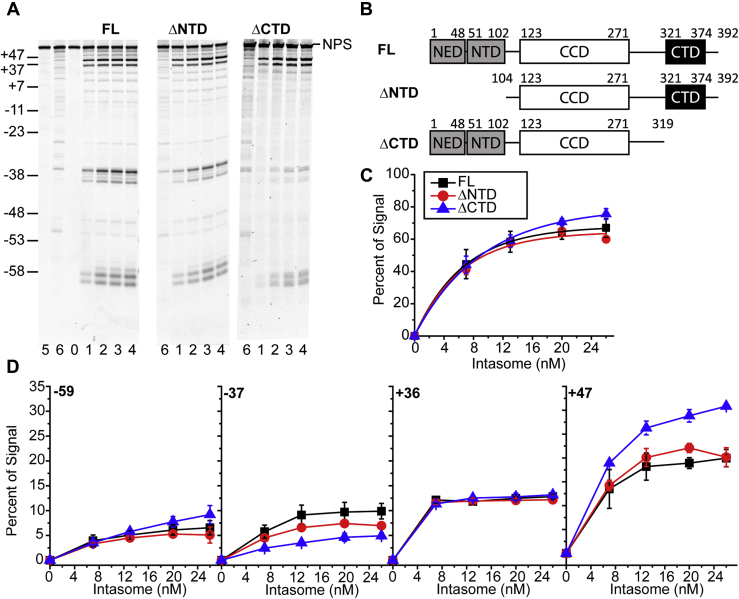
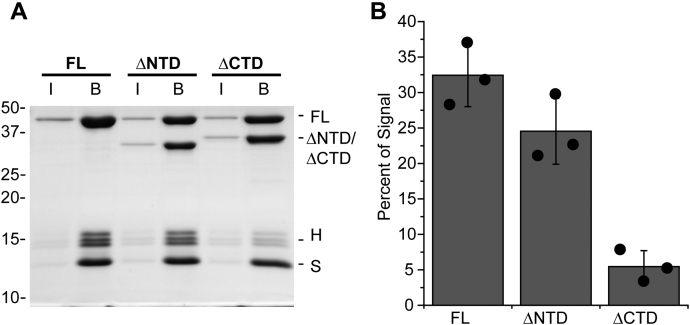
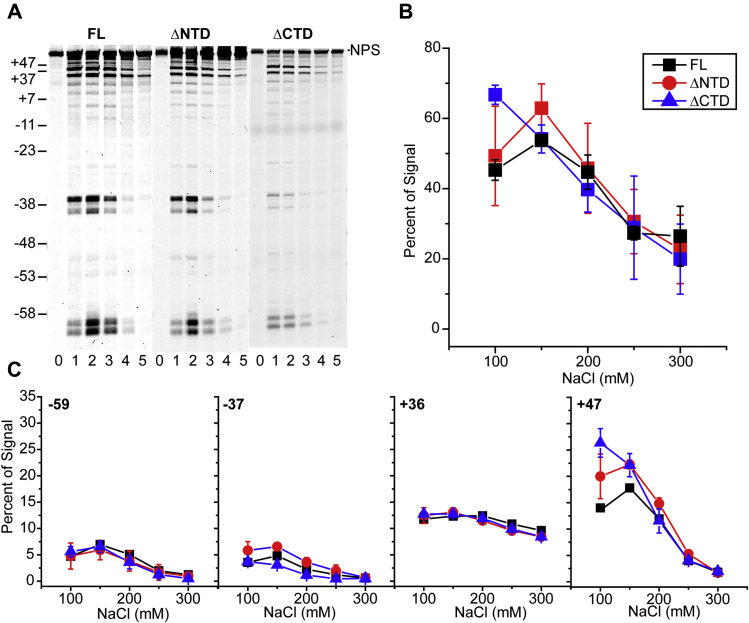
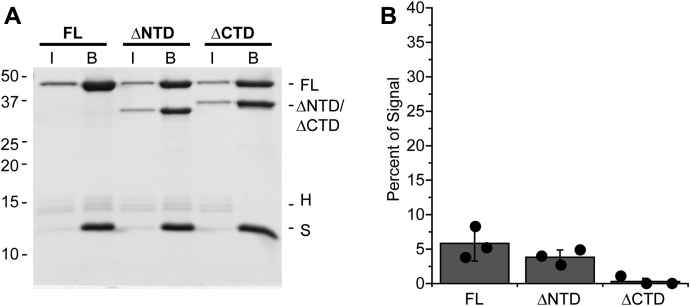
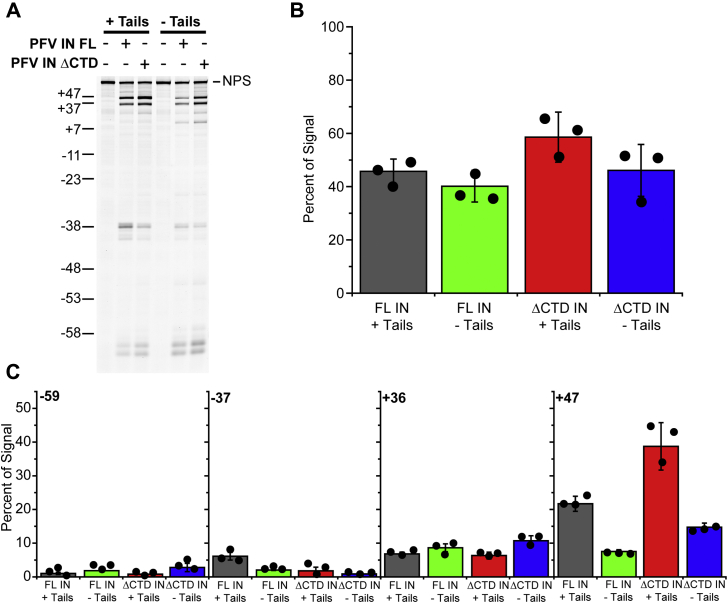
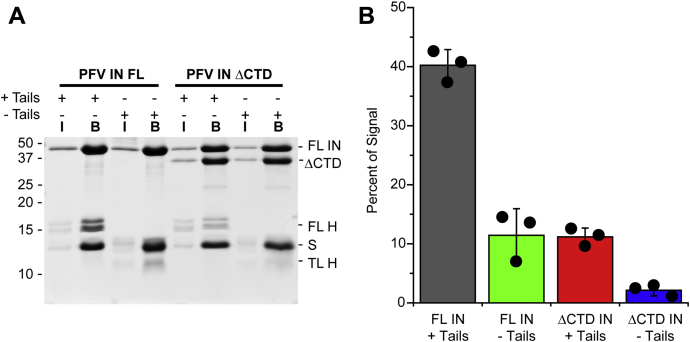
Retroviral integrases must navigate host DNA packaged as chromatin during integration of the viral genome. Prototype foamy virus (PFV) integrase (IN) forms a tetramer bound to two viral DNA (vDNA) ends in a complex termed an intasome. PFV IN consists of four domains: the amino terminal extension domain (NED), amino terminal domain (NTD), catalytic core domain (CCD), and carboxyl terminal domain (CTD). The domains of the two inner IN protomers have been visualized, as well as the CCDs of the two outer IN protomers. However, the roles of the amino and carboxyl terminal domains of the PFV intasome outer subunits during integration to a nucleosome target substrate are not clear. We used the well-characterized 601 nucleosome to assay integration activity as well as intasome binding. PFV intasome integration to 601 nucleosomes occurs in clusters at four independent sites. We find that the outer protomer NED and NTD domains have no significant effects on integration efficiency, site selection, or binding. The CTDs of the outer PFV intasome subunits dramatically affect nucleosome binding but have little effect on total integration efficiency. The outer PFV IN CTDs did significantly alter the integration efficiency at one site. Histone tails also significantly affect intasome binding, but have little impact on PFV integration efficiency or site selection. These results indicate that binding to nucleosomes does not correlate with integration efficiency and suggests most intasome-binding events are unproductive.

Keywords: enzyme catalysis; integration; nucleosome; protein–protein interaction; prototype foamy virus; retrovirus.


Conflict of interest statement

Conflict of interest The authors declare that they have no conflicts of interest with the contents of this article.

Figures

Figure 1
Figure 1
PFV integration into a linear DNA target.A, illustration of PFV concerted integration to 601 NPS DNA, not drawn to scale. PFV 40 bp vDNA (thin lines) in the context of an intasome is added to 601 NPS DNA (thick lines) wrapped around a histone octamer. The 601 NPS is 147 bp numbered –73 to +73 with 0 at the central dyad. Integration of the vDNA to the NPS yields an integration intermediate. The two PFV strand transfer events are separated by 4 bp of target DNA, indicated by numbers 0–3. For a single concerted integration, two integration products are formed. When analyzed by native gel electrophoresis, the products appear as two bands. Each product is one vDNA, a fraction of the NPS DNA, and a four base gap. Black circles indicate 5′ ends. B and C, the NPS DNA may be fluorescently labeled (red or blue diamond) on either the top (T-Cy5 NPS) or bottom (B-Cy5 NPS) strand. The integration strand transfers introduce nicks in the target DNA. Each nick is immediately adjacent to a point of joining. Denaturing gel electrophoresis isolates the NPS DNA fragment that is not joined to the vDNA. As an example, concerted integration could yield a 37 nt fragment and a 106 nt fragment (37 nt + 106 nt + 4 nt space between strand transfers = 147 nt, the length of 601). Based on the 601 numbering, the vDNA is joined to T-Cy5 NPS DNA at –36 and B-Cy5 NPS -33. Integration position 0 is at 601 NPS position –36.
Figure 2
Figure 2
Time course of PFV integration to a nucleosome target. A, PFV intasomes with a 40 bp vDNA (vDNA) were incubated with 147 bp Cy5 labeled 601 nucleosomes (NPS). Reaction products were separated by native PAGE stained with ethidium bromide. Left, ethidium bromide image. Right, Cy5 image. Lane 0 is 601 nucleosome substrate only. Lanes 1–6 are 1, 5, 15, 30, 60, and 90 min incubation times. DNA ladder sizes are on the left in bp. B, quantitation of integration over time with Cy5 labeled nucleosomes. The total Cy5 fluorescence in each lane was measured. The percentage of signal is the fluorescent signal excluding the substrate band. Error bars indicate the standard deviation between three independent experiments with at least two PFV intasome and nucleosome preparations.
Figure 3
Figure 3
PFV integration into 601 nucleosomes.A, denaturing PAGE analysis of PFV integration into 601 nucleosomes with a 5′ Cy5 label on the top strand (left, T-Cy5 NPS) or bottom strand (right, B-Cy5 NPS). The DNA size markers are expressed as the nucleosome positions relative to the dyad (–58 to +47 and +58 to –47, respectively). Lane 0 is 601 nucleosome substrate only (NPS). Lanes 1–4 include 7, 13, 20, and 26 nM PFV intasome. Lane 5 is naked 601 NPS DNA only. Lane 6 is naked 601 NPS DNA with 26 nM PFV intasome. B, signal density plots of lane 4 from T-Cy5 NPS (left) and B-Cy5 NPS (right) substrates were generated to quantitate integration activity at integration clusters. C, density plots of lane 4 from T-Cy5 NPS (red) and B-Cy5 NPS (blue) substrates were adjusted to a linear scale and overlaid. The B-Cy5 NPS density plot was slightly shifted to the left to account for the 4 bp between the points of joining. D, integration activity at the four major observed integration clusters over a gradient of PFV intasomes. T-Cy5 NPS (left) and B-Cy5 NPS (right) nucleosome substrates display similar profiles. Error bars indicate the standard deviation between at least three experiments with at least two independent PFV intasome and nucleosome preparations.
Figure 4
Figure 4
Truncations of the outer PFV IN domains alter integration at 601 NPS +47. A, PFV intasomes were generated with full-length (FL) PFV IN(K120E) at the inner subunits and truncations of PFV IN(D273K) at the outer subunits. FL PFV intasomes, intasomes with truncations of the amino terminal domains (ΔNTD), or intasomes with truncation of the carboxyl terminal domain (ΔCTD) were added to T-Cy5 601 nucleosomes. Reaction products were analyzed by denaturing PAGE. Lane 0 is 601 nucleosome substrate only (NPS). Lanes 1–4 include 7, 13, 20, and 26 nM PFV intasome. Lane 5 is naked 601 NPS DNA only. Lane 6 is naked 601 NPS DNA with 26 nM PFV intasome. The DNA size marker on the left is expressed as the nucleosome positions relative to the dyad. B, cartoons of the FL PFV IN domains and truncation mutants. C, the total integration to the 601 nucleosomes was calculated as the percentage of fluorescent signal in each lane below the unreacted target. D, integration efficiencies at each cluster –59, –37, +36, and +47 were calculated as fraction of the fluorescent signal in each lane. Error bars indicate the standard deviation between at least three experiments with at least two independent PFV intasome and nucleosome preparations.
Figure 5
Figure 5
Affinity of PFV IN truncation mutants for 601 nucleosomes in the presence of physiologically relevant monovalent salt concentration.A, FL, PFV IN(ΔNTD), and PFV IN(ΔCTD) intasomes were assembled with vDNA labeled with biotin. The intasomes were added to 601 nucleosomes and streptavidin-conjugated beads in the presence of 110 mM NaCl. The beads were extensively washed, analyzed by PAGE, and stained with Coomassie brilliant blue. Lane I, 5% of the total protein. Lane B, proteins associated with beads. Histones H3, H2B, and H2A (H). Streptavidin (S) and histone H4 have the same mobility. B, the total Coomassie signal in each lane was calculated, excluding the band of streptavidin and H4. The percentage of the total H3, H2B, and H2A signal in each lane B was calculated. Black circles indicate values from each experiment. Error bars indicate the standard deviation between three experiments with at least two independent PFV intasome and nucleosome preparations.
Figure 6
Figure 6
Increasing salt concentration decreases PFV integration into nucleosomes.A, FL, PFV IN(ΔNTD), and PFV IN(ΔCTD) intasomes were added to T-Cy5 nucleosomes in the presence of increasing concentrations of NaCl. Lane 0 is 601 nucleosome substrate only (NPS). Lanes 1–5 include 26 nM PFV intasome and 100, 150, 200, 250, and 300 mM NaCl, respectively. The DNA size marker on the left is expressed as the nucleosome positions relative to the dyad. B, the total integration activity was calculated as the percentage of fluorescent signal below the NPS DNA band. C, integration efficiencies at each cluster –59, –37, +36, and +47 were calculated as the percentage of the fluorescent signal in each lane. Error bars indicate the standard deviation between at least three experiments with at least two independent PFV intasome and nucleosome preparations.
Figure 7
Figure 7
Affinity of PFV IN truncation mutants for 601 nucleosomes in the presence of a relatively high salt concentration.A, FL, PFV IN(ΔNTD), and PFV IN(ΔCTD) intasomes with biotinylated vDNA were added to 601 nucleosomes and streptavidin-conjugated beads in the presence of 300 mM NaCl. The beads were extensively washed, analyzed by PAGE, and stained with Coomassie brilliant blue. Lane I, 5% of the total proteins. Lane B, proteins associated with beads. Histones H3, H2B, and H2A (H). Streptavidin (S) and histone H4 have the same mobility. B, The total Coomassie signal in each lane was calculated, excluding the band of streptavidin and H4. The fraction of the total signal in each lane B associated with the H3, H2B, and H2A bands was calculated. Black circles indicate values from each experiment. Error bars indicate the standard deviation between three experiments with at least two independent PFV intasome and nucleosome preparations.
Figure 8
Figure 8
FL PFV and PFV IN(ΔCTD) intasome integration to trypsinized nucleosomes.A, 601 nucleosomes were treated with trypsin to remove the histone tails (–Tails). FL or PFV IN(ΔCTD) intasomes were added to +Tails or –Tails nucleosomes in the presence of 110 mM NaCl. Integration products were analyzed by denaturing PAGE. The DNA size marker on the left is expressed as the nucleosome positions relative to the dyad. B, the total integration of each intasome to the 601 nucleosomes was calculated as the percentage of fluorescent signal in each lane below the unreacted target. C, integration efficiencies at each cluster –59, –37, +36, and +47 were calculated as the percentage of the fluorescent signal in each lane. Black circles indicate values from each experiment. Error bars indicate the standard deviation between at least three experiments with at least two independent PFV intasome and nucleosome preparations.
Figure 9
Figure 9
Affinity of FL PFV and PFV IN(ΔCTD) intasomes for trypsinized 601 nucleosomes.A, 601 nucleosomes were treated with trypsin to remove the histone tails (–Tails). Biotinylated FL PFV and PFV IN(ΔCTD) intasomes were added to +Tails or –Tails 601 nucleosomes and streptavidin-conjugated beads in the presence of 110 mM NaCl. The beads were extensively washed, analyzed by PAGE, and stained with Coomassie brilliant blue. Lane I, 5% of the total protein. Lane B, proteins associated with beads. FL histones H3, H2B, and H2A (H). Streptavidin (S) and histone H4 have the same mobility. TL H3, H2A, and H2B have a similar mobility to streptavidin. B, the total Coomassie signal in each lane was calculated, excluding streptavidin. The percentage of the total signal in each lane B associated with the FL H3, H2B, and H2A bands or TL H4 was calculated. Black circles indicate values from each experiment. Error bars indicate the standard deviation between three experiments with at least two independent PFV intasome and nucleosome preparations.

Similar articles

Cited by

References

    1. Coffin J.M., Hughes S.H., Varmus H.E. Cold Spring Harbor Laboratory Press; Cold Spring Harbor, NY: 1997. Retroviruses. - PubMed
    1. Maertens G.N., Hare S., Cherepanov P. The mechanism of retroviral integration from X-ray structures of its key intermediates. Nature. 2010;468:326–329. - PMC - PubMed
    1. Valkov E., Gupta S.S., Hare S., Helander A., Roversi P., McClure M., Cherepanov P. Functional and structural characterization of the integrase from the prototype foamy virus. Nucleic Acids Res. 2009;37:243–255. - PMC - PubMed
    1. Hare S., Gupta S.S., Valkov E., Engelman A., Cherepanov P. Retroviral intasome assembly and inhibition of DNA strand transfer. Nature. 2010;464:232–236. - PMC - PubMed
    1. Maskell D.P., Renault L., Serrao E., Lesbats P., Matadeen R., Hare S., Lindemann D., Engelman A.N., Costa A., Cherepanov P. Structural basis for retroviral integration into nucleosomes. Nature. 2015;523:366–369. - PMC - PubMed

Publication types

LinkOut - more resources