Comparative Study
. 2021 May 14;433(10):166946.
doi: 10.1016/j.jmb.2021.166946. Epub 2021 Mar 18.

SARS-CoV-2 Fusion Peptide has a Greater Membrane Perturbating Effect than SARS-CoV with Highly Specific Dependence on Ca2

Affiliations
Comparative Study

SARS-CoV-2 Fusion Peptide has a Greater Membrane Perturbating Effect than SARS-CoV with Highly Specific Dependence on Ca2

Alex L Lai et al. J Mol Biol. .

Abstract

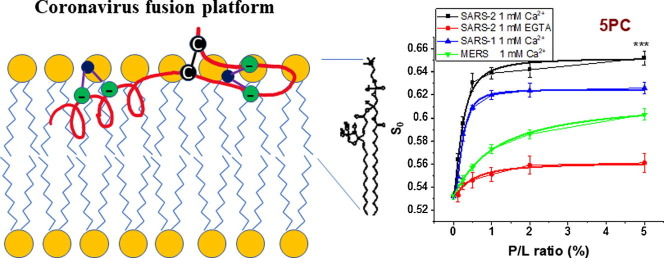
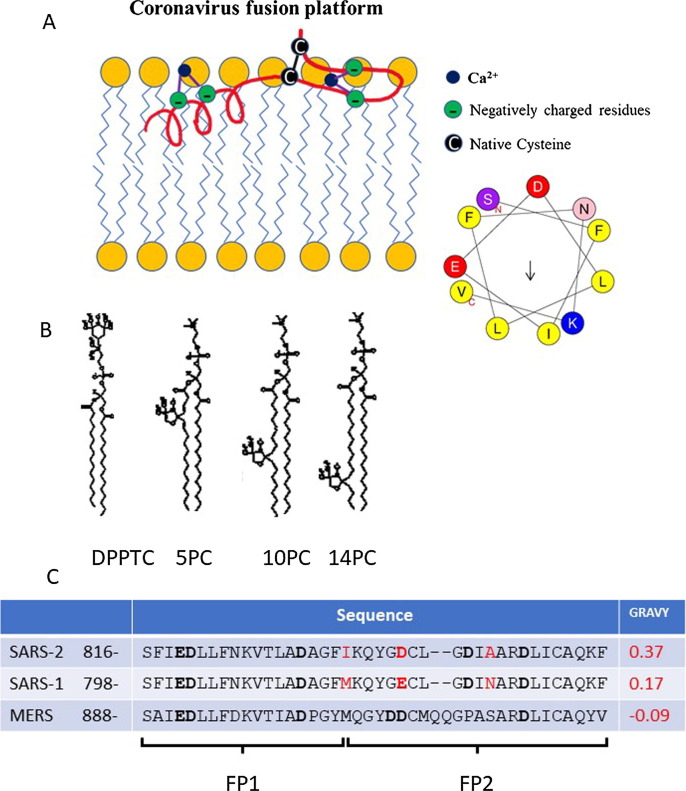
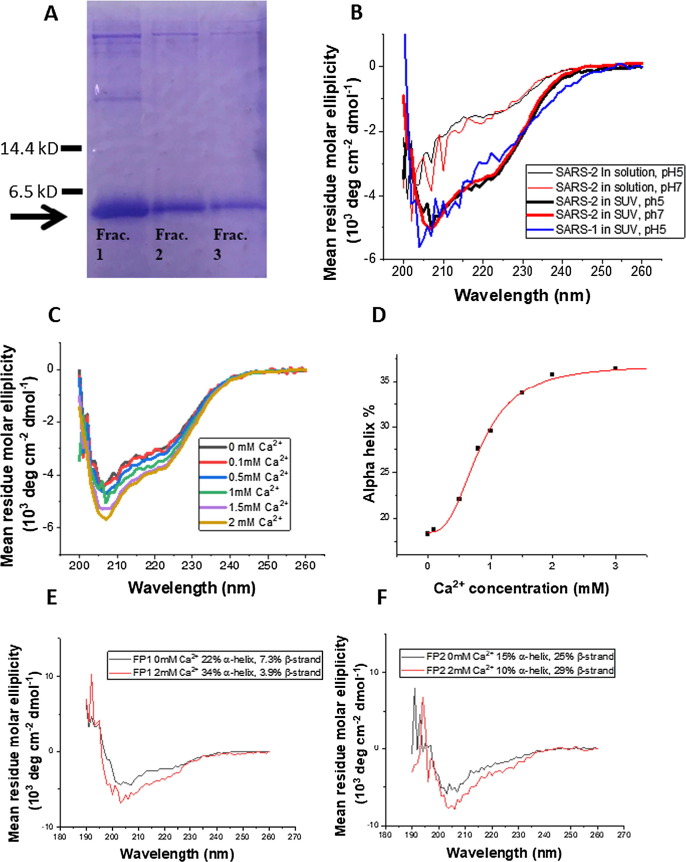
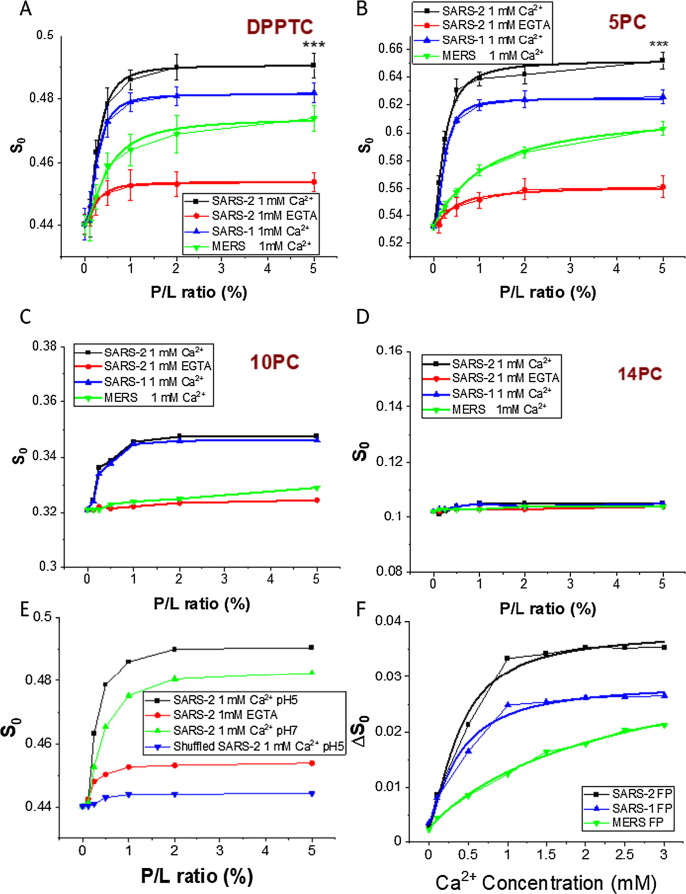
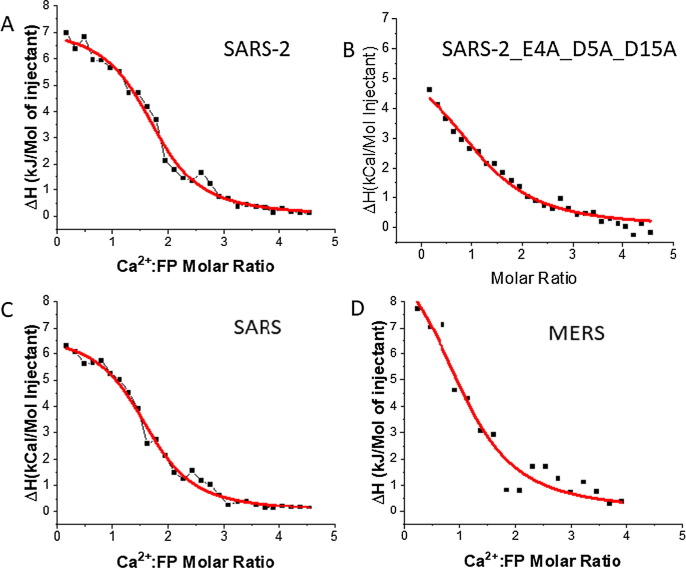
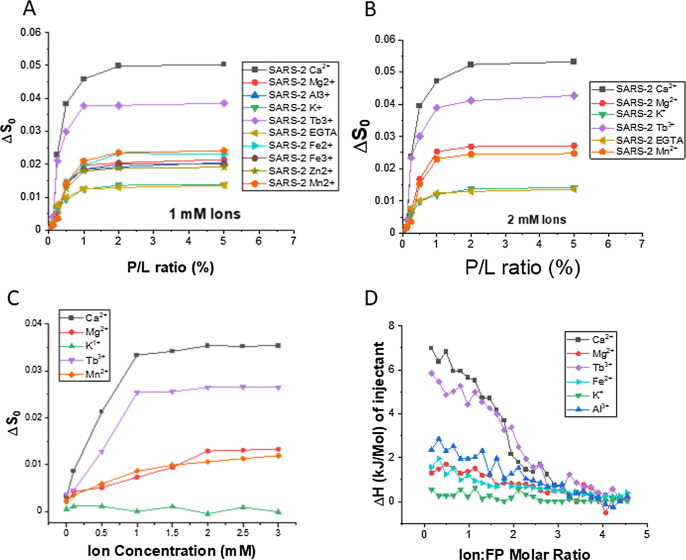
Coronaviruses are a major infectious disease threat, and include the zoonotic-origin human pathogens SARS-CoV-2, SARS-CoV, and MERS-CoV (SARS-2, SARS-1, and MERS). Entry of coronaviruses into host cells is mediated by the spike (S) protein. In our previous ESR studies, the local membrane ordering effect of the fusion peptide (FP) of various viral glycoproteins including the S of SARS-1 and MERS has been consistently observed. We previously determined that the sequence immediately downstream from the S2' cleavage site is the bona fide SARS-1 FP. In this study, we used sequence alignment to identify the SARS-2 FP, and studied its membrane ordering effect. Although there are only three residue differences, SARS-2 FP induces even greater membrane ordering than SARS-1 FP, possibly due to its greater hydrophobicity. This may be a reason that SARS-2 is better able to infect host cells. In addition, the membrane binding enthalpy for SARS-2 is greater. Both the membrane ordering of SARS-2 and SARS-1 FPs are dependent on Ca2+, but that of SARS-2 shows a greater response to the presence of Ca2+. Both FPs bind two Ca2+ ions as does SARS-1 FP, but the two Ca2+ binding sites of SARS-2 exhibit greater cooperativity. This Ca2+ dependence by the SARS-2 FP is very ion-specific. These results show that Ca2+ is an important regulator that interacts with the SARS-2 FP and thus plays a significant role in SARS-2 viral entry. This could lead to therapeutic solutions that either target the FP-calcium interaction or block the Ca2+ channel.

Keywords: COVID-19; ESR; ITC; hydrophobicity; ion specificity.


Conflict of interest statement

Declaration of Competing Interest The authors declare that they have no known competing financial interests or personal relationships that could have appeared to influence the work reported in this paper.

Figures

None
Graphical abstract
Figure 1
Figure 1
(A). A model of the coronavirus FP or “platform” interacting with a lipid bilayer (adopted from our previous model using the structural information from CD spectroscopy in this study, and the molecular dynamics model. A Heliquest Plot for the first 11 amino acids is shown. (B) The structure of spin labeled lipids used: DPPTC, 5PC, 10PC and 14PC. (C) The sequence alignment of SARS-2, SARS-1, and MERS FPs, and their grand average of hydropathy (GRAVY) values (calculated using GRAVY Calculator, http://www.gravy-calculator.de/index.php). The residues in red highlight the difference between SARS-2 and SARS FP. The residues in bold are the negatively charged residues which are potential Ca2+ binding sites.
Figure 2
Figure 2
(A) The SDS-PAGE gel of the SARS-2 FP after purification using a His-tag affinity column; the arrow shows the bands for the FP. The fractions were the combined and further purified using size-exclusive chromatography. (B) CD Spectra of SARS-2 FP in solution (thin lines) and POPC/POPG/Chol = 3/1/1 SUVs (thick lines) in pH 5 buffer (black) or pH 7 buffer (red) at 25 °C, and SARS-1 FP in SUVs at pH5 (blue). (C) CD spectra for SARS-2 FP in SUVs at pH5 show that the alpha helix content increases with the increase of Ca2+ concentration. (D) The alpha helix content of the FP in membranes at different Ca2+ concentrations, which was calculated from (C) using K3D2 server. The data were fit with the built-in logistic function of Origin, which shows the X50 = 0.83 mM. (E, F) The CD spectra of SARS-2 FP1 (E) and FP2 (F) in SUV in pH5 buffer with 0 mM (black) and 2 mM (red) CaCl2. The percentage of alpha helix and beta strand was calculated using K3D2.
Figure 3
Figure 3
Plots of order parameters of DPPTC (A), 5PC (B), 10PC (C) and 14PC (D) versus peptide:lipid ratio (P/L ratio) of SARS-2 FP, SARS FP and MERS FP in POPC/POPG/Chol = 3/1/1 MLVs in buffer at pH5 with 150 mM NaCl at 25 °C. Black, SARS-2 FP with 1 mM Ca2+ and at pH 5; red, SARS-2 FP with 1 mM EGTA; blue, SARS FP with 1 mM Ca2+; green, MERS FP with 1 mM Ca2+. The curves were fitted with the logistic function (Table 1A and 1B) (E). Plots of local order parameters of DPPTC versus P/L ratio as in A-D with pH indicated. Black, SARS-2 FP at pH 5; red, SARS-2 FP triple mutant (E4A_D5A_D15A) at pH 5; blue, SARS-2 FP at pH 7; and green, a peptide with shuffled sequence of SARS-2 FP at pH 5. (F) Plot of local order parameters of DPPTC with and without 1% peptide binding (ΔS0) versus Ca2+ as in A-D. Black, SARS-2 FP; blue, SARS FP and green, MERS FP. The experiments were typically repeated three times. The typical uncertainties from simulation found for S0 range from 1–5 × 10−3, while the uncertainties from repeated experiments were 5–8 × 10−3 or less than ± 0.01. We show in Panels A and B the bars for the standard deviation. Statistical significance analyses were performed using two-tailed Student’s t-test on the S0′s of 0% SARS-2 FP and 5% SARS-2 FP at the “1mM Ca2+” condition, *** ≤ 0.001, highly significant.
Figure 4
Figure 4
ITC analysis of Ca2+ binding to FP of the coronaviruses. (A) SARS-2 FP, (B) SARS-2 FP triple mutant (E4A_D5A_D15A). (C) SARS-1 FP. (D) MERS FP. The peptides were titrated with CaCl2 in the pH5 buffer. The integrated data represent the enthalpy change per mole of injectant, ΔH, in units of kcal/mol as a function of the molar ratio. The data were fitted using a one-site model (parameters shown in Table 3B). Data points and fitted data are overlaid.
Figure 5
Figure 5
The specificity of Ca2+. (A) Plots of local order parameter changes of DPPTC (ΔS0) versus the P/L ratio with 1 mM ion concentration for a variety of ions and in buffer with 150 mM NaCl at pH5 and at 25 °C. (B) The same with 2 mM ion concentration. (C) Plots of local order parameter changes of DPPTC (ΔS0) versus the concentration of the ions with 1% P/L ratio and at pH5. (D) ITC analysis of ions binding to SARS-2 FP in solution. The peptides were titrated with CaCl2 in pH5 buffer.

Similar articles

Cited by

References

    1. De Wit E., Van Doremalen N., Falzarano D., Munster V.J. SARS and MERS: Recent insights into emerging coronaviruses. Nat. Rev. Microbiol. 2016;14:523–534. - PMC - PubMed
    1. Epand R.M. Membrane fusion. Biosci. Rep. 2000;20:435–441. - PubMed
    1. Blumenthal R., Clague M.J., Durell S.R., Epand R.M. Membrane fusion. Chem. Rev. 2003;103:53–69. - PubMed
    1. Weissenhorn W., et al. Structural basis for membrane fusion by enveloped viruses. Mol. Membr. Biol. 1999;16:3–9. - PubMed
    1. Tang T., Bidon M., Jaimes J.A., Whittaker G.R., Daniel S. Coronavirus membrane fusion mechanism offers a potential target for antiviral development. Antiviral Res. 2020;178 - PMC - PubMed

Publication types

MeSH terms

LinkOut - more resources