. 2021 Jul 1:234:117965.
doi: 10.1016/j.neuroimage.2021.117965. Epub 2021 Mar 17.

Which multiband factor should you choose for your resting-state fMRI study?

Affiliations

Which multiband factor should you choose for your resting-state fMRI study?

Benjamin B Risk et al. Neuroimage. .

Abstract

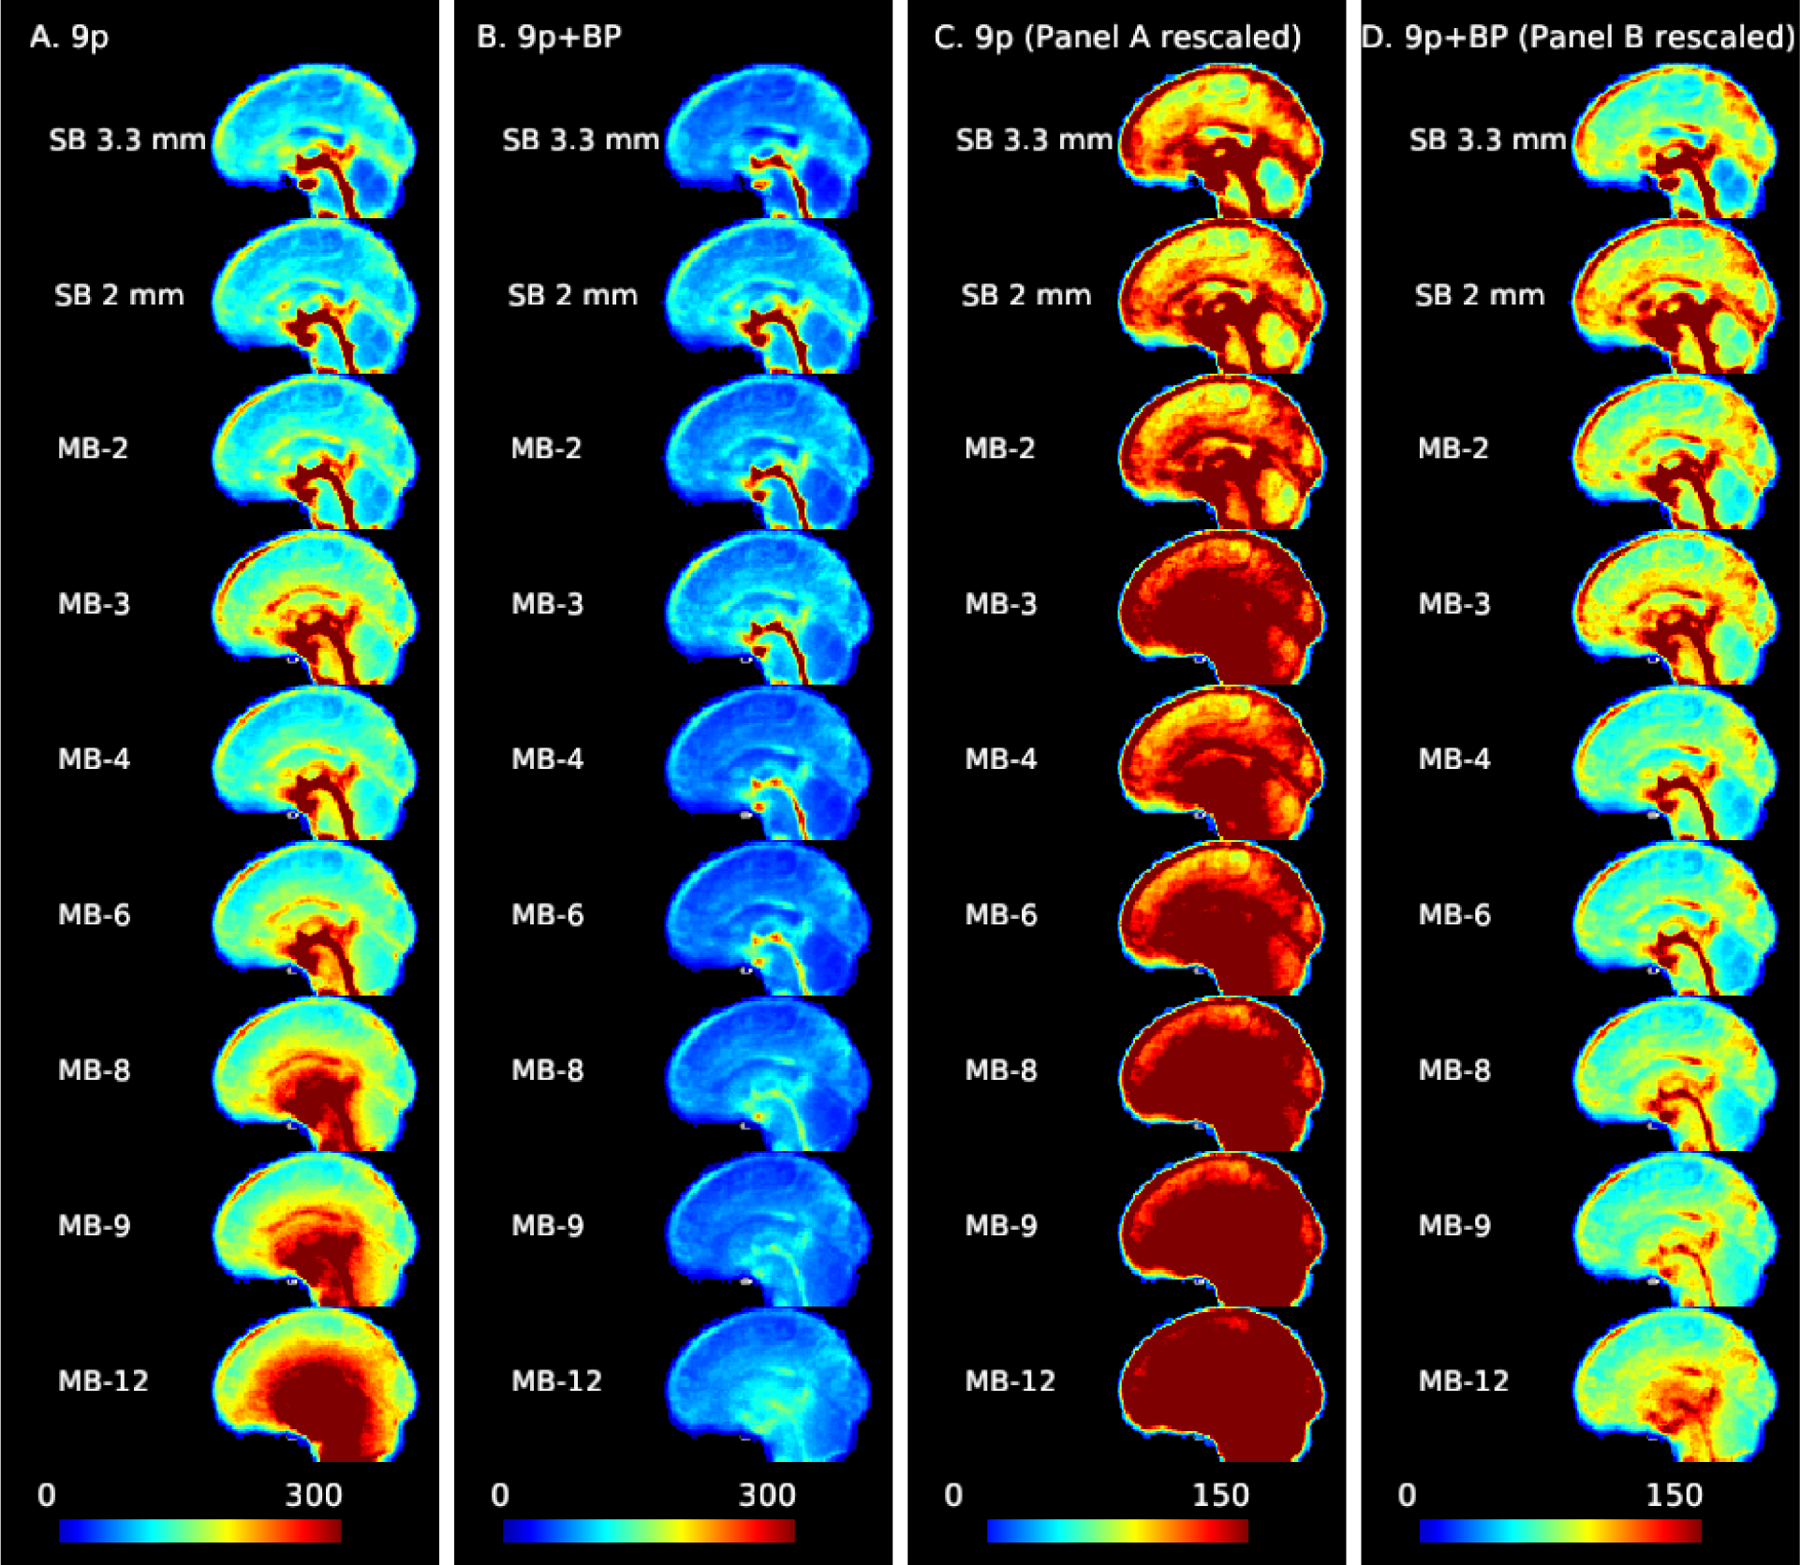
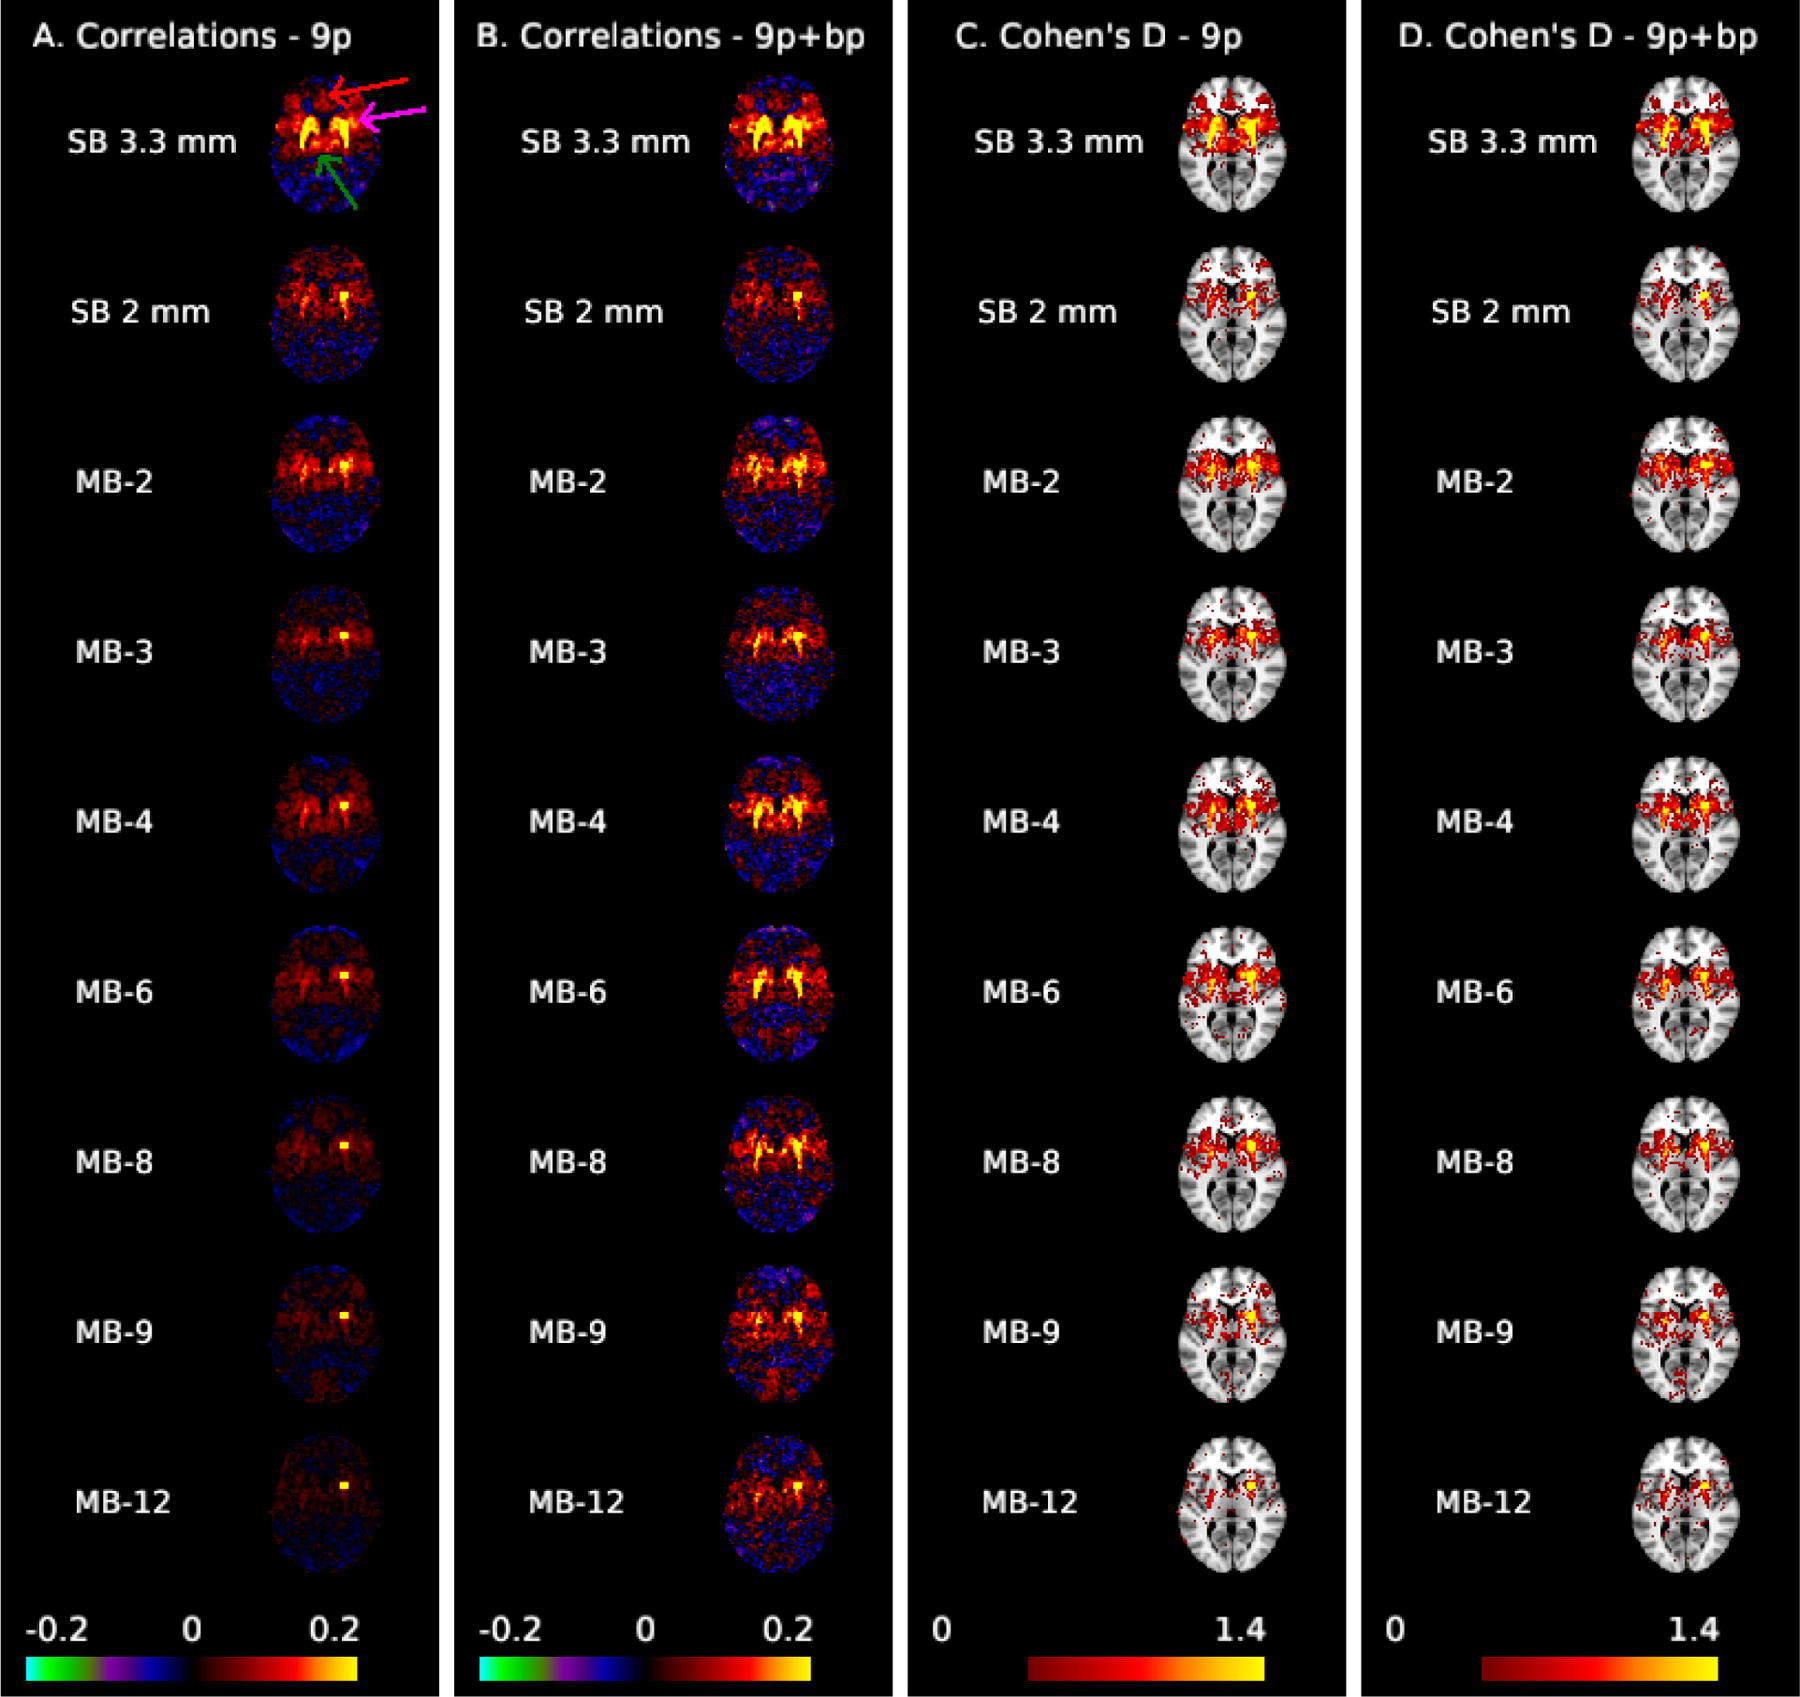
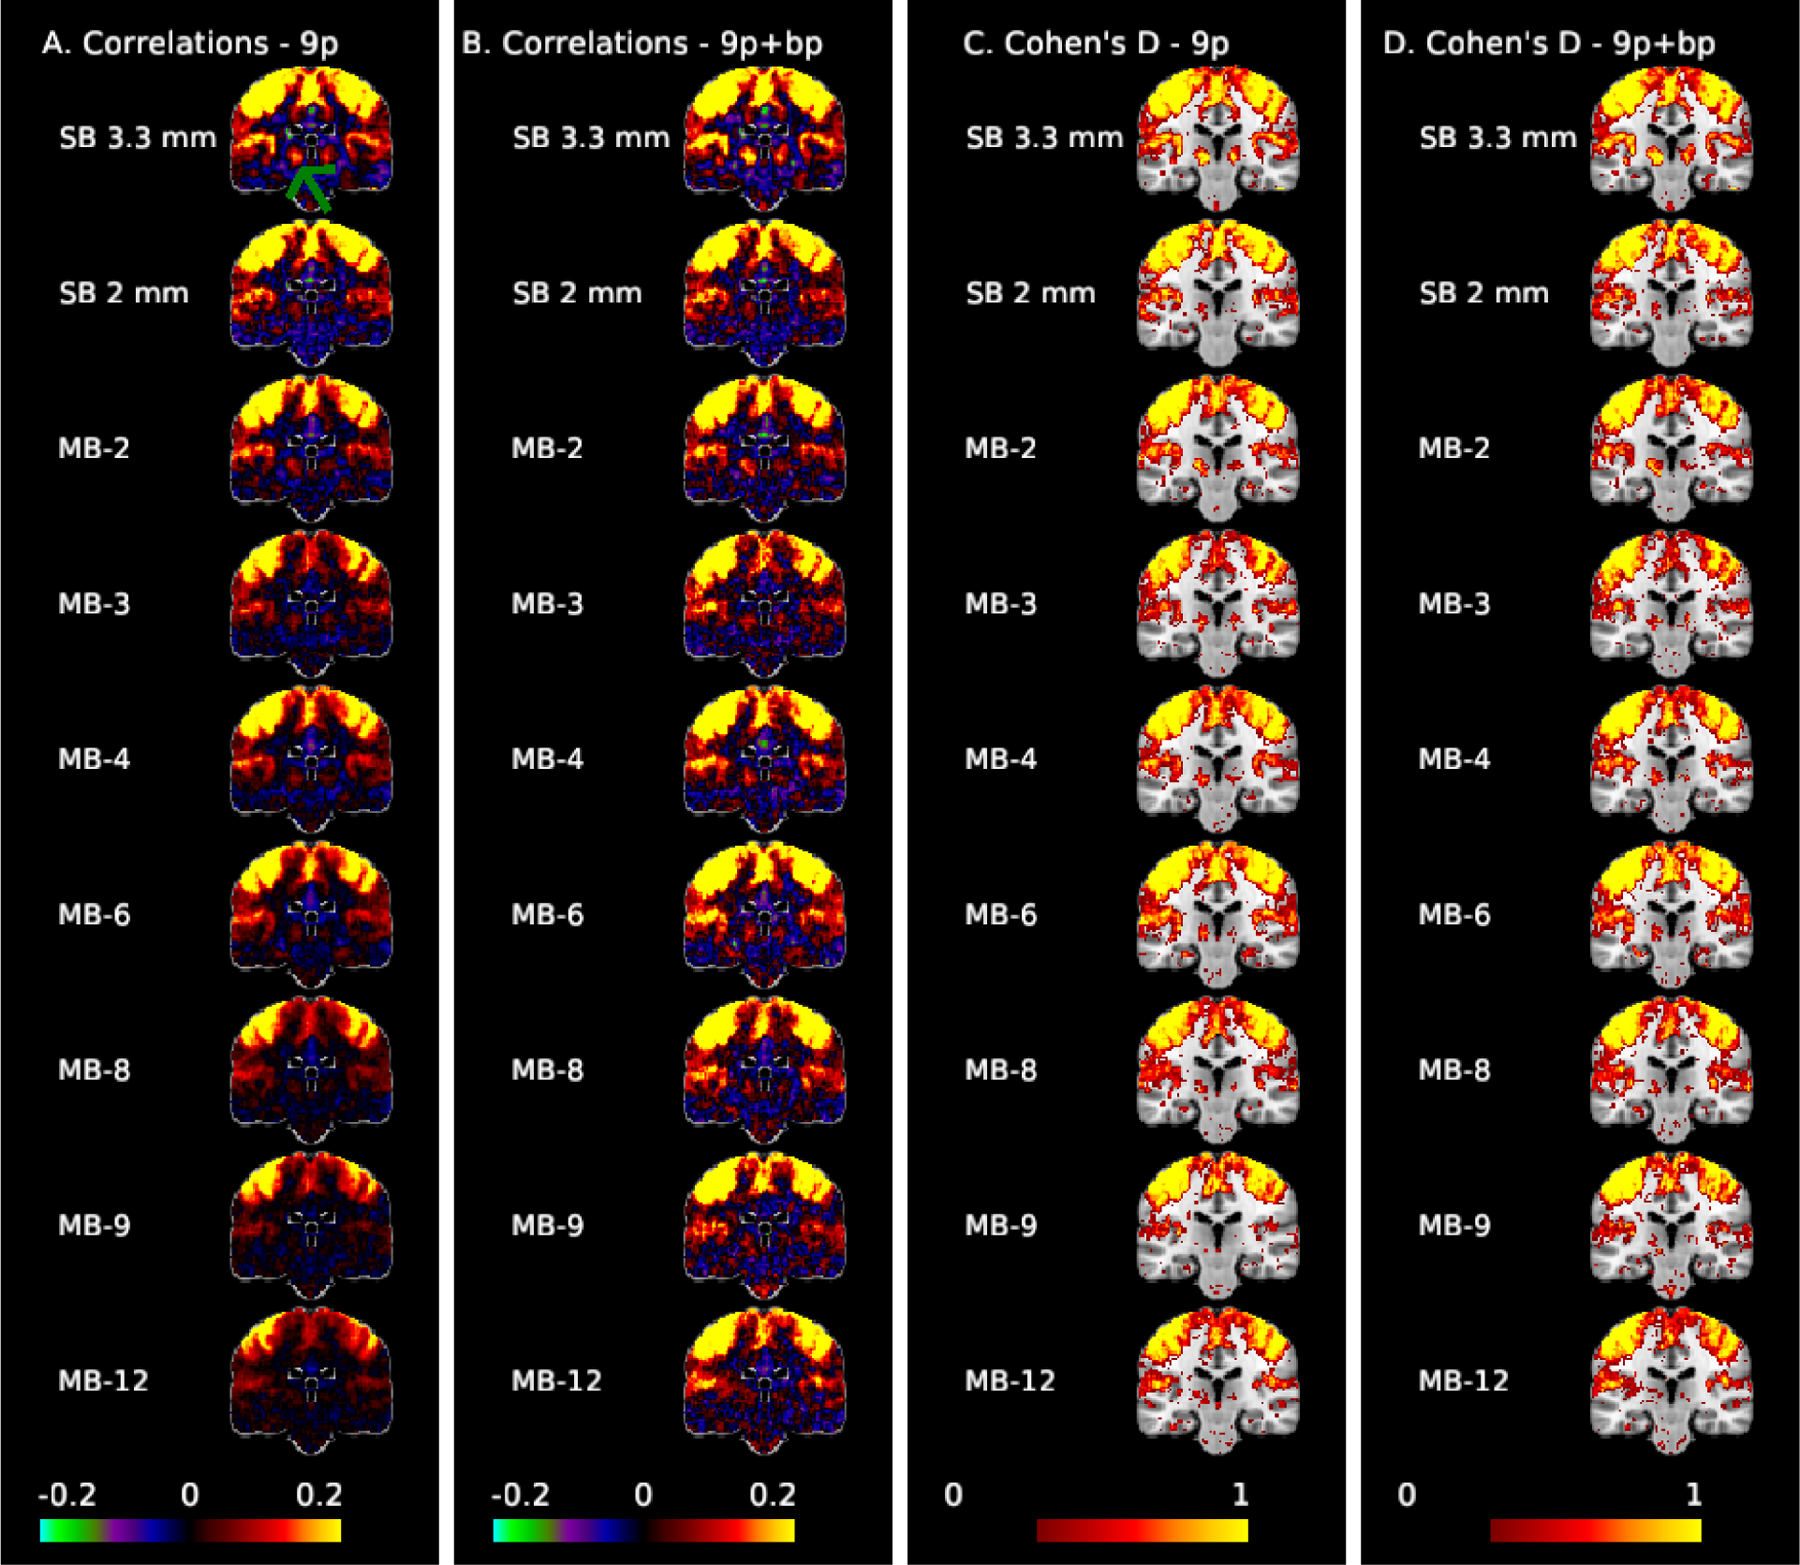
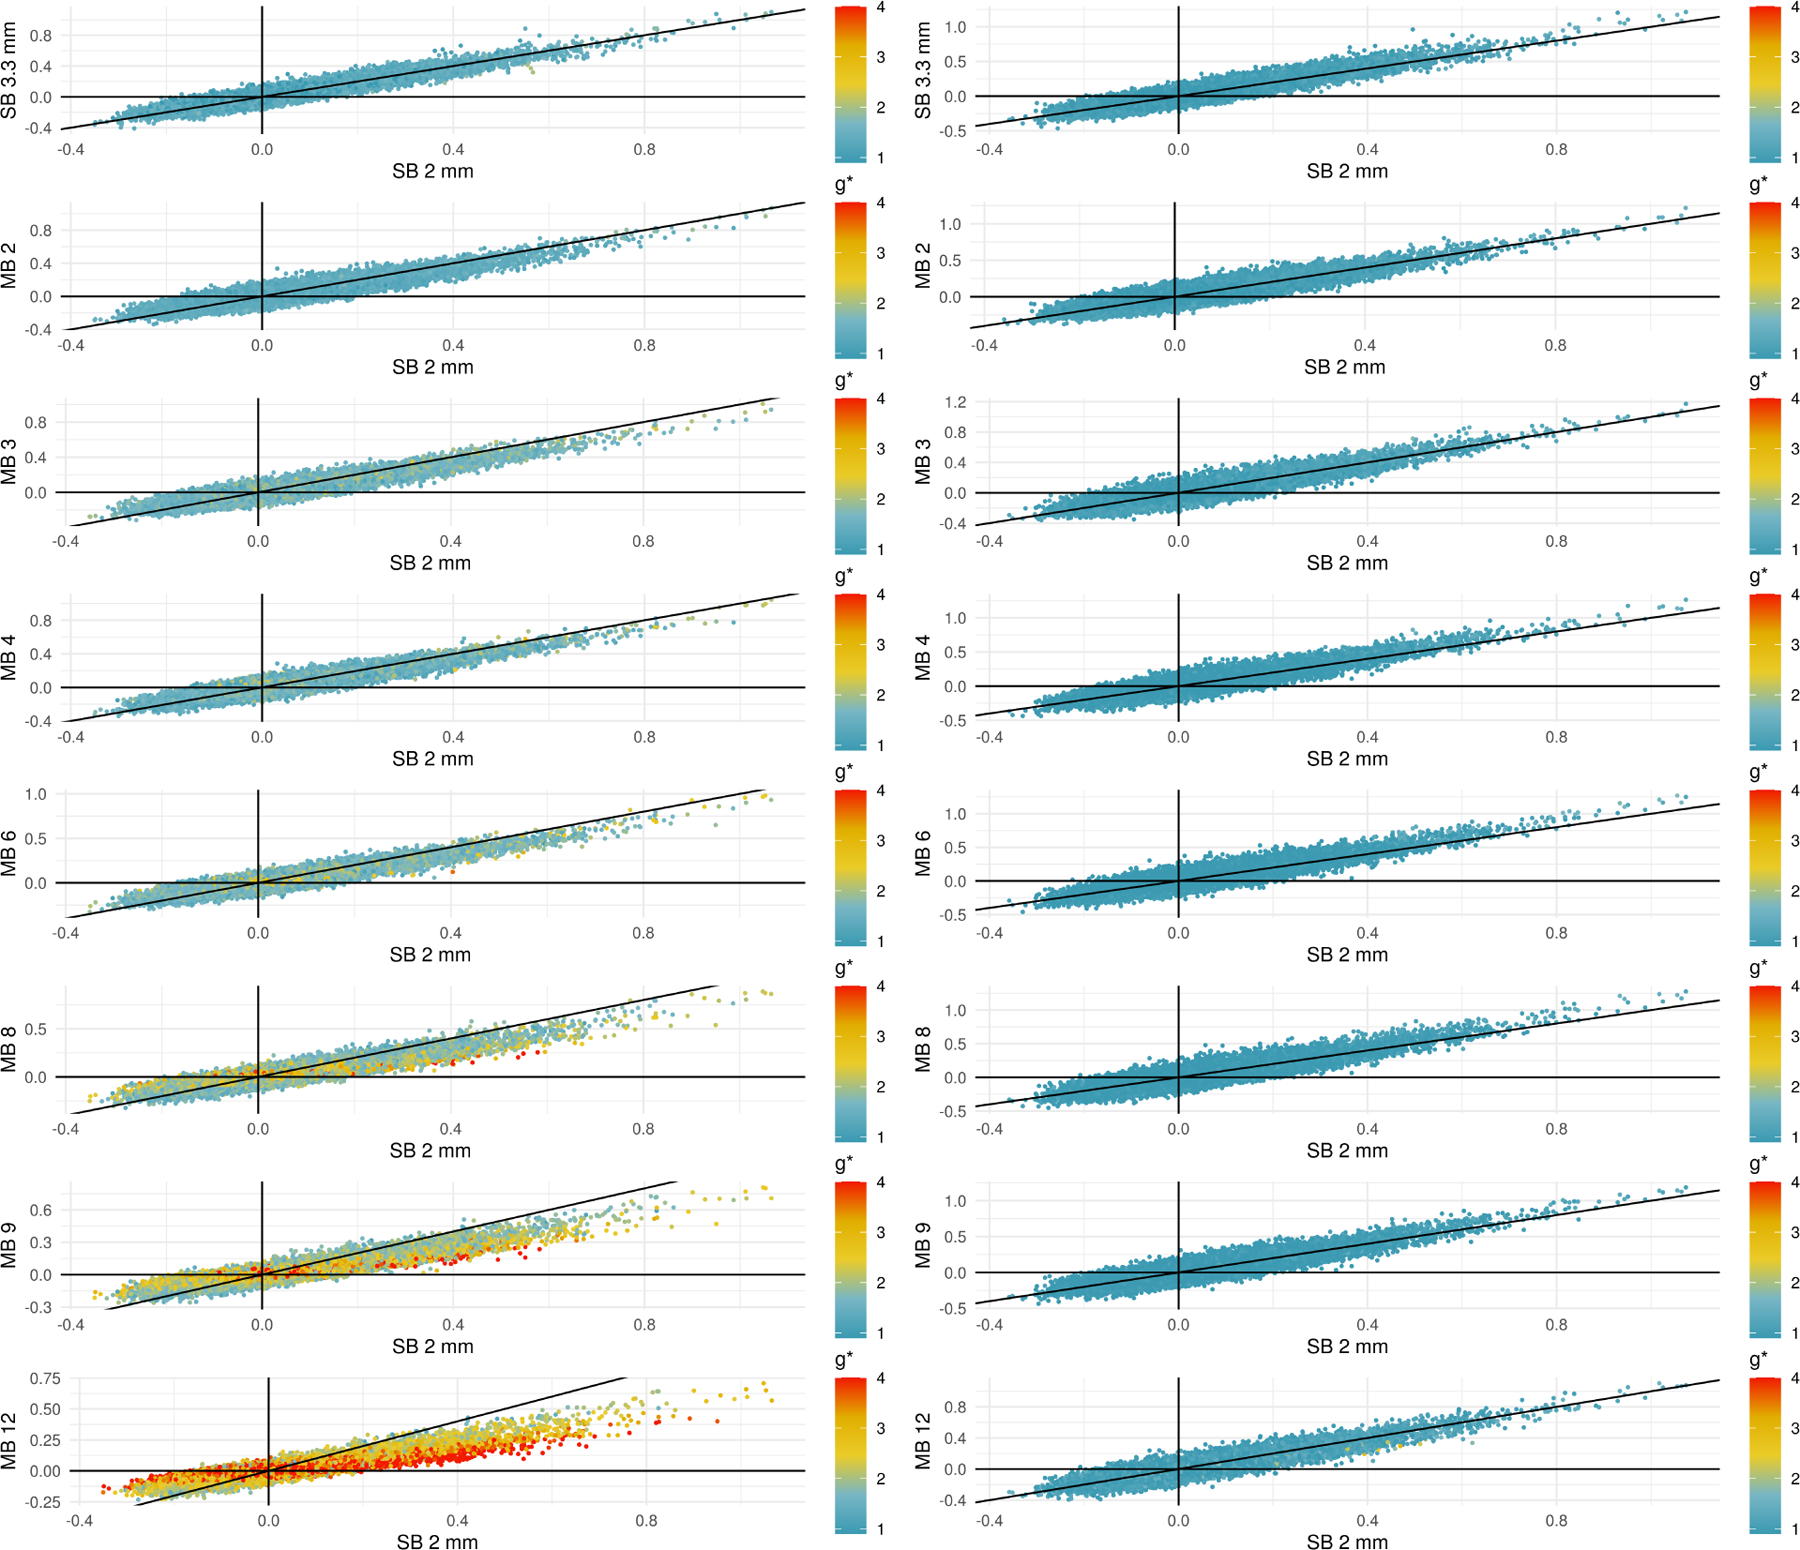
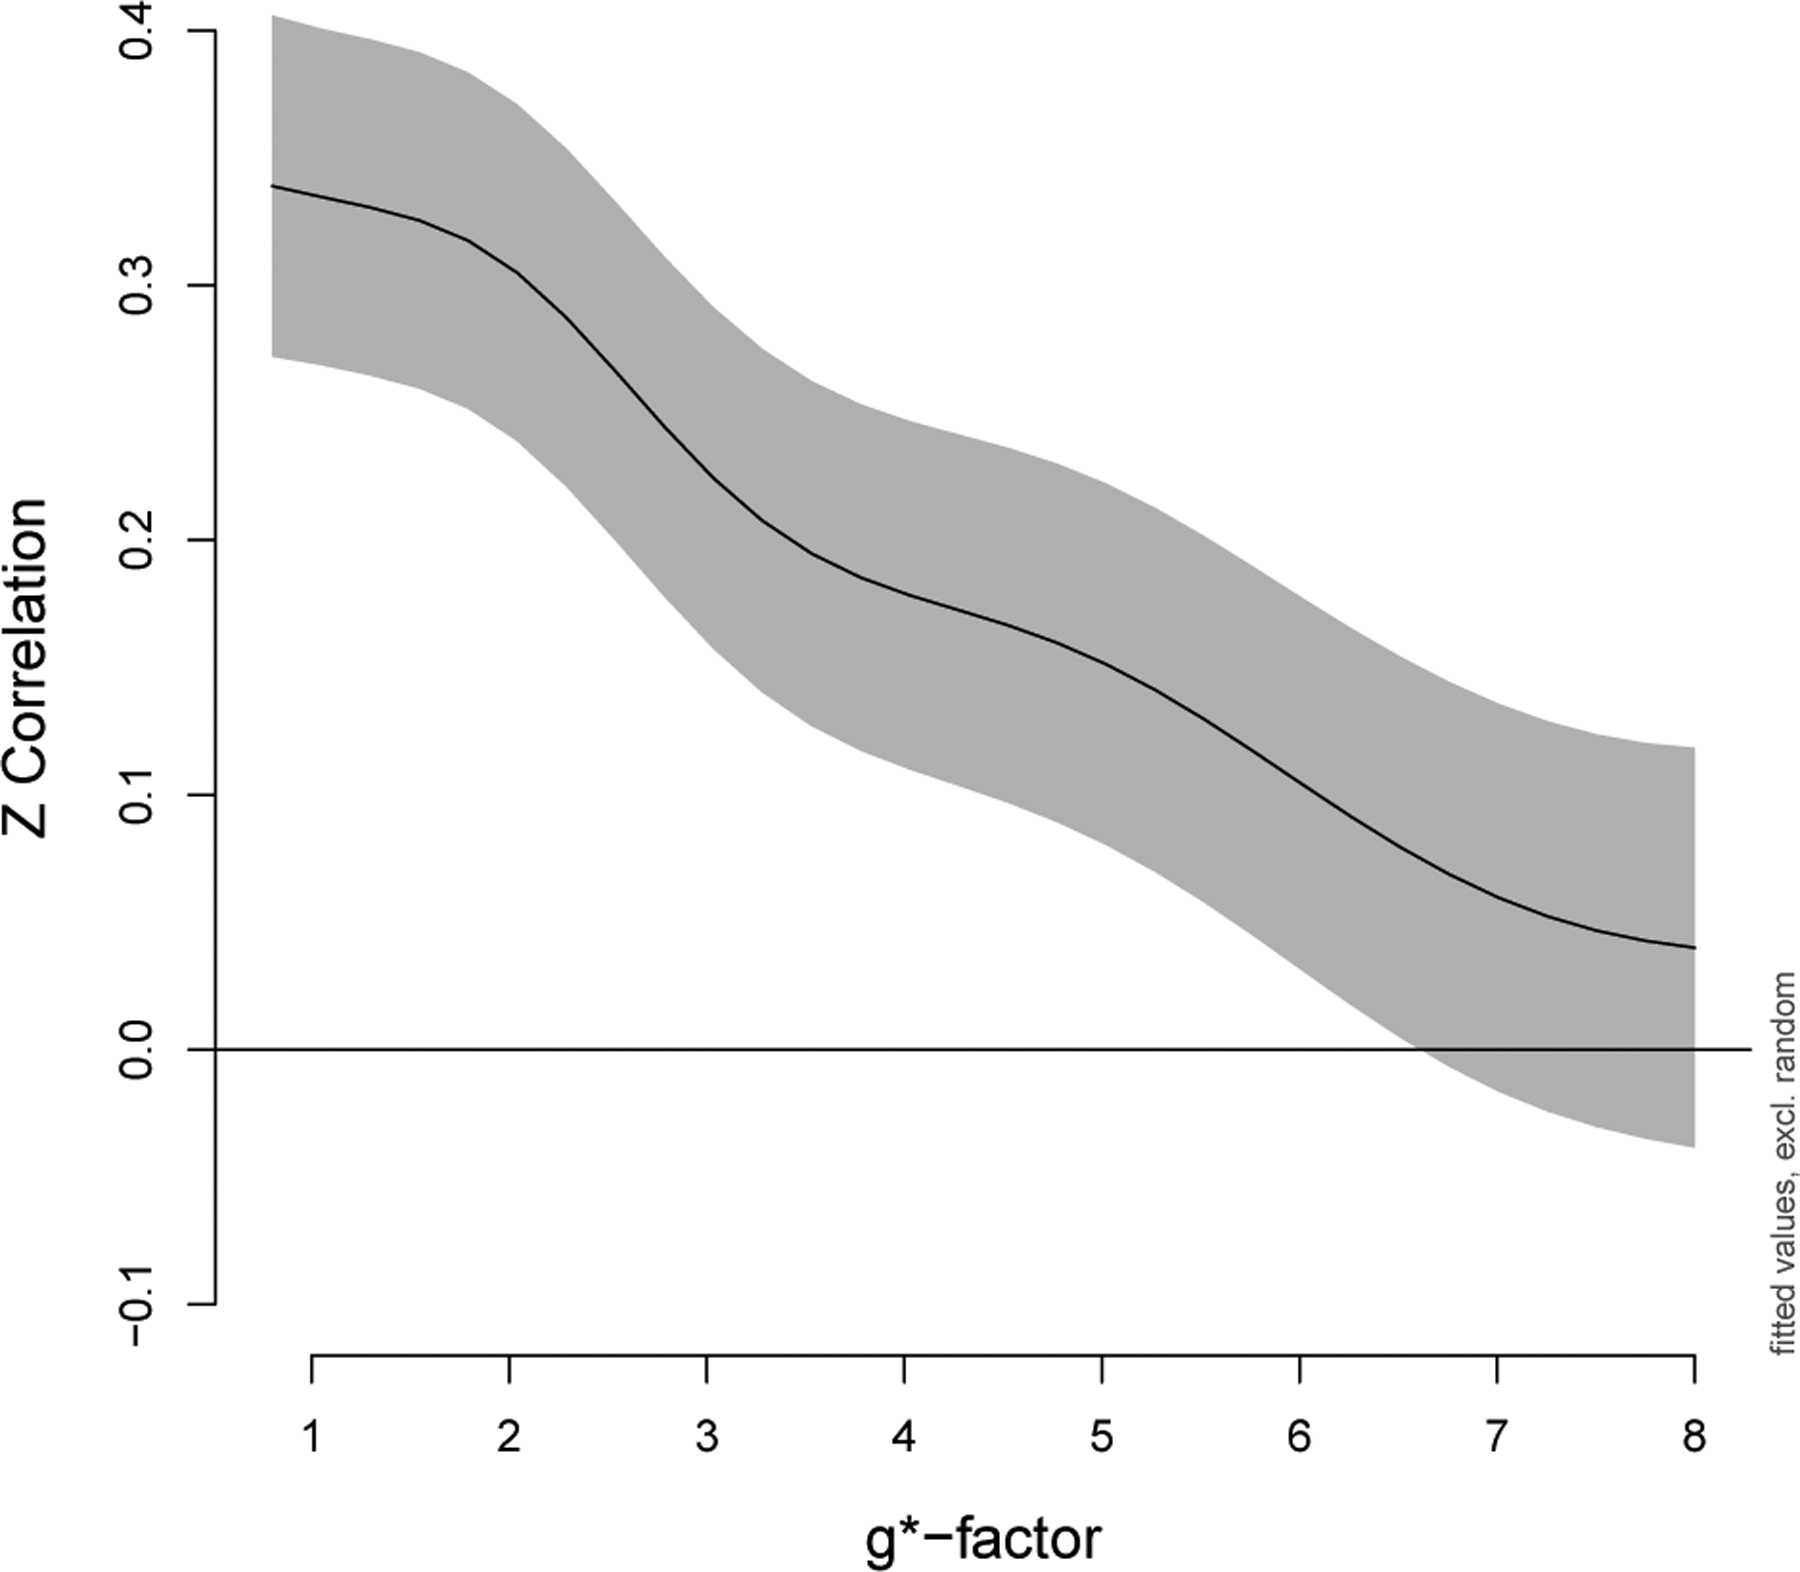
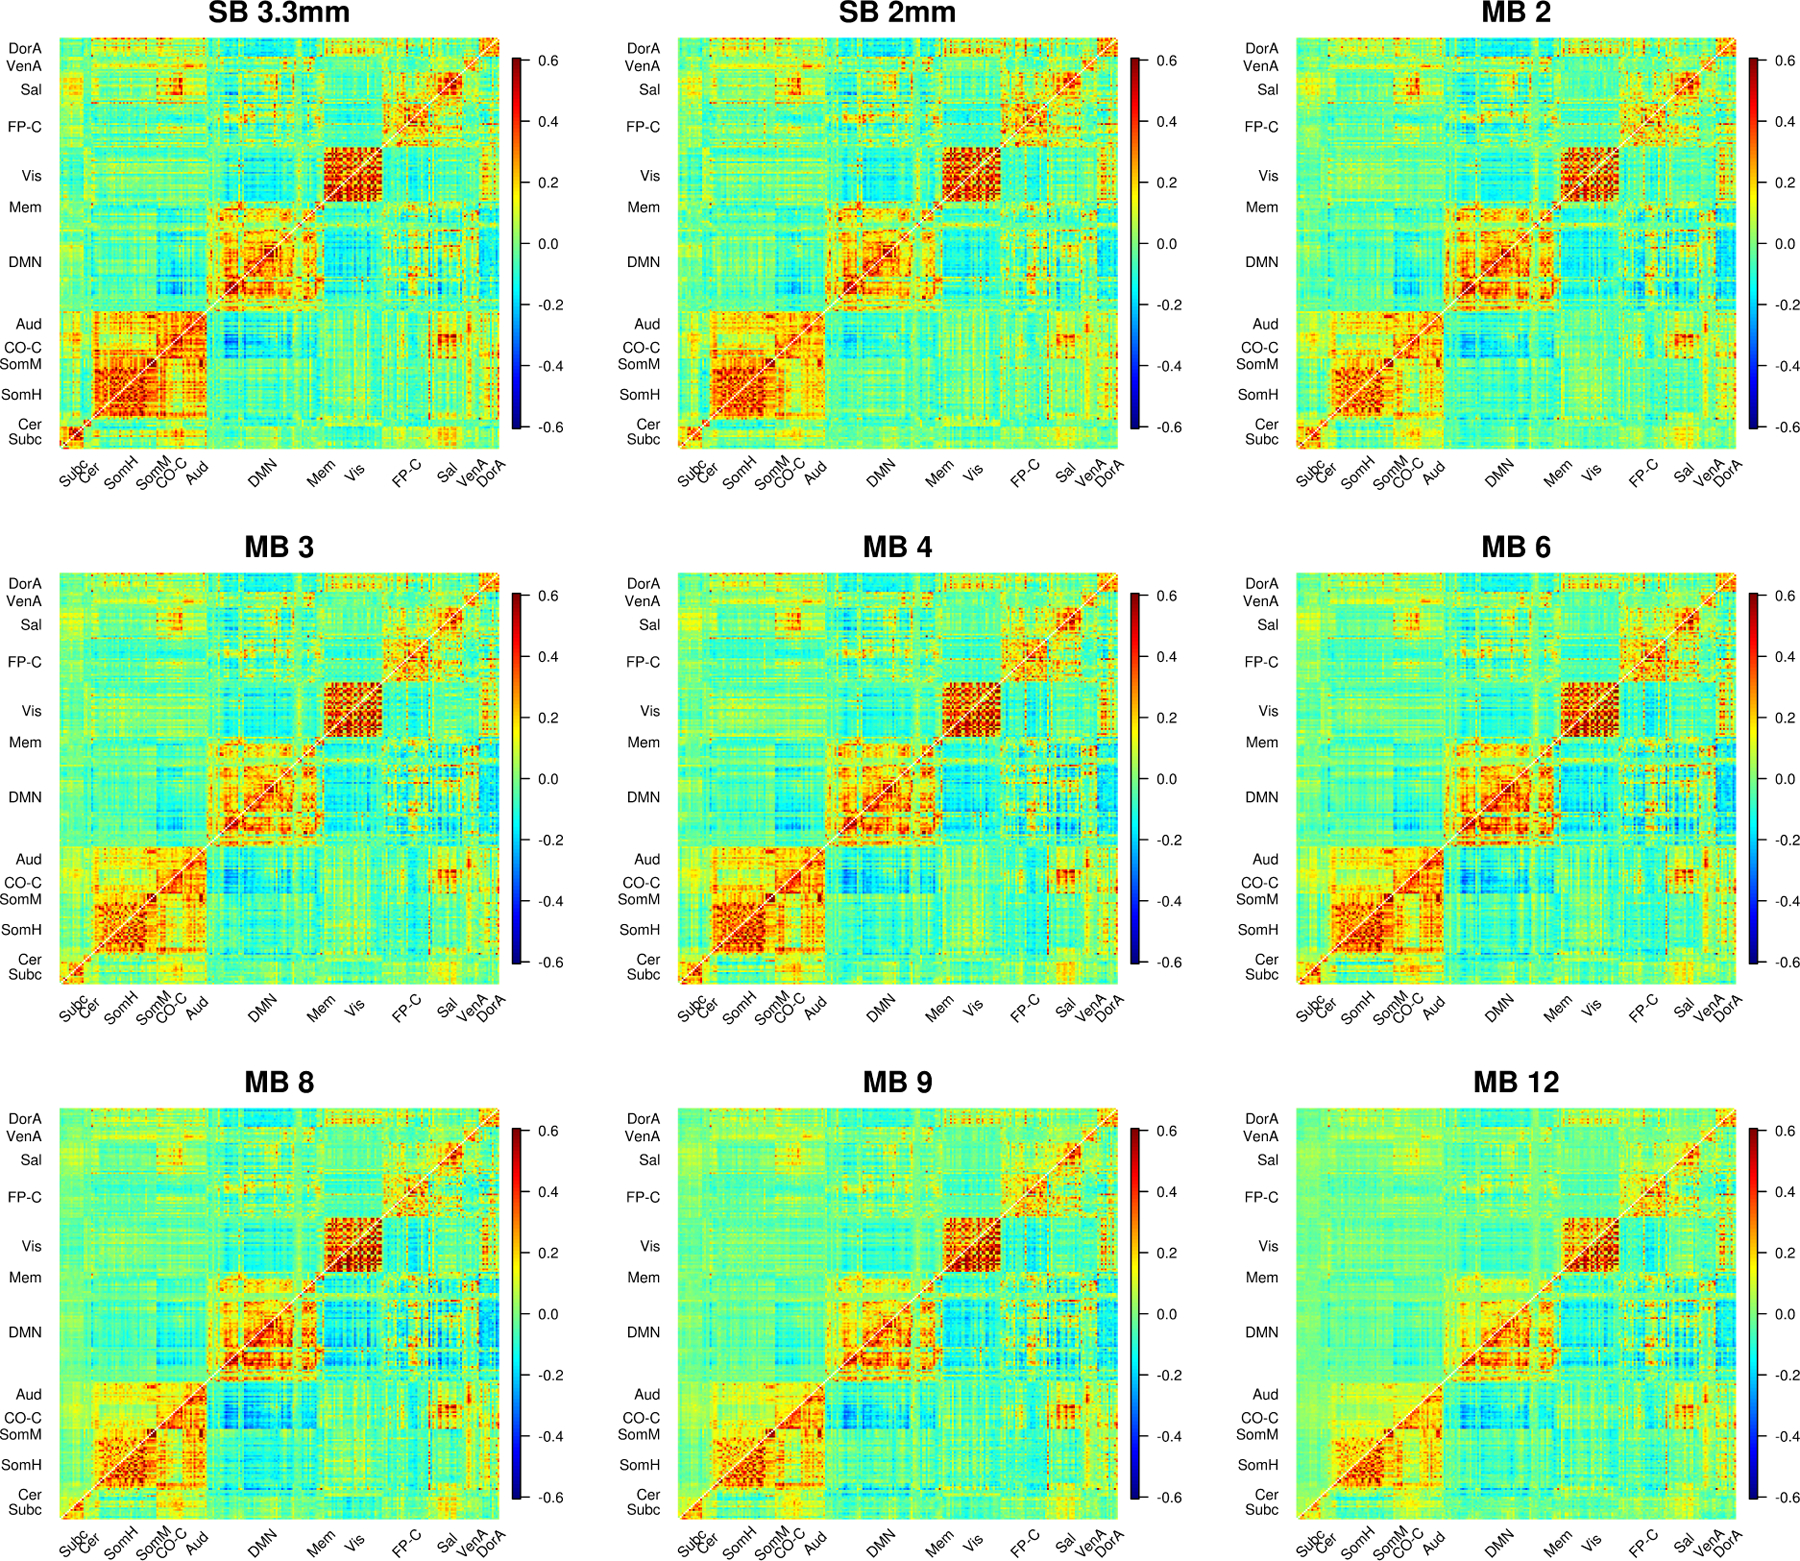
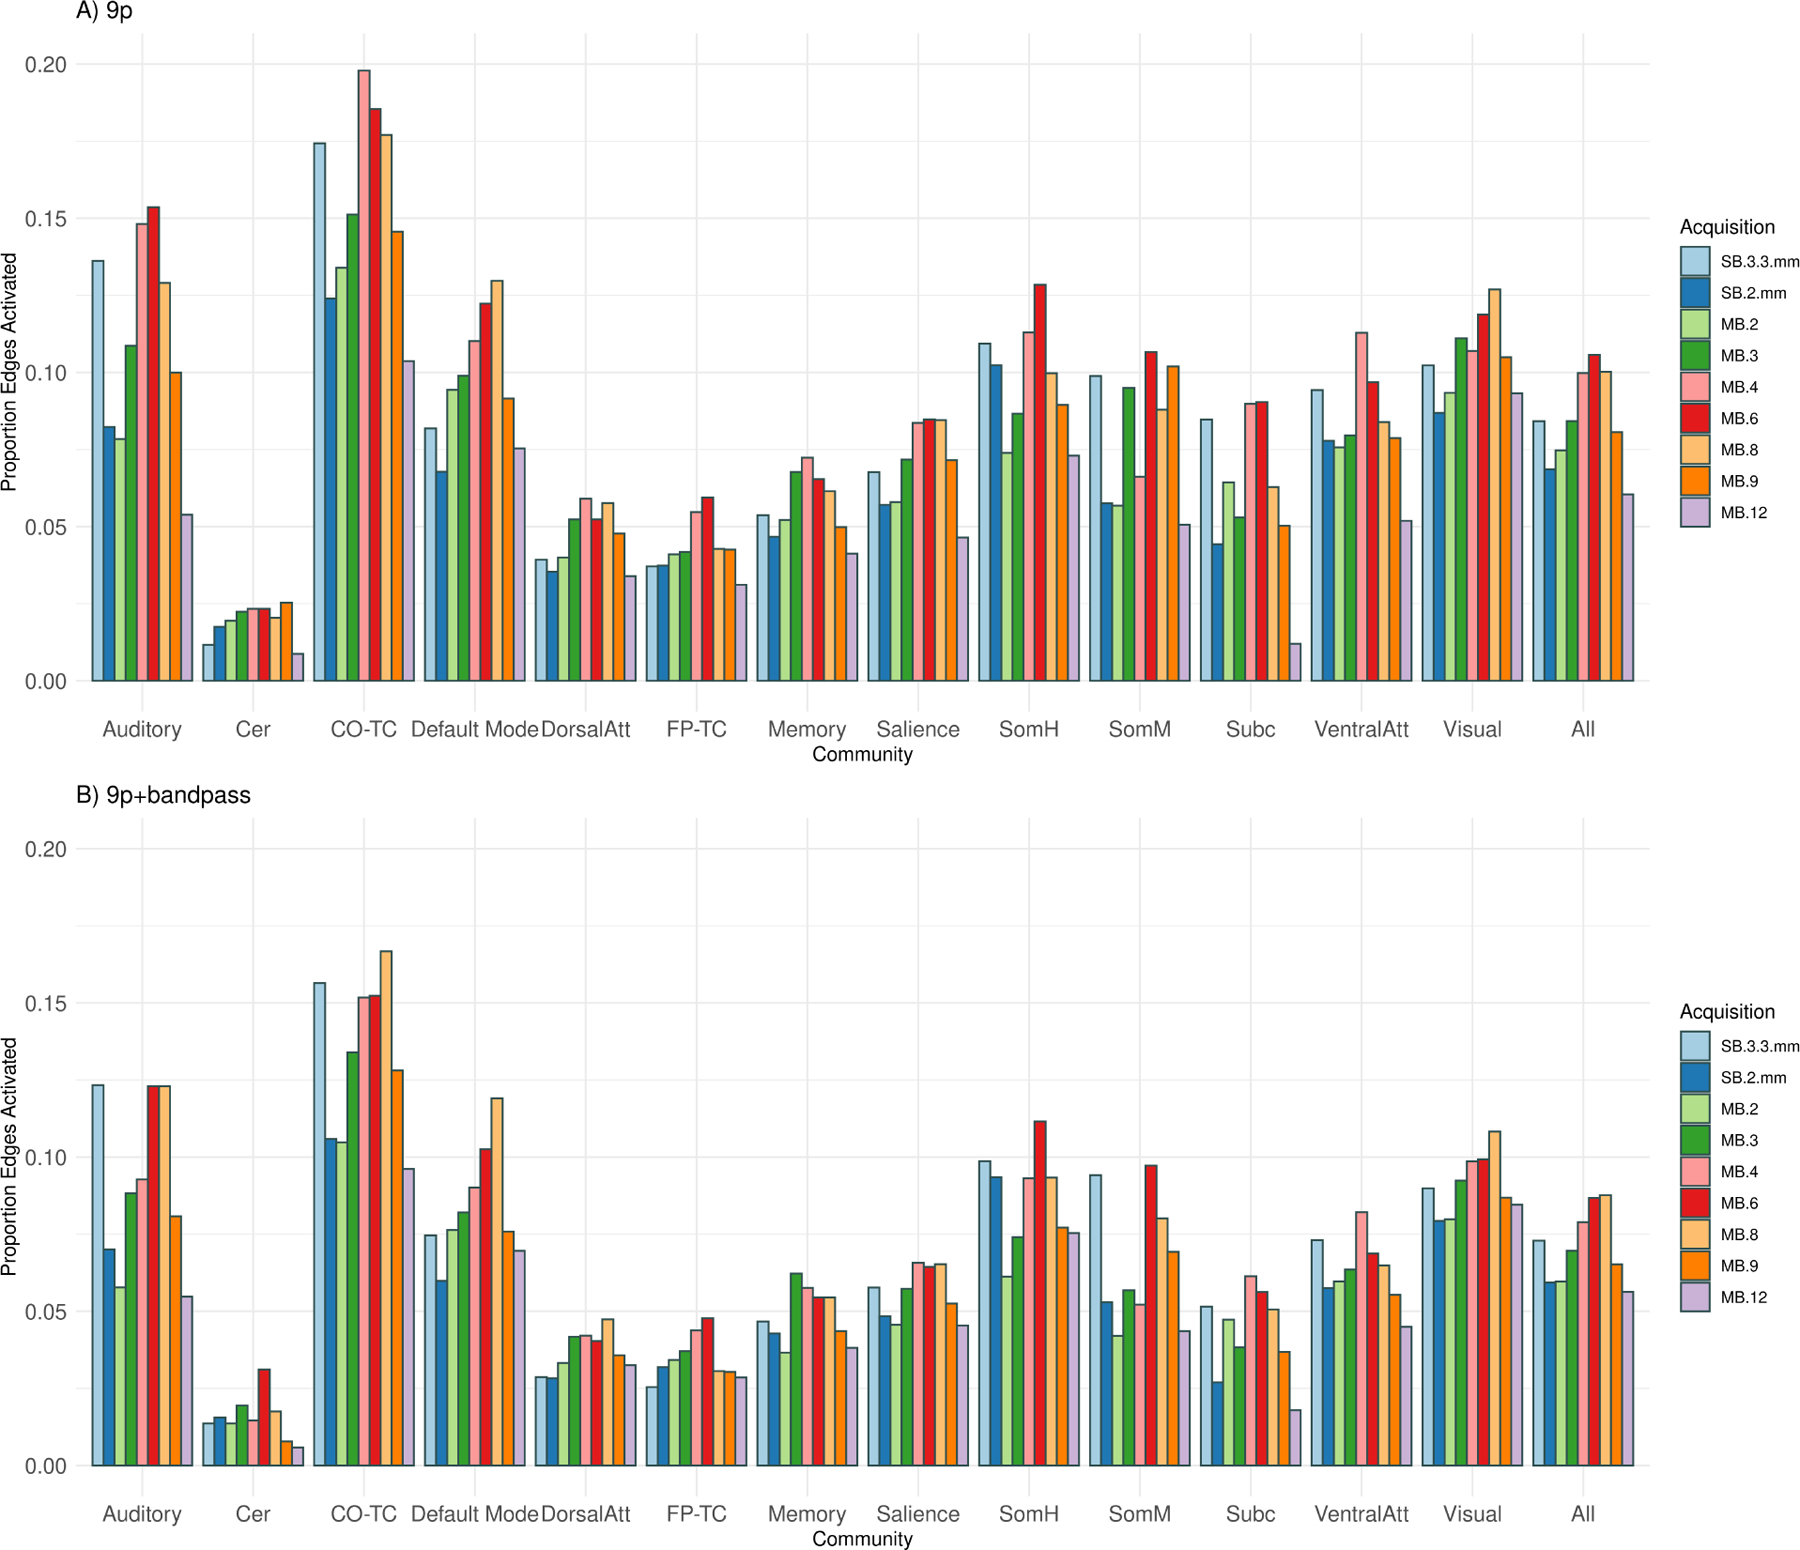
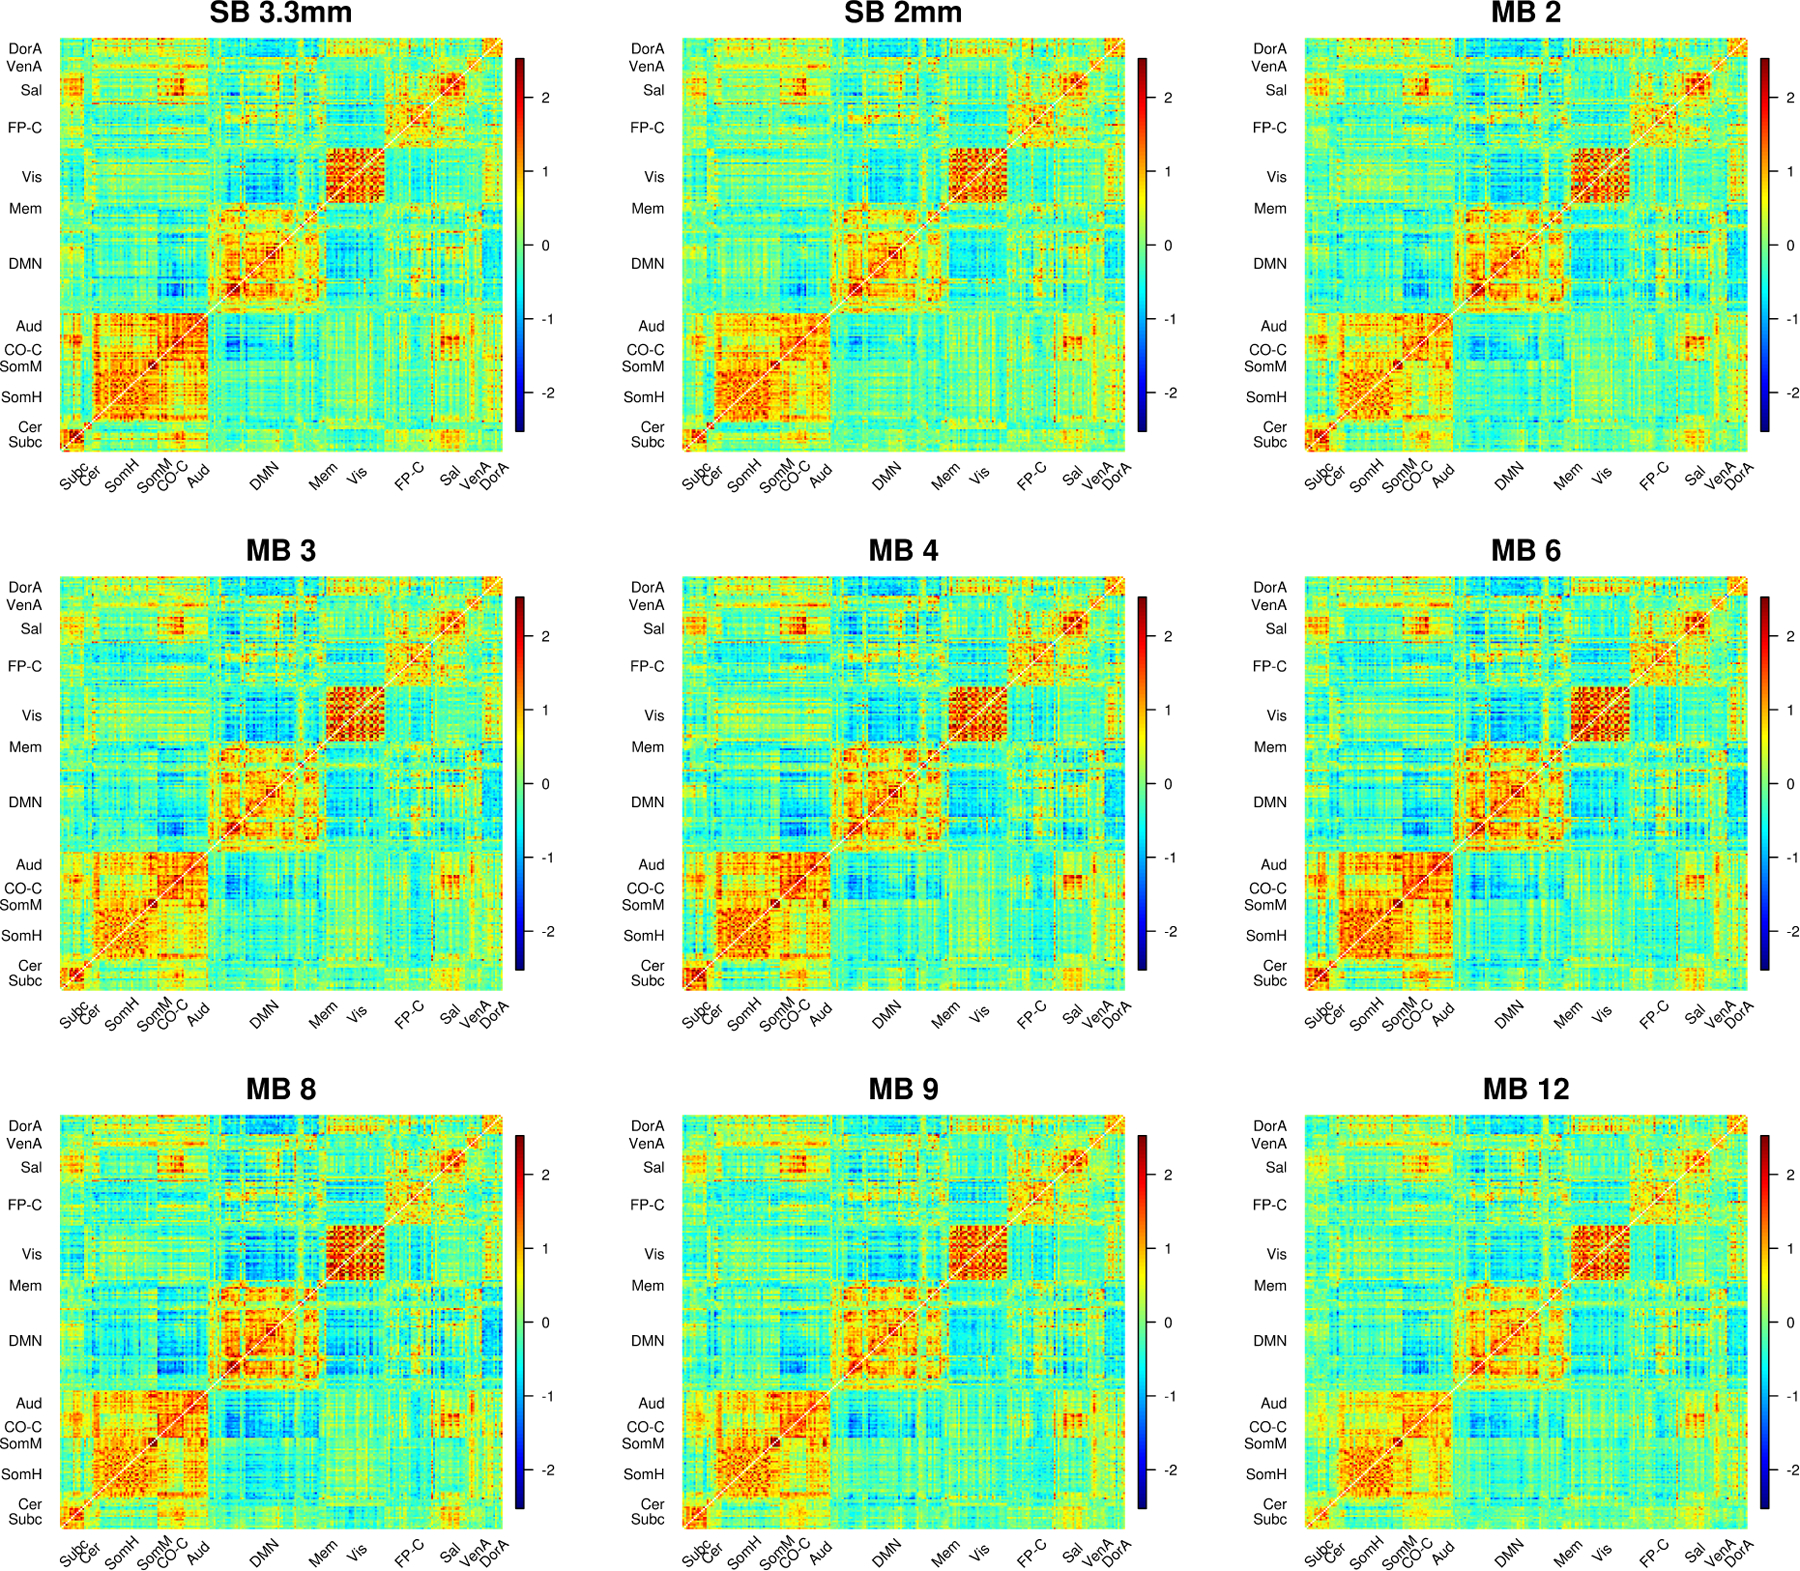
Multiband acquisition, also called simultaneous multislice, has become a popular technique in resting-state functional connectivity studies. Multiband (MB) acceleration leads to a higher temporal resolution but also leads to spatially heterogeneous noise amplification, suggesting the costs may be greater in areas such as the subcortex. We evaluate MB factors of 2, 3, 4, 6, 8, 9, and 12 with 2 mm isotropic voxels, and additionally 2 mm and 3.3 mm single-band acquisitions, on a 32-channel head coil. Noise amplification was greater in deeper brain regions, including subcortical regions. Correlations were attenuated by noise amplification, which resulted in spatially varying biases that were more severe at higher MB factors. Temporal filtering decreased spatial biases in correlations due to noise amplification, but also tended to decrease effect sizes. In seed-based correlation maps, left-right putamen connectivity and thalamo-motor connectivity were highest in the single-band 3.3 mm protocol. In correlation matrices, MB 4, 6, and 8 had a greater number of significant correlations than the other acquisitions (both with and without temporal filtering). We recommend single-band 3.3 mm for seed-based subcortical analyses, and MB 4 provides a reasonable balance for studies analyzing both seed-based correlation maps and connectivity matrices. In multiband studies including secondary analyses of large-scale datasets, we recommend reporting effect sizes or test statistics instead of correlations. If correlations are reported, temporal filtering (or another method for thermal noise removal) should be used. The Emory Multiband Dataset is available on OpenNeuro.

Keywords: Acceleration; Functional connectivity; Noise amplification; Putamen; Simultaneous multislice; Subcortical; Temporal resolution; Thalamus.


Conflict of interest statement

Declaration of Competing Interest None.

Figures

Figure 1:
Figure 1:
Noise amplification due to multiband acceleration and impacts of bandpass filtering. The standard deviation of the time series for each voxel (averaged across subjects) with 9p preprocessing (columns A and C) and 9p+bandpass (columns B and D). Sagittal slice with cursor at MNI=0. At higher MB factors, variance from noise amplification becomes more prominent. Columns A and B use a scale from 0 to 300, and columns C and D are the same data but using a scale from 0 to 150. As the MB factor increases, there is a shift from the physiologically dominated noise regime (in which the CSF pulsation is visible in the central canal, third ventricle, cerebral aqueduct, and fourth ventricle, with possible contributions from the superior and inferior sagittal sinus) to physiological plus noise amplification. The bandpass filtering reduces the overall variance and physiological contributions of CSF, veins, and arteries. In the rescaled version (column D), some ventricles, veins, and arteries are still visible at higher MB factors but less prominent.
Figure 2:
Figure 2:
Correlation (A,B) and Cohen’s d maps thresholded to display values >0.4 (C,D) for the dorsal rostral putamen seed (MNI: 25, 8, 6) shown at MNI axial slice 6. The arrows in column A highlight the cingulate cortex (red), insula (fuchsia), and thalamus (green). Spatial biases in the correlations increase as MB factor increases; ipsilateral correlations with the thalamus and insula, as well as contralateral correlations are not apparent for MB 8 and higher in preprocessing without temporal filtering (A). These biases are reduced with bandpass filtering (B), which results in clear left-right putamen functional connectivity in MB 2 to MB 8. Effect sizes are larger in single-band 3.3 mm.
Figure 3:
Figure 3:
Correlation (A,B) and Cohen’s d maps thresholded to display values >0.3 (C,D) for the motor seed (MNI: −41, −20, 62) at coronal slice −24 to examine motor-thalamic pathways. The green arrow points to the thalamus. Thalamocortical connectivity is clearly apparent in the SB 3.3 mm acquisition, with smaller but notable effect sizes in the MB 2 to MB 6 acquisitions.
Figure 4:
Figure 4:
Scatterplots comparing correlations in SB to different MB acquisitions using 9p processing (left) and 9p+bandpass (right). The black line occurs at y = x, and points below the line in the quadrant x > 0, y > 0 represent positive correlations that are attenuated in the MB acquisition. Points above the line in x < 0, y < 0 represent negative correlations that are attenuated at the higher MB factors. Points are colored by their g*-factors, which are defined for each pipeline; see (6). In the 9p pipeline, the g*-factors are larger at higher MB factors, and points with high g-factors tend to lie closer to the line y = 0. In the 9p+bandpass, the g*-factors are closer to one, even at higher MB factors, and the points tend to fall closer to the line y = x.
Figure 5:
Figure 5:
Correlations decrease as noise amplification increases. Fisher z-transformed correlations in a subset of edges that were a priori expected to have positive correlations, as described in Section 3.5.1 Impacts on the magnitude of correlations, were analyzed using a generalized additive mixed model. The overall effect of g*-factor was highly significant (p < 0.001). The GAMM includes a smoother for g*-factor with penalty selected using REML, fixed effects for edge, gender, and scanner, and random effects for participant and participant × edge. The y-intercept in this figure corresponds to the edge with median correlation (nodes 92 and 109, default mode). Gray indicates point-wise 95% confidence intervals.
Figure 6:
Figure 6:
Average correlations (Fisher z-transformed) for SB and MB acquisitions. 9p processing is above the diagonal and 9p+bandpass below. In 9p, the effects of acceleration differ across space, e.g., we see smaller correlations involving salience, auditory, cingulo-opercular task control, and subcortical regions in MB 12 than MB 4; a close inspection reveals MB 8 also tends to be lower than MB 4 in these edges. In contrast, correlations are more comparable within the visual system across most acquisitions. In 9p+bandpass, the correlations across MB factor are more similar (below diagonal). Web Supplement Figure S.8 depicts a zoomed in version of subcortical and cerebellar edges that more clearly illustrates lower correlations at higher MB factors for these regions. Web Supplement S.9 and S.10 illustrate impacts on edges that are expected to have positive correlations.
Figure 7:
Figure 7:
Edge density (number of significant correlations) for thirteen communities (auditory, cerebellum, cingulo-opercular task control, default mode, dorsal attention, fronto-parietal task control, memory, salience, somatomotor hand, somatomotor mouth, subcortical, ventral attention, and visual) and across all edges (all). The edge density for a community is defined as the proportion of significant one-sample t-statistics (using the Bonferroni-corrected α-level) for the Fisher z-transformed correlations for each edge in which at least one of the nodes is in the community. A) The number of significant correlations with 9p preprocessing tended to be higher in MB 6, MB 4, and MB 8, with the relative ranking of SB 3.3 mm depending on the community, and SB 2 mm, MB 2, MB 3, MB 9, and MB 12 tending to perform worse. Permutation tests of significant differences between MB factors appear in Web Supplement Table S.2. Similar results were obtained with 9p+spatial smoothing, shown in Web Supplement Table S.3. B) The rankings with 9p+bandpass were similar to 9p, with MB 8, 6 and 4 tending to be higher than others and SB 2 mm, MB 2, MB 9, and MB 12 lower. Permutation tests of significant differences between MB factors appear in Web Supplement Table S.4. Overall, 9p+bandpass had lower edge density compared to 9p, with significant differences displayed in Web Supplement Table S.5.
Figure 8:
Figure 8:
Cohen’s d for SB and MB acquisitions. Cohen’s d statistic is formed for the one-sample t-test of the null hypothesis that the Fisher z-transformed correlation is equal to zero. Cohen’s d for 9p preprocessing is above the diagonal and 9p+bandpass below the diagonal. Compared to the correlations in Figure 6, effect size matrices in 9p and 9p+bandpass look more similar. A close examination reveals some differences. For example, the subcortical to salience connections tend to be stronger in MB 4 and MB 6 than MB 3 and MB 9 in 9p, and these effect sizes tend to be reduced in 9p+bandpass. In general, there were some significant differences between MB factors, as illustrated in Web Supplement Tables S.2 and S.4, and 9p+bandpass tended to have lower effect sizes than 9p, as illustrated in Web Supplement Table S.5.

References

    1. Akçakaya M, Moeller S, Weingärtner S, and Uğurbil K (2019). Scan-specific robust artificial-neural-networks for k-space interpolation (RAKI) reconstruction: Database-free deep learning for fast imaging. Magnetic Resonance in Medicine, 81(1):439–453. - PMC - PubMed
    1. Andersson JL, Skare S, and Ashburner J (2003). How to correct susceptibility distortions in spin-echo echo-planar images: Application to diffusion tensor imaging. NeuroImage, 20(2):870–888. - PubMed
    1. Arbabshirani MR, Damaraju E, Phlypo R, Plis S, Allen E, Ma S, Mathalon D, Preda A, Vaidya JG, Adali T, and Calhoun VD (2014). Impact of autocorrelation on functional connectivity. NeuroImage, 102(P2):294–308. - PMC - PubMed
    1. Bastian AJ and Thach WT (1995). Cerebellar outflow lesions: A comparison of movement deficits resulting from lesions at the levels of the cerebellum and thalamus. Annals of Neurology. - PubMed
    1. Bhandari R, Kirilina E, Caan M, Suttrup J, de Sanctis T, De Angelis L, Keysers C, and Gazzola V (2019). Does higher sampling rate (Multiband + SENSE) benefit the detection of task correlated BOLD for cognitive neuroscience applications at 3T? bioRxiv, page 762831.

Publication types