. 2021 May:58:160-168.
doi: 10.1016/j.mito.2021.03.003. Epub 2021 Mar 18.

Complex I protein NDUFS2 is vital for growth, ROS generation, membrane integrity, apoptosis, and mitochondrial energetics

Affiliations

Complex I protein NDUFS2 is vital for growth, ROS generation, membrane integrity, apoptosis, and mitochondrial energetics

Aloka B Bandara et al. Mitochondrion. 2021 May.

Abstract

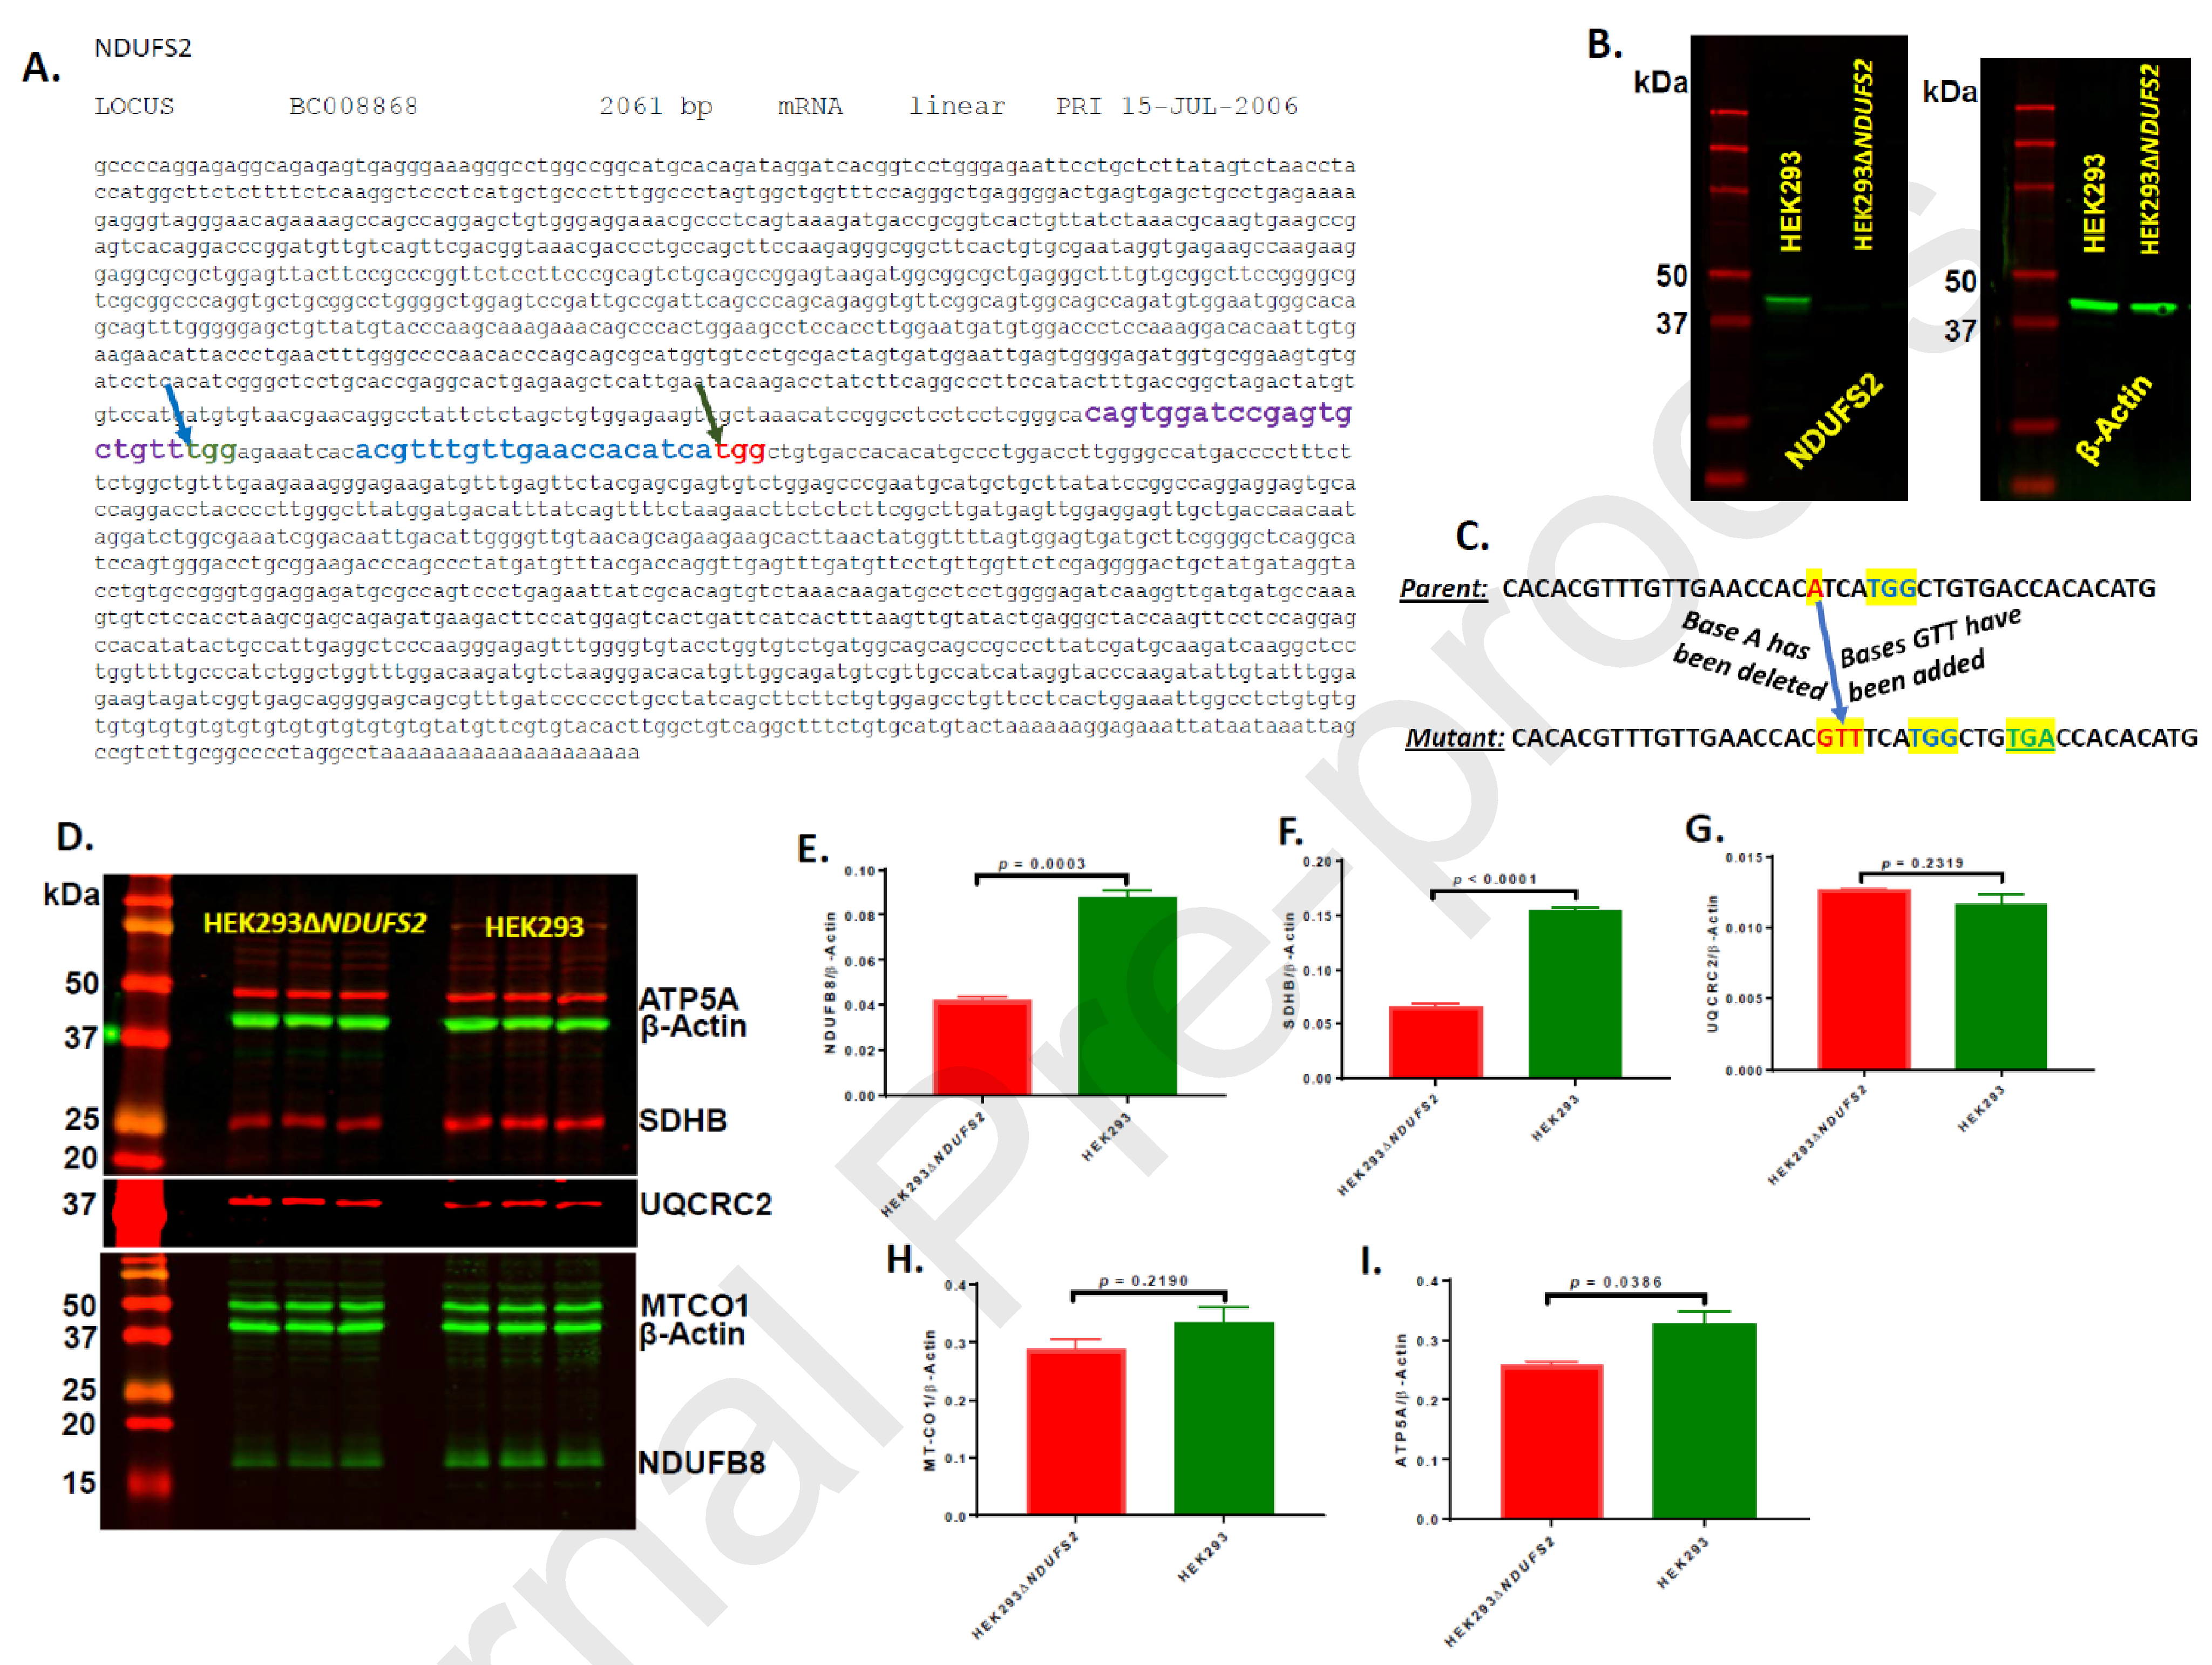
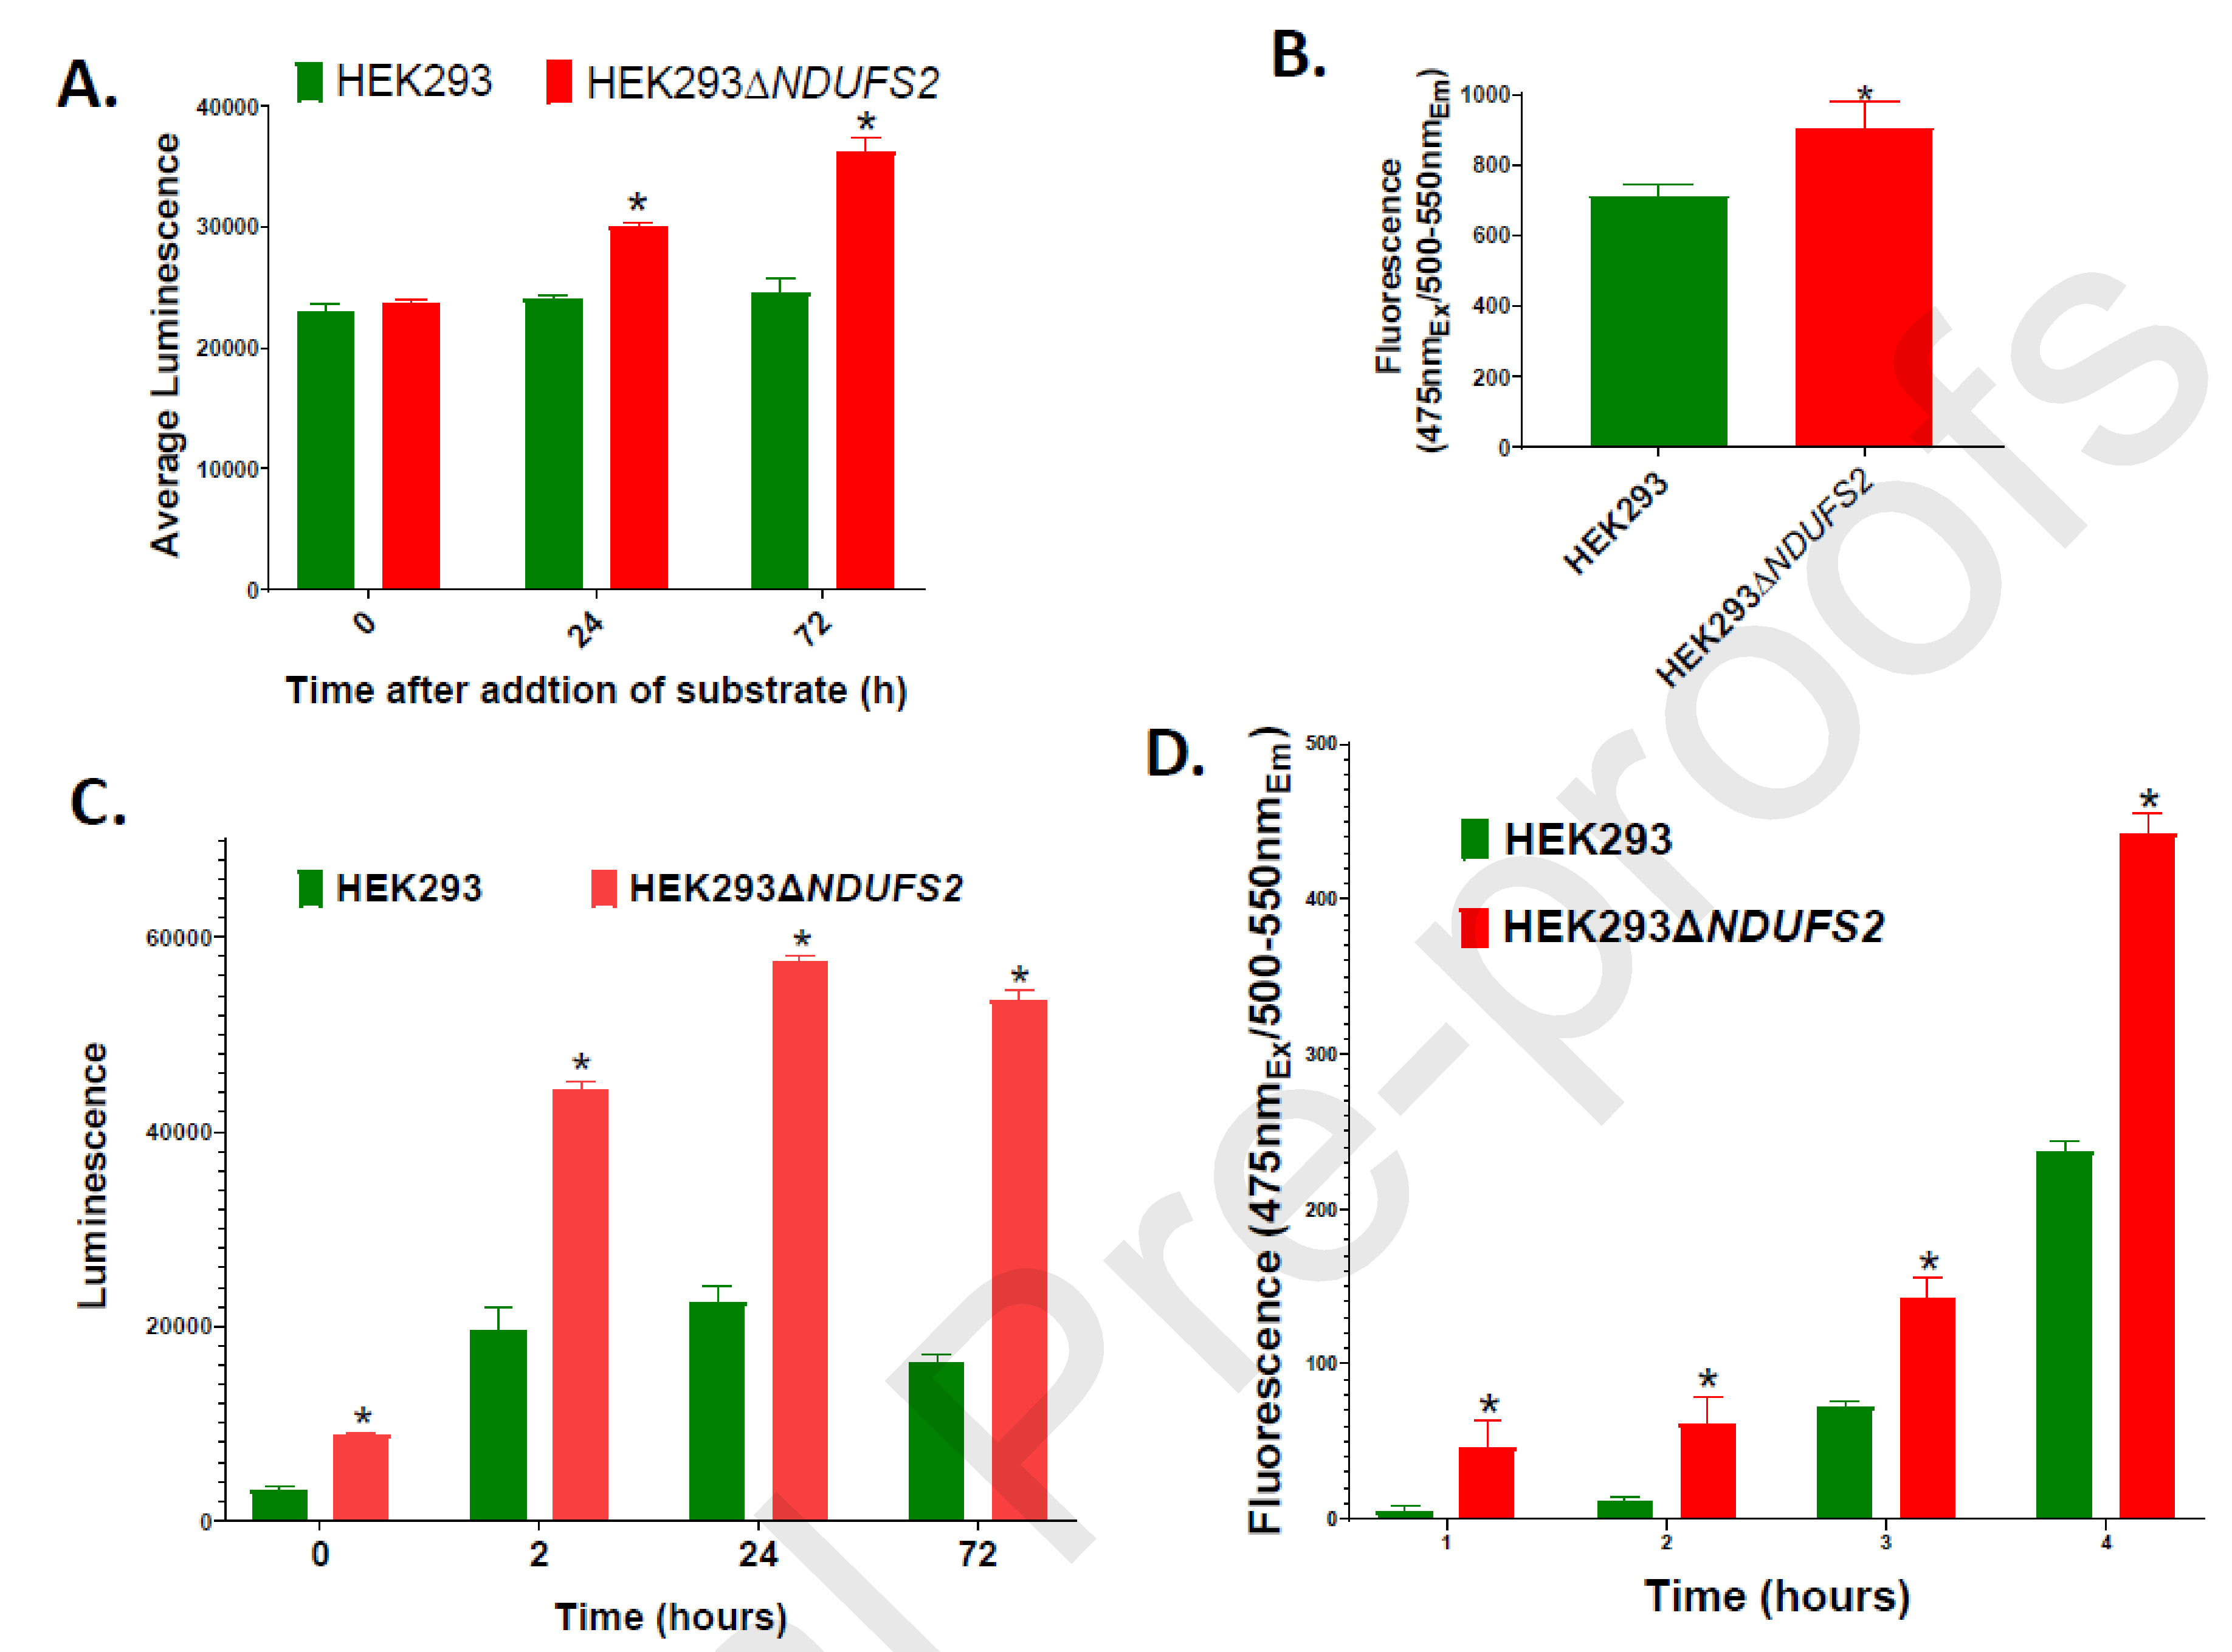
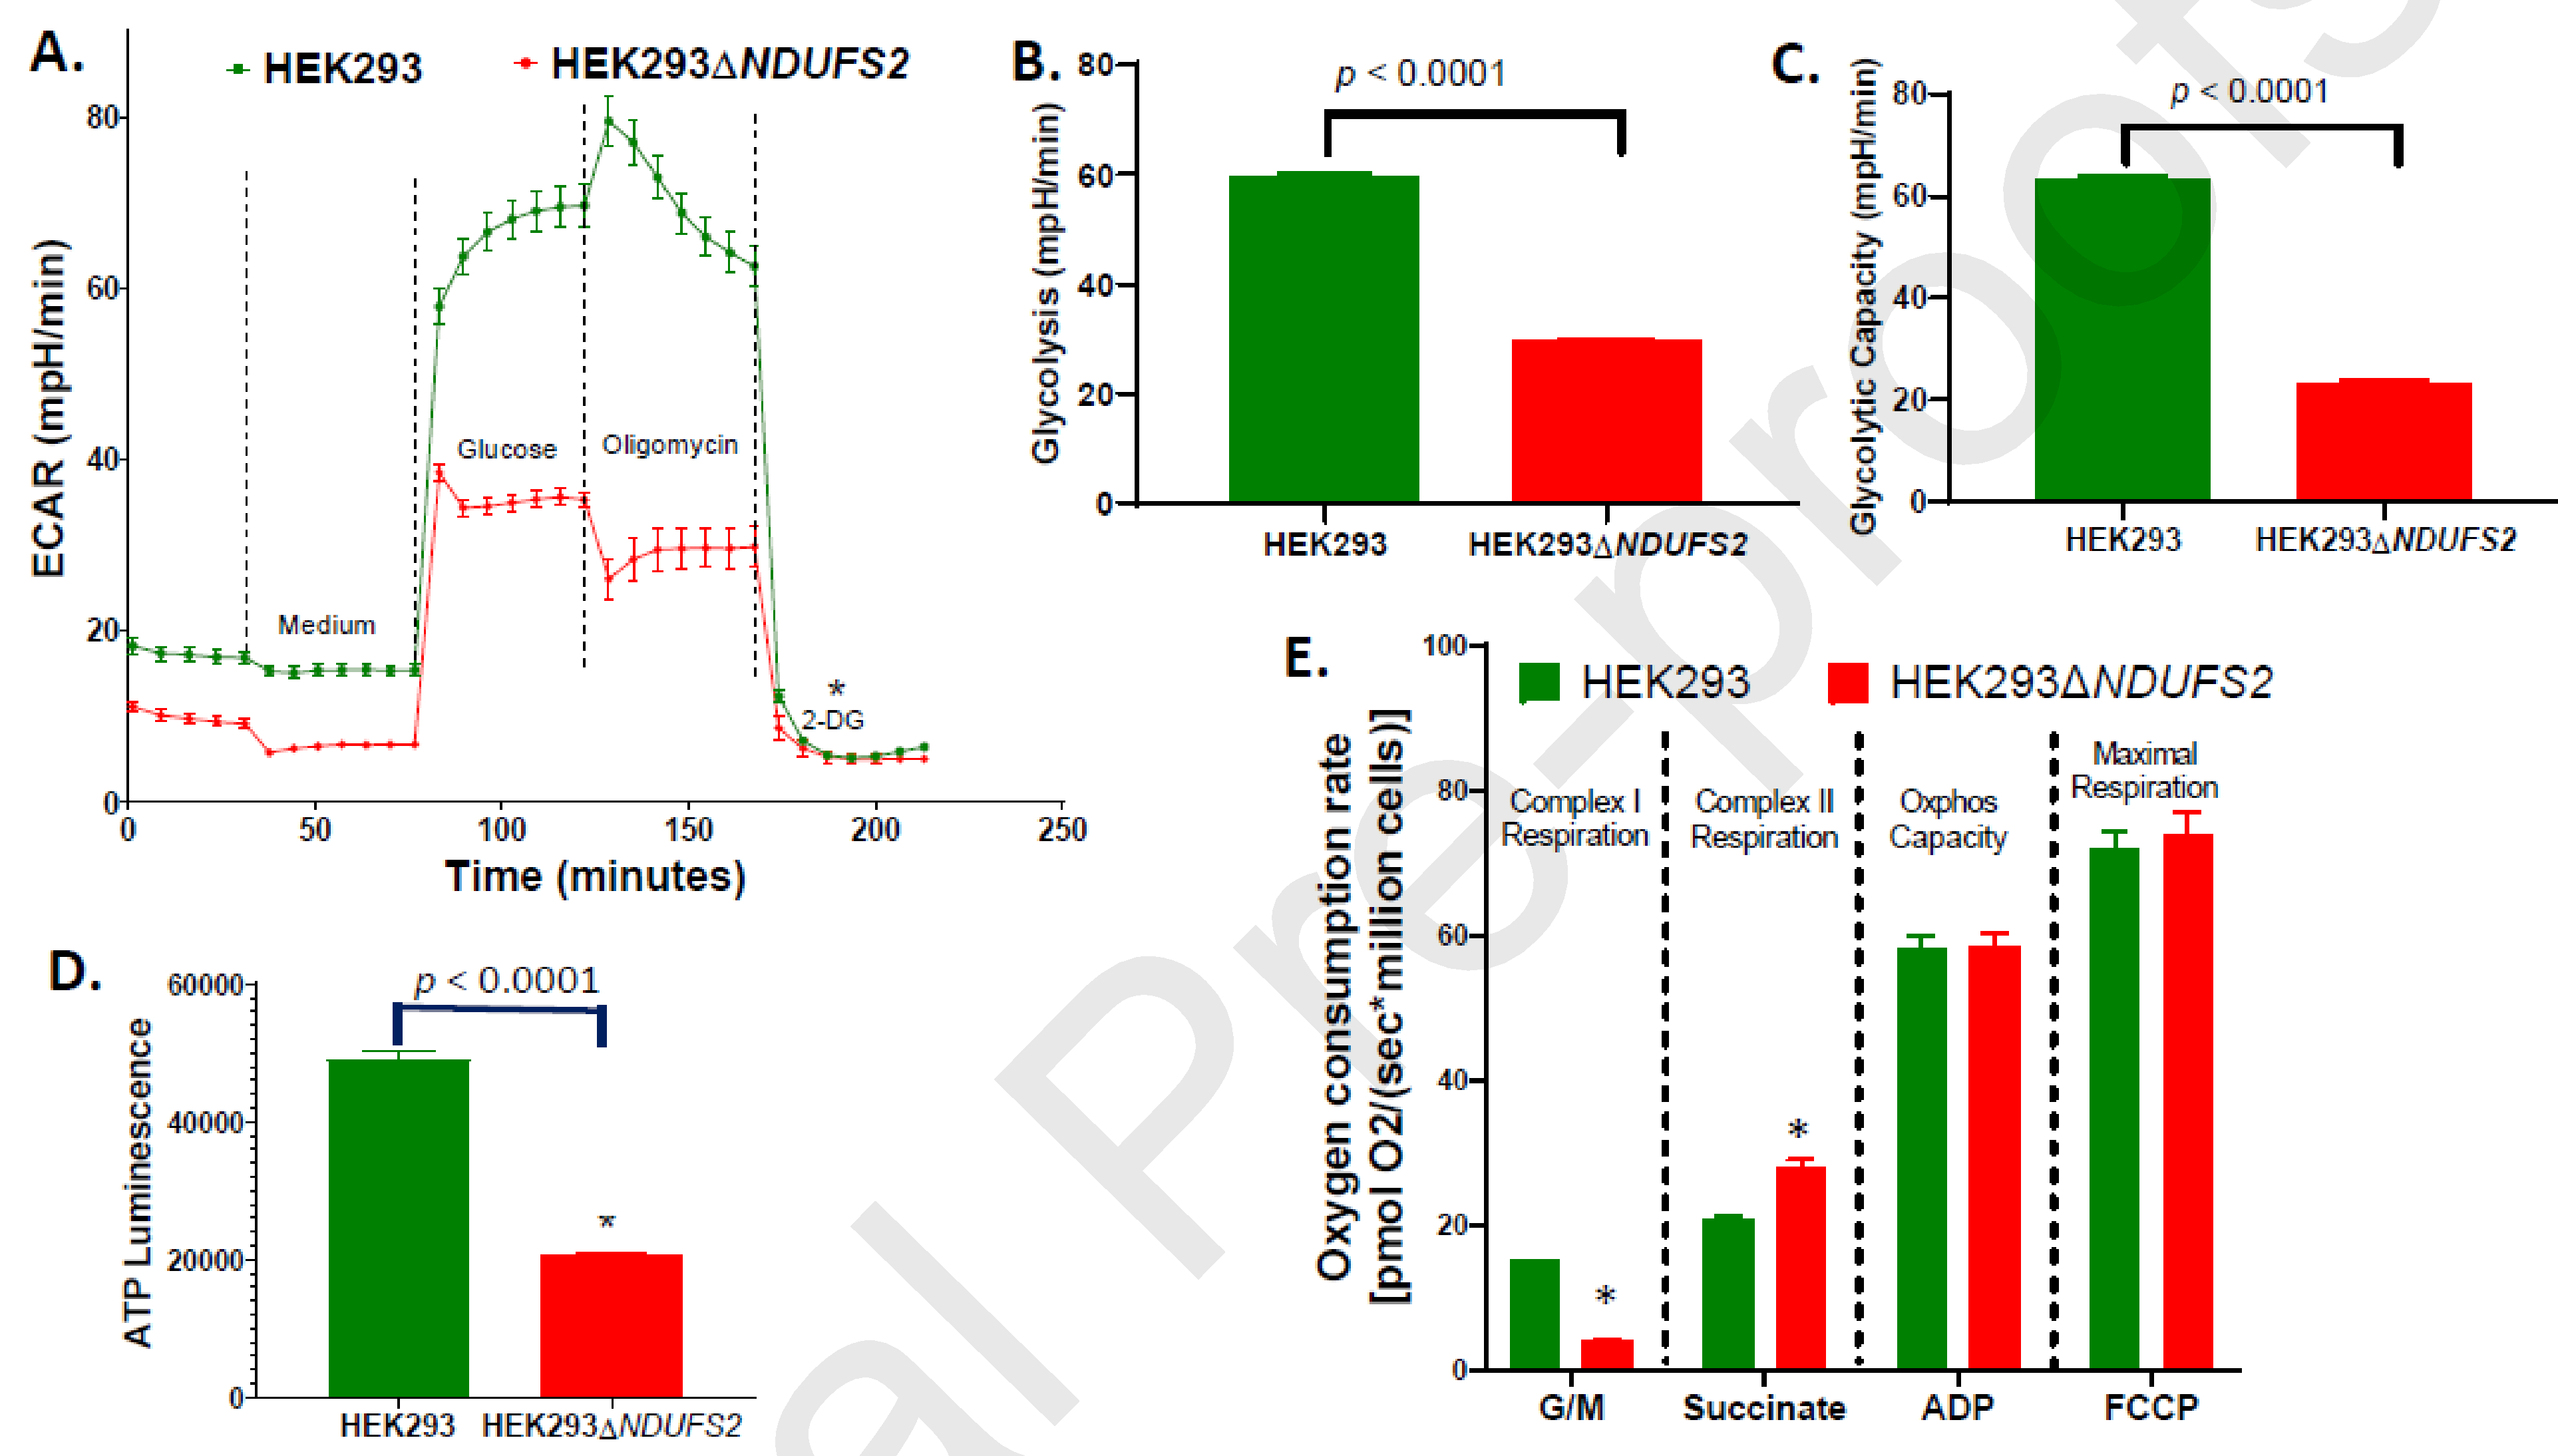
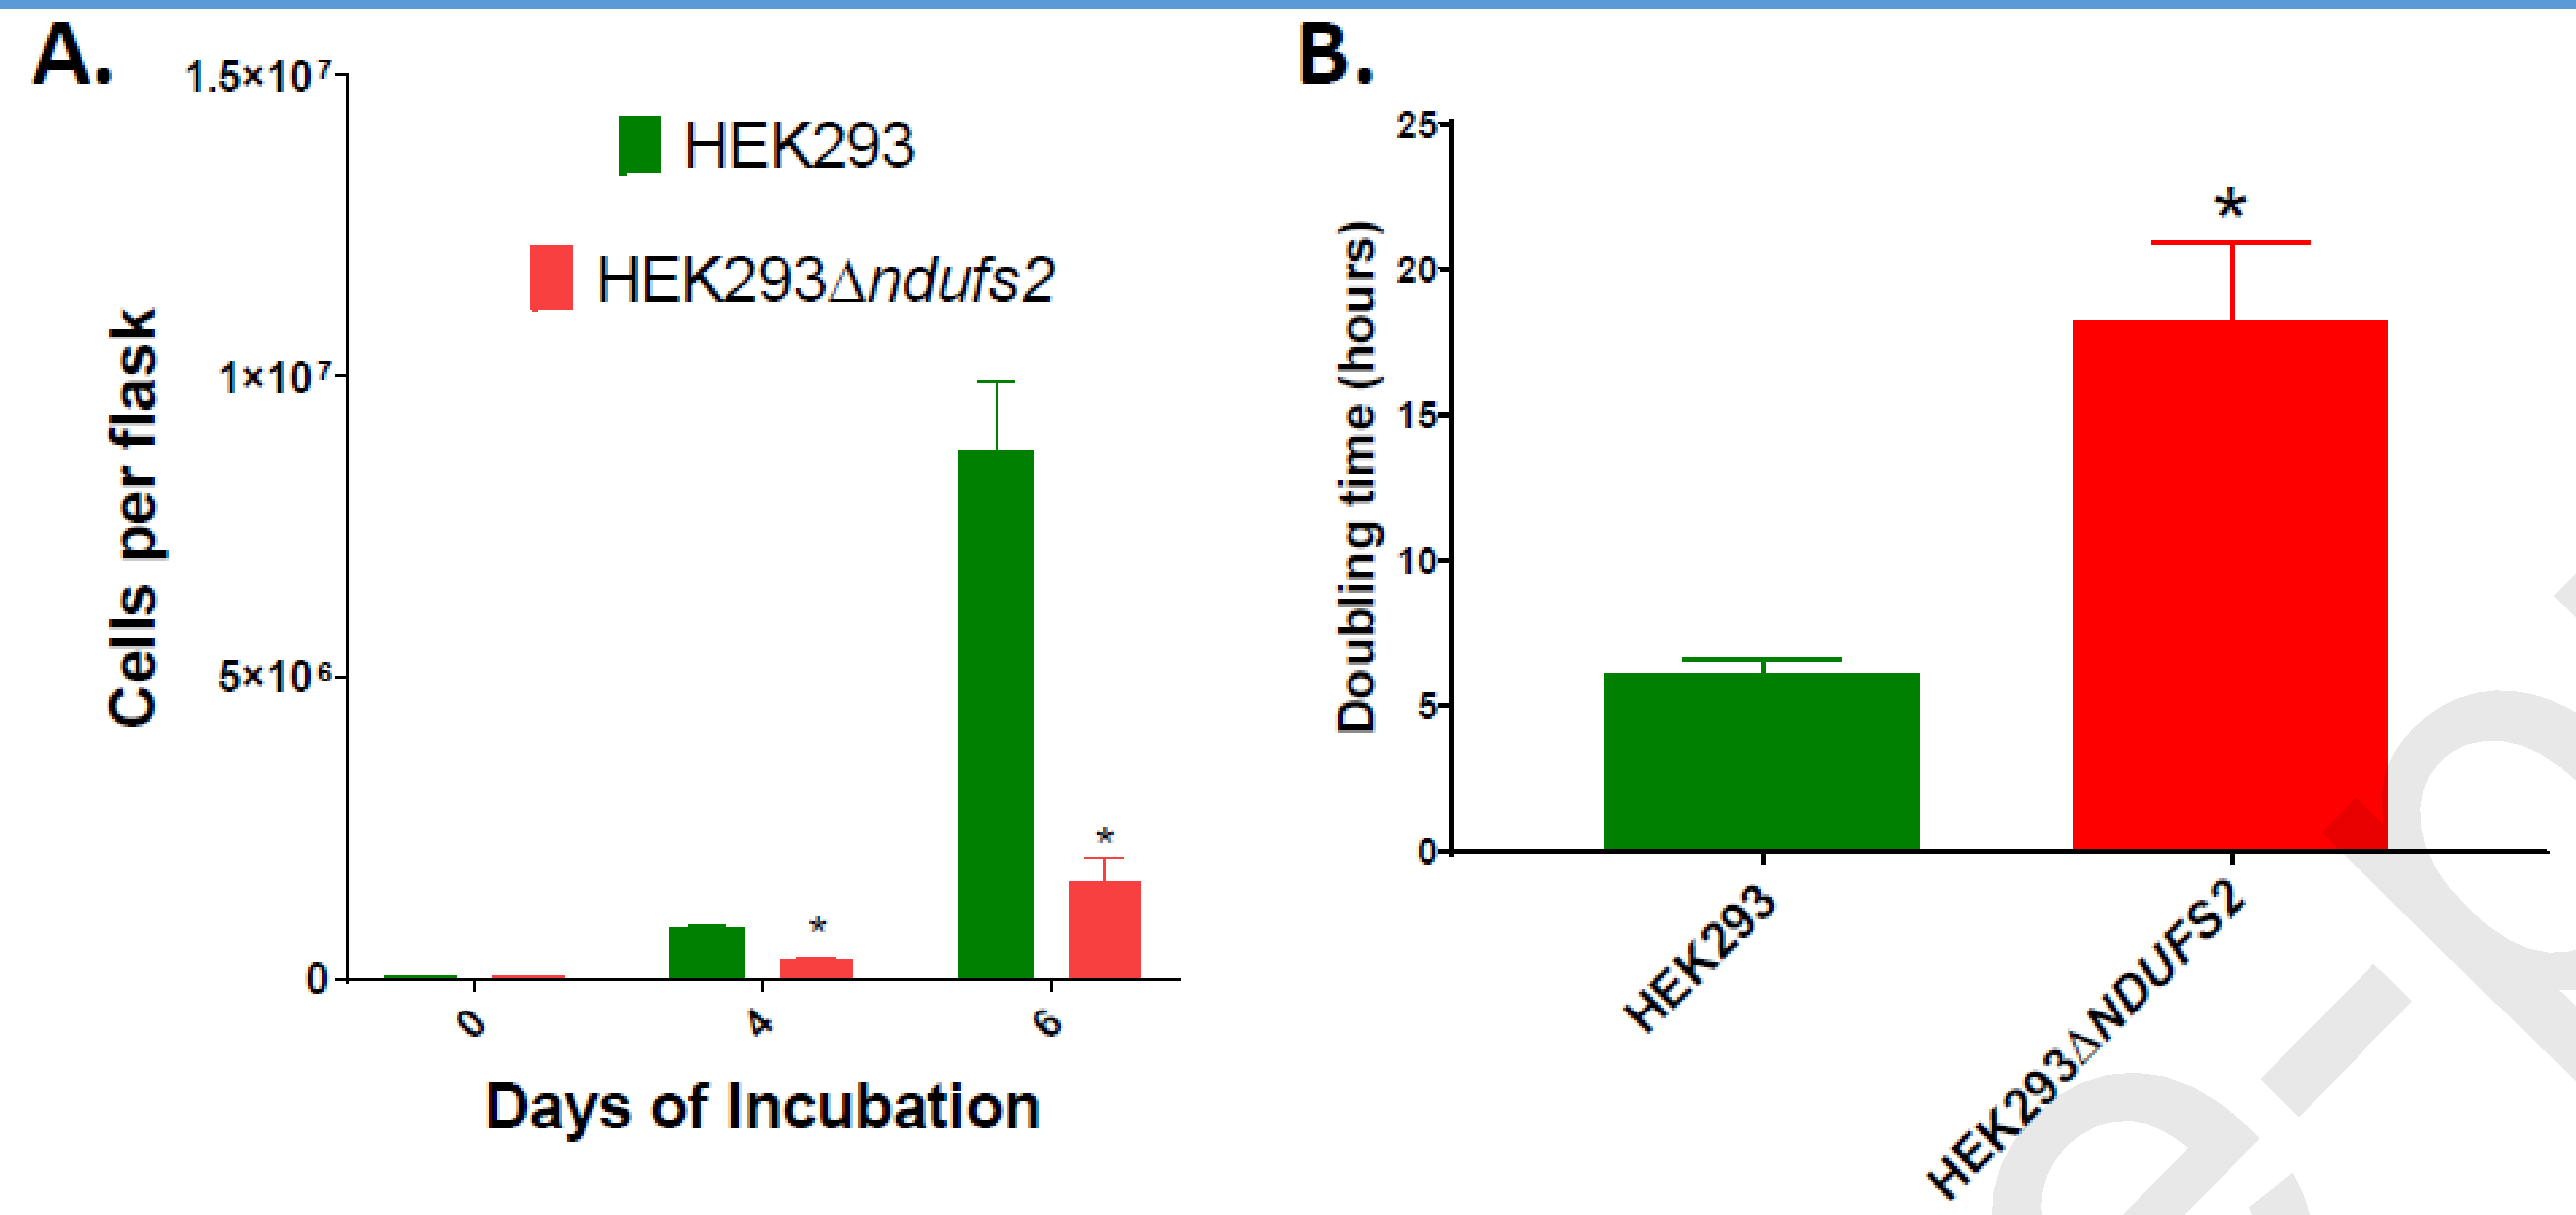
Complex I is the largest and most intricate of the protein complexes of mitochondrial electron transport chain (ETC). This L-shaped enzyme consists of a peripheral hydrophilic matrix domain and a membrane-bound orthogonal hydrophobic domain. The interfacial region between these two arms is known to be critical for binding of ubiquinone moieties and has also been shown to be the binding site of Complex I inhibitors. Knowledge on specific roles of the ETC interfacial region proteins is scarce due to lack of knockout cell lines and animal models. Here we mutated nuclear encoded NADH dehydrogenase [ubiquinone] iron-sulfur protein 2 (NDUFS2), one of three protein subunits of the interfacial region, in a human embryonic kidney cell line 293 using a CRISPR/Cas9 procedure. Disruption of NDUFS2 significantly decreased cell growth in medium, Complex I specific respiration, glycolytic capacity, ATP pool and cell-membrane integrity, but significantly increased Complex II respiration, ROS generation, apoptosis, and necrosis. Treatment with idebenone, a clinical benzoquinone currently being investigated in other indications, partially restored growth, ATP pool, and oxygen consumption of the mutant. Overall, our results suggest that NDUFS2 is vital for growth and metabolism of mammalian cells, and respiratory defects of NDUFS2 dysfunction can be partially corrected with treatment of an established mitochondrial therapeutic candidate. This is the first report to use CRISPR/Cas9 approach to construct a knockout NDUFS2 cell line and use the constructed mutant to evaluate the efficacy of a known mitochondrial therapeutic to enhance bioenergetic capacity.

Keywords: ATP synthesis; Apoptosis; CRISPR/Cas9; Complex I; Electron transport chain; Glycolysis; Idebenone; Necrosis; Oxygen consumption; ROS; Respiration.


Conflict of interest statement

COMPETING INTERESTS

Authors declare no competing interests.

Figures

Figure 1.
Figure 1.. Construction of the NDUFS2 mutant.
The gene sequence of NDUFS2 with CRISPR targeting sites is shown (A). The sgRNA and PAM sequences predicted by the online CRISPOR program are depicted in purple and green colors, respectively; the specific site for mutation (at 970-bp) is shown with a blue-arrow. The sgRNA and PAM sequences predicted by the online idtdna program are depicted in blue and red colors, respectively; the specific site for mutation (at 1002-bp) is shown with a green-arrow. Expression of NDUFS2 protein is shown (B). The protein extracts reacted with rabbit polyclonal antibodies to NDUFS2 and rabbit polyclonal antibodies to ß-Actin are shown. The DNA level recombination events in the genome of the mutant are illustrated (C). The targeted PAM sequence of TGG is shown highlighted and in blue color. The base A (highlighted and in red color) of the parent has been replaced with bases GTT (highlighted and in red color) in the mutant. These events generated a TGA stop codon (highlighted and in green color) downstream of the PAM sequence of mutant genome. Expression of representative subunits from all five ETC complexes are shown (D – I). The expression of NDUFB8 (complex I; D and E), SDHB (complex II; D and F), UQCRC2 (complex III; D and G), MTCO1 (complex IV; D and H), and ATP5A (complex V; D and I) were normalized to the expression of ß-Actin.
Figure 2.
Figure 2.. ROS production, membrane porousness, apoptosis, and necrosis of cell lines.
ROS generation measured using ROS-Glo H2O2 Assay is shown (A). The measurements are expressed as total luminescence per 15,000 cells. The mean values were compared between the parent HEK293 and the mutant HEK293△NDUFS2. The p values for the differences between the mean values were 0.3893, < 0.0001, and < 0.0001 respectively at 0, 24, and 72 hours after addition of substrate to the reaction. Membrane porousness measured using Mitochondrial ToxGlo Assay is shown (B). Measurements are expressed as total fluorescence per 10,000 cells (p = 0.027). Apoptosis (C) and necrosis (D) per 15,000 cells measured using RealTime-Glo Annexin V Apoptosis and Necrosis Assay at 0, 2, 24, and 72 hours of incubation are shown. Apoptosis measurements are expressed as total luminescence; the p value for the differences between the mean values was < 0.0001 for each time point. Necrosis measurements are expressed as total fluorescence; the p values for the differences between the mean values were 0.0085, 0.0115, 0.0002, and < 0.0001 respectively at 0, 2, 24, and 72 h post-incubation. The mean values significantly different between two cell lines are indicated by *. Error bars represent the SE of the mean. The number of wells per cell line is n = 12 for each parameter.
Figure 3.
Figure 3.. Respiration, glycolysis, and ATP synthesis of cell lines.
ECAR measured using Agilent Seahorse XFe96 analyzer of 20,000 live cells/well (A), and calculated glycolysis (B) and glycolytic capacity (C) are shown. The mean values were compared between the parent HEK293 and the mutant HEK293△NDUFS2. The number of wells per cell line is n = 12. ATP synthesis of parent and mutant cells measured using Mitochondrial ToxGlo Assay (D) is shown. The measurements are expressed as total luminescence per 10,000 cells. The number of wells per cell line is n = 12. Oxygen consumption measured using Oroboros O2k per million saponin-repermeabilized cells of the parent or the mutant in response to exposure of glutamate-malate (G/M), succinate, ADP, and FCCP is shown (E). The number of chambers per cell line is n = 6. The p values for the differences between the mean values were < 0.0001, 0.001, 0.747, and 0.645 respectively for complex I respiration, complex II respiration, OXPHOS capacity, and maximal respiration. The mean values significantly different between two cell lines are indicated by *. Error bars represent the SE of the mean.
Figure 4.
Figure 4.. Respiration of cell lines measured by Seahorse assay.
Oxygen consumption rate (OCR) was measured using Agilent Seahorse XFe96 of parent HEK293 cells treated DMSO (Parent+DMSO), parent cells treated 1μM idebenone (Parent+ldeb), mutant HEK293△NDUFS2 cells treated DMSO (Mutant+DMSO), and mutant cells treated 1μM idebenone (Mutant+ldeb). OCR per 20,000 permeabilized cells (A), and the calculated basal respiration (B), reserve respiratory capacity (C) and maximal respiratory capacity (D) are shown. The number of wells per cell line is n = 12. The mean OCR values were compared between the parent versus the mutant or DMSO treatment versus idebenone treatment. Error bars represent the SE of the mean.
Figure 5.
Figure 5.. Growth of cell lines.
The number of cells harvested after four and six days of culture (A) and doubling times (B) of parent HEK293 and mutant HEK293△DUFS2 cell lines are shown. The p values for the differences between the means of two cell lines were 0.019 for cell numbers at day 4, 0.027 for cell numbers at day 6, and 0.0477 for doubling time. The number of cells recovered from the mutant cultures treated with 0.5, 1, or 5 μM idebenone or DMSO control are shown (C). The p value for the differences in cell numbers between DMSO control versus treatment with idebenone at 0.5, 1 and 5 μM were 0.0011, 0.9577 and 0.9954, respectively. The number of flasks per cell line is n = 3. The mean values significantly different between cell lines/treatments are indicated by *. Error bars represent the SE of the mean.
Figure 6.
Figure 6.. Restoration or improvements of growth and respiration of cell lines.
Oxygen consumption per million permeabilized cells of the mutant HEK293△NDUFS2 treated with DMSO or idebenone was measured by Oroboros O2k respirometry (A). The number of chambers per cell line is n = 6. The p values for the differences between the mean values of DMSO control versus idebenone treatment were 0.3215, <0.0001, 0.0078, 0.0018, and 0.0046, respectively. Representative O2k oxygraphs of mutant cells treated with DMSO (B top) or 1 μM idebenone (B bottom) are shown. In this assay, permeabilized mutant cells were treated with DMSO or idebenone for 30 min prior to loading them into the O2k chambers. O2 slope neg. [pmol/(s*mL)] presented in red line was collected subsequent to injection of glutamate+malate (G/M), rotenone (Rot), succinate (Succ), ADP, and FCCP into the chamber. ATP pools of the mutant cells treated with idebenone for six days is shown (C). The measurements are expressed as luminescence normalized to the values of DMSO control. The number of wells per cell line is n = 12. The p value for the difference between DMSO control and idebenone treatment was 0.0101. The growth of DMSO or idebenone treated cells was measured (D). The number of cells recovered from the mutant cultures treated with 0.5, 1, or 5 μM idebenone or DMSO control is shown. The number of flasks per cell line is n = 3. The p value for the differences in cell numbers between DMSO control versus treatment with idebenone at 0.5, 1 and 5 μM were 0.0011, 0.9577 and 0.9954, respectively. Oxygen consumption per million permeabilized cells of the parent HEK293 treated with DMSO or idebenone was measured by Oroboros O2k respirometry (E). The number of chambers per cell line is n = 6. The p values for the differences between the mean values of DMSO control versus idebenone treatment were 0.1292, 0.0028, 0.0015, 0.0013, and 0.0023 for complex I respiration, respiration after DMSO/idebenone treatment, complex II respiration, OXPHOS capacity, and maximal respiration. The mean values significantly different between treatments are indicated by *. Error bars represent the SE of the mean.

Similar articles

Cited by

References

    1. Carroll J, Fearnley IM, Skehel JM, Shannon RJ, Hirst J, Walker JE: Bovine complex I is a complex of 45 different subunits. J Biol Chem 2006, 281(43):32724–32727. - PubMed
    1. Carroll J, Fearnley IM, Shannon RJ, Hirst J, Walker JE: Analysis of the subunit composition of complex I from bovine heart mitochondria. Mol Cell Proteomics 2003, 2(2):117–126. - PubMed
    1. Sazanov LA, Peak-Chew SY, Fearnley IM, Walker JE: Resolution of the membrane domain of bovine complex I into subcomplexes: implications for the structural organization of the enzyme. Biochemistry 2000, 39(24):7229–7235. - PubMed
    1. Grigorieff N: Three-dimensional structure of bovine NADH:ubiquinone oxidoreductase (complex I) at 22 A in ice. J Mol Biol 1998, 277(5):1033–1046. - PubMed
    1. Walker JE: The NADH:ubiquinone oxidoreductase (complex I) of respiratory chains. Q Rev Biophys 1992, 25(3):253–324. - PubMed

Publication types

LinkOut - more resources