. 2021 Jul 7;29(7):2308-2320.
doi: 10.1016/j.ymthe.2021.03.012. Epub 2021 Mar 17.

MicroRNA-10 negatively regulates inflammation in diabetic kidney via targeting activation of the NLRP3 inflammasome

Affiliations

MicroRNA-10 negatively regulates inflammation in diabetic kidney via targeting activation of the NLRP3 inflammasome

Hanying Ding et al. Mol Ther. .

Abstract

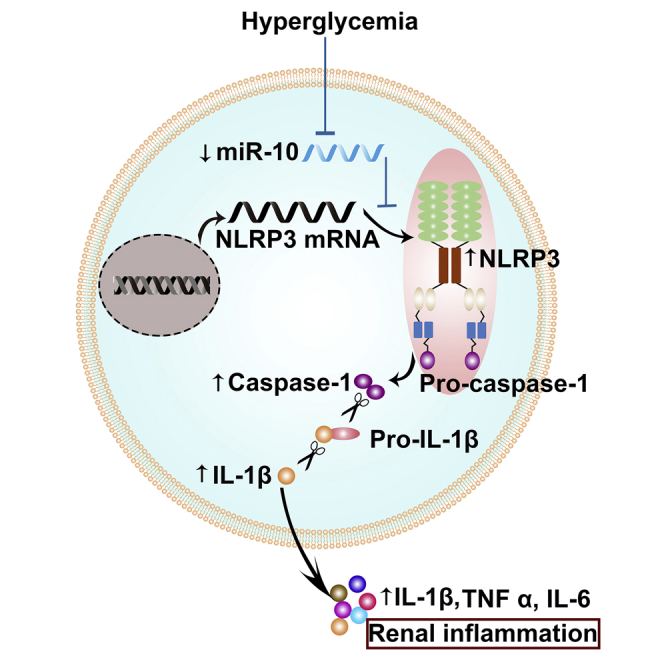
NLRP3 (NOD-, LRR-, and pyrin domain-containing protein 3) inflammasome activation has emerged as a central mediator of kidney inflammation in diabetic kidney disease (DKD). However, the mechanism underlying this activation in DKD remains poorly defined. In this study, we found that kidney-enriched microRNA-10a and -10b (miR-10a/b), predominantly expressed in podocytes and tubular epithelial cells, were downregulated in kidney from diabetic mice and patients with DKD. High glucose decreased miR-10a/b expression in vitro in an osmolarity-independent manner. miR-10a/b functioned as negative regulators of the NLRP3 inflammasome through targeting the 3'untranslated region of NLRP3 mRNA, inhibiting assembly of the NLRP3 inflammasome and decreasing caspase-1-dependent release of pro-inflammatory cytokines. Delivery of miR-10a/b into kidney prevented NLRP3 inflammasome activation and renal inflammation, and it reduced albuminuria in streptozotocin (STZ)-treated mice, whereas knocking down miR-10a/b increased NLRP3 inflammasome activation. Restoration of miR-10a/b expression in established DKD ameliorated kidney inflammation and mitigated albuminuria in both db/db and STZ-treated mice. These results suggest a novel intervention strategy for inhibiting kidney inflammation in DKD by targeting the NLRP3 inflammasome.

Keywords: NLRP3 inflammasome; diabetic kidney disease; kidney inflammation; microRNA.


Conflict of interest statement

The authors declare no competing interests.

Figures

None
Graphical abstract
Figure 1
Figure 1
miR-10a and -10b are predominantly expressed in the kidney (A–C) Representative images of in situ hybridization for miR-10a and -10b in epithelial organs from a mouse (A) and human (B) and semi-quantification data (C). Scale bars, 40 μm in (A) and 80 μm in (B). (D) Relative expression of miR-10a and -10b to U6 snoRNA, measured by qRT-PCR in homogenate from various mouse organs. (E) Expression of miR-10a and -10b in mouse kidney cell lines by qRT-PCR. (F) Relative miR-10a and -10b expression to U6 snoRNA in human kidney. (G) Expression of miR-10a and -10b in human kidney cell lines by qRT-PCR. (H) Representative image of fluorescence in situ hybridization of miR-10a and -10b in human TECs and podocytes.
Figure 2
Figure 2
Intrarenal miR-10a and -10b were downregulated and negatively correlated with NLRP3 expression in DKD mice (A–J) Representative graphs of kidney sections with H&E or PASM staining or immunohistochemical staining for NLRP3 or CD11b (A and B), in situ hybridization for miR-10a/b (C and D) from STZ and db/db mice, and semi-quantification data (E–J). Non-treated C57BL/6J mice were used as controls for STZ-treated mice, and db/+ mice were used as controls for db/db mice. Scale bars, 40 μm. (K and L) NLRP3 protein expression in renal cortex homogenate from STZ-treated (K) or db/db mice (L). (M–P) Correlations of NLRP3 expression with miR-10a or -10b in tubules and glomeruli (Glome) from STZ-treated mice (n = 18) (M and N) or db/db mice (n = 12) (O and P). Data are expressed as means ± SEM; n = 6 for each group. A Student’s t test was used for the comparison of two groups. ∗∗p < 0.01.
Figure 3
Figure 3
miR-10a/b inhibited the NLRP3 inflammasome in vitro through targeting the 3′ UTR of NLRP3 mRNA (A–D) Expression of miR-10a and -10b in human tubular epithelial cells (TECs) (A and B) or podocytes (C and D) incubated with various concentrations of glucose or mannitol. (E) Putative conserved binding site of NLRP3 with miR-10a/b and seed sequence of miR-10a/b (Ea), and the mutated 3′ UTR and mutated miR-10a/b (Eb). (F and G) Luciferase activity in TECs (F) or human podocytes (G) transfected with constructed plasmids. (H) Western blot for the NLRP3 inflammasome in miR-10a and -10b knockout (KO) TECs or podocytes in the presence or absence of 2 5mM glucose. (I and J) Restoring miR-10 with its mimic in cells knocking out miR-10 inhibited high glucose-induced NLRP3 inflammasome activation, while rescuing miR-10a or -10b with a mutated seed sequence (Mut) had no effect on glucose-triggered NLRP3 activation. Data are expressed as means ± SEM of three independent experiments. ANOVA was used for comparison among multiple groups. ∗p < 0.05, ∗∗p < 0.01.
Figure 4
Figure 4
Modulation of miR-10a/b expression in vivo impacted renal inflammation in STZ-treated mice (A) Schematic diagram of the experimental procedure. (B and C) Activation of the NLRP3 inflammasome cascade in kidney was inhibited by overexpression of miR-10a or -10b through injecting lentivirus harboring mimic. Western blotting analysis (B) and quantification data (C) are presented. (D and E) Knocking down miR-10a or -10b by antisense-enhanced NLRP3 inflammasome activation in kidney. Western blotting analysis (D) and quantification data (E) are shown. (F–I) Representative immunohistochemical staining of NLRP3 and CD11b and PASM staining in kidney sections (F), and quantification data (G–I). Scale bar, 40 μm. (J) Urinary albumin excretion. (K) Flow cytometry analysis for CD45-, CD11c-, CD3-, CD3/CD4-, and CD3/CD8-positive cells in single kidney cell suspensions. Data are expressed as means ± SEM; n = 6 for each group. ANOVA was used for comparison among multiple groups. ∗p < 0.05, ∗∗p < 0.01.
Figure 5
Figure 5
Restoring miR-10a/b in diabetic kidney attenuated renal inflammation by targeting the NLRP3 inflammasome (A) Schematic diagram of the experimental procedure. (B and C) Activation of the NLRP3 inflammasome cascade in kidney was attenuated by restoring miR-10a or -10b mimic in STZ-treated mice. Western blotting analysis (B) and quantification data (C) are shown. (D–G) Representative images of NLRP3 and CD11b immunohistochemical and PASM staining in kidney sections (D) and quantification data (E–G). Scale bar, 40 μm. (H) Urinary albumin excretion in STZ-treated mice. (I and J) Flow cytometry analysis for CD45-, CD11c-, CD3-, CD3/CD4-, and CD3/CD8-positive cells in single-cell suspensions of kidney from STZ-treated mice (I), and the quantification data (J). (K and L) Activation of the NLRP3 inflammasome cascade in kidney was attenuated by restoring miR-10a or -10b mimic in db/db mice. Western blotting analysis (K) and quantification data (L) are shown. (M) Flow cytometry analysis for immune cells in single-cell suspensions of kidney from db/db mice. (N) Changes in albuminuria in db/db mice. Data are expressed as means ± SEM; n = 6 for each group. ANOVA was used for comparison among multiple groups. ∗p < 0.05, ∗∗p < 0.01.
Figure 6
Figure 6
Intrarenal miR-10a/b downregulated and was negatively correlated with renal inflammation in patients with DKD (A–E) Representative images of in situ hybridization for miR-10a/b and immunohistochemistry for NLRP3 and CD11b in renal biopsy samples from patients with DKD (A) and quantification data (n = 6 for control, n = 27 for patients with DKD) (B–E). (F and G) Partial correlation analysis for association between renal miR-10a with NLRP3 expression (F) or accumulation of CD11b+ cells (G) after adjusting the confounders, including mean arterial pressure and urinary protein excretion. (H) Correlation between miR-10a expression and proteinuria. (I and J) Partial correlation analysis for association between renal miR-10b with NLRP3 expression (I) and accumulation of CD11b+ cells (J) after adjusting the confounders, including mean arterial pressure and urinary protein excretion. (K) Correlation between miR-10b and proteinuria. Data are expressed as means ± SEM. ∗∗p < 0.01.

Similar articles

Cited by

References

    1. Declèves A.E., Sharma K. New pharmacological treatments for improving renal outcomes in diabetes. Nat. Rev. Nephrol. 2010;6:371–380. - PubMed
    1. Tang S.C.W., Yiu W.H. Innate immunity in diabetic kidney disease. Nat. Rev. Nephrol. 2020;16:206–222. - PubMed
    1. Wada J., Makino H. Innate immunity in diabetes and diabetic nephropathy. Nat. Rev. Nephrol. 2016;12:13–26. - PubMed
    1. Galkina E., Ley K. Leukocyte recruitment and vascular injury in diabetic nephropathy. J. Am. Soc. Nephrol. 2006;17:368–377. - PubMed
    1. Wada J., Makino H. Inflammation and the pathogenesis of diabetic nephropathy. Clin. Sci. (Lond.) 2013;124:139–152. - PubMed

Publication types

MeSH terms