

Inhibition of xCT suppresses the efficacy of anti-PD-1/L1 melanoma treatment through exosomal PD-L1-induced macrophage M2 polarization
- PMID: 33744468
- PMCID: PMC8261162
- DOI: 10.1016/j.ymthe.2021.03.013
Inhibition of xCT suppresses the efficacy of anti-PD-1/L1 melanoma treatment through exosomal PD-L1-induced macrophage M2 polarization
Abstract
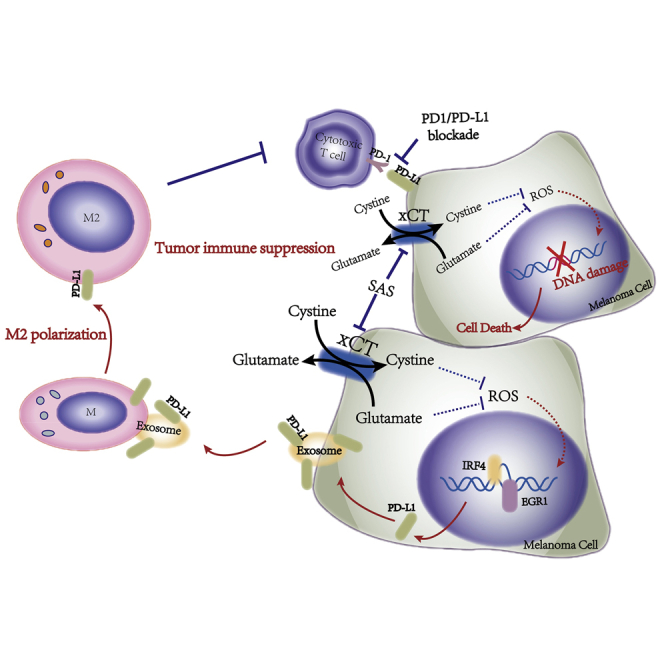
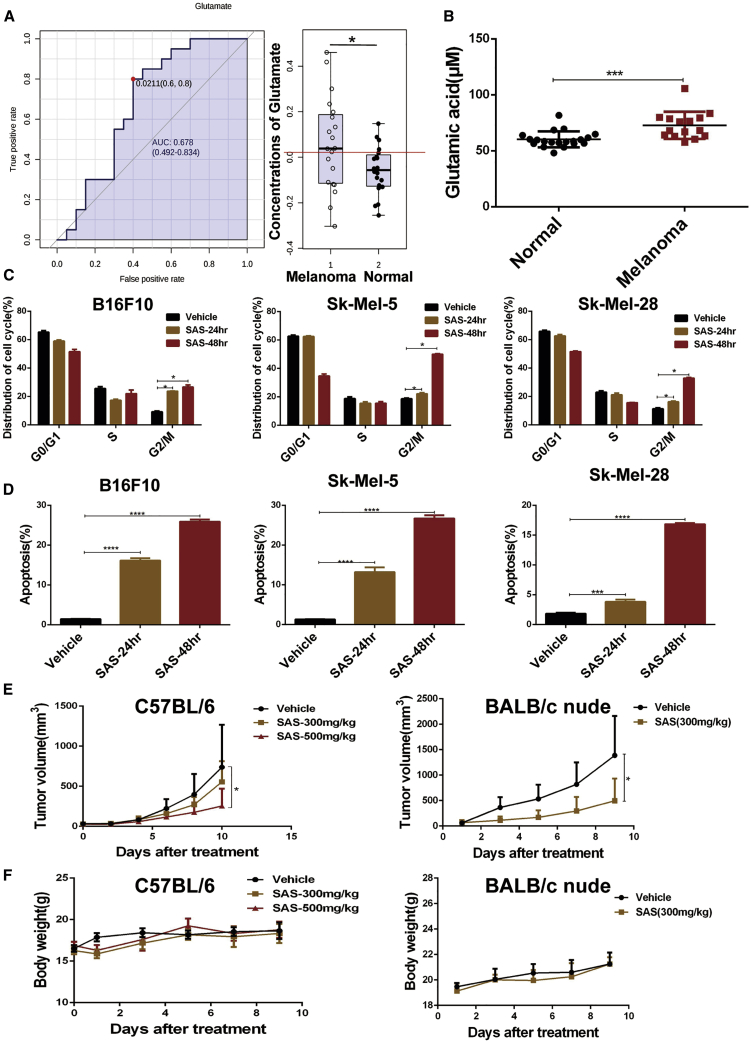
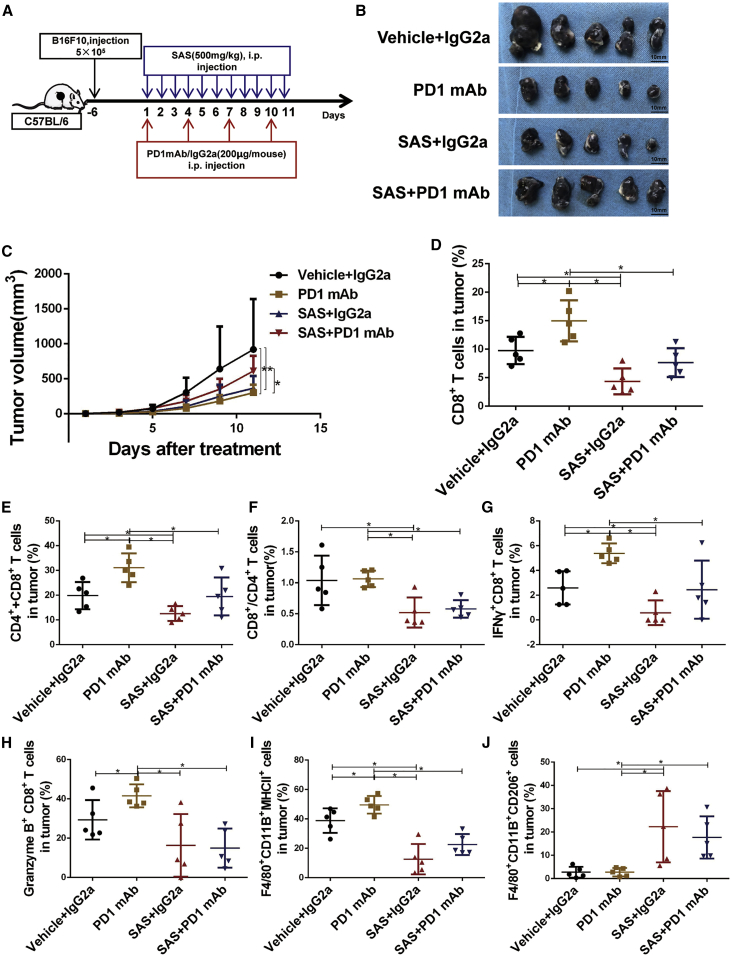
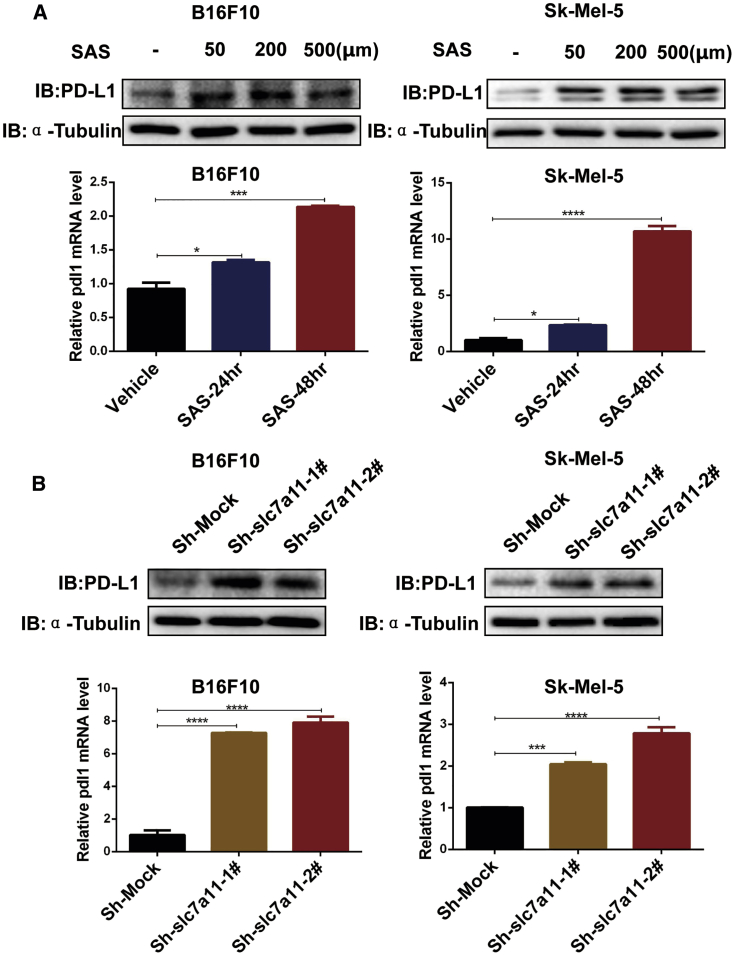
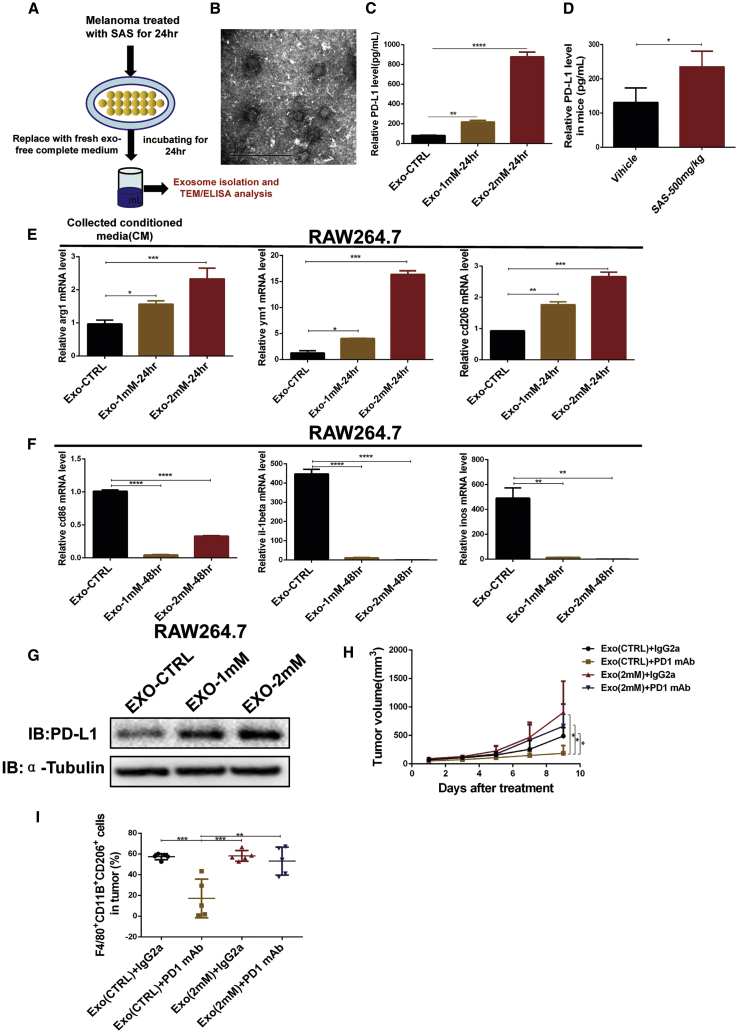
Tumor cells increase glutamate release through the cystine/glutamate transporter cystine-glutamate exchange (xCT) to balance oxidative homeostasis in tumor cells and promote tumor progression. Although clinical studies have shown the potential of targeting programmed cell death 1 (PD-1)/programmed death ligand 1 (PD-L1) signaling in melanoma, response rates are low. However, it remains unclear how glutamate metabolism affects anti-PD-1/PD-L1 treatment efficacy in melanoma. Here, we demonstrated that although inhibition of xCT either by pharmacological inhibitor (sulfasalazine [SAS]), approved by US Food and Drug Administration (FDA) for inflammatory diseases, or genetic knockdown induced reactive oxygen species (ROS)-related death in melanoma cells, inhibition of xCT significantly reduced the efficacy of anti-PD-1/PD-L1 immune checkpoint blockade through upregulating PD-L1 expression via the transcription factors IRF4/EGR1, as a consequence, exosomes carrying relatively large amounts of PD-L1 secreted from melanoma cells resulted in M2 macrophage polarization and reduced the efficacy of anti-PD-1/PD-L1 therapy in melanoma. Taken together, our results reveal that inhibition of xCT by SAS is a promising therapeutic strategy for melanoma; on the other hand, SAS treatment blunted the efficacy of anti-PD-1/PD-L1 via exosomal PD-L1-induced macrophage M2 polarization and eventually induced anti-PD-1/PD-L1 therapy resistance.
Trial registration: ClinicalTrials.gov NCT04205357.
Keywords: PD-1/PD-L1; exosome; macrophages; melanoma; xCT.
Copyright © 2021 The American Society of Gene and Cell Therapy. Published by Elsevier Inc. All rights reserved.
Conflict of interest statement
Declaration of interests The authors declare no competing interests.
Figures
Similar articles
-
Exosomal PD-L1 contributes to immunosuppression and is associated with anti-PD-1 response.Nature. 2018 Aug;560(7718):382-386. doi: 10.1038/s41586-018-0392-8. Epub 2018 Aug 8. Nature. 2018. PMID: 30089911 Free PMC article.
-
A Small Molecule Antagonist of PD-1/PD-L1 Interactions Acts as an Immune Checkpoint Inhibitor for NSCLC and Melanoma Immunotherapy.Front Immunol. 2021 May 14;12:654463. doi: 10.3389/fimmu.2021.654463. eCollection 2021. Front Immunol. 2021. PMID: 34054817 Free PMC article.
-
Gut microbiota affects PD-L1 therapy and its mechanism in melanoma.Cancer Immunol Immunother. 2025 Apr 11;74(5):169. doi: 10.1007/s00262-025-04018-y. Cancer Immunol Immunother. 2025. PMID: 40214675 Free PMC article. Review.
-
The Next Immune-Checkpoint Inhibitors: PD-1/PD-L1 Blockade in Melanoma.Clin Ther. 2015 Apr 1;37(4):764-82. doi: 10.1016/j.clinthera.2015.02.018. Epub 2015 Mar 29. Clin Ther. 2015. PMID: 25823918 Free PMC article. Review.
-
OSCC cell-secreted exosomal CMTM6 induced M2-like macrophages polarization via ERK1/2 signaling pathway.Cancer Immunol Immunother. 2021 Apr;70(4):1015-1029. doi: 10.1007/s00262-020-02741-2. Epub 2020 Oct 26. Cancer Immunol Immunother. 2021. PMID: 33104837 Free PMC article.
Cited by
-
ExoPD-L1: an assistant for tumor progression and potential diagnostic marker.Front Oncol. 2023 Sep 5;13:1194180. doi: 10.3389/fonc.2023.1194180. eCollection 2023. Front Oncol. 2023. PMID: 37736550 Free PMC article. Review.
-
Exosome is a Fancy Mobile Sower of Ferroptosis.J Cardiovasc Transl Res. 2024 Oct;17(5):1067-1082. doi: 10.1007/s12265-024-10508-8. Epub 2024 May 22. J Cardiovasc Transl Res. 2024. PMID: 38776048 Review.
-
Exosomes as key mediators in immune and cancer cell interactions: insights in melanoma progression and therapy.Arch Dermatol Res. 2025 Apr 19;317(1):729. doi: 10.1007/s00403-025-04237-4. Arch Dermatol Res. 2025. PMID: 40252131 Review.
-
Programmed Death Ligand-1 in Melanoma and Extracellular Vesicles Promotes Local and Regional Immune Suppression through M2-like Macrophage Polarization.Am J Pathol. 2025 Feb;195(2):306-320. doi: 10.1016/j.ajpath.2024.09.011. Epub 2024 Oct 29. Am J Pathol. 2025. PMID: 39481645
-
Tumor Cell-derived Extracellular Vesicles in Modulating Phenotypes and Immune Functions of Macrophages: Mechanisms and Therapeutic Applications.J Cancer. 2023 May 8;14(8):1321-1334. doi: 10.7150/jca.84632. eCollection 2023. J Cancer. 2023. PMID: 37283792 Free PMC article. Review.
References
-
- Arensman M.D., Yang X.S., Leahy D.M., Toral-Barza L., Mileski M., Rosfjord E.C., Wang F., Deng S., Myers J.S., Abraham R.T., Eng C.H. Cystine-glutamate antiporter xCT deficiency suppresses tumor growth while preserving antitumor immunity. Proc. Natl. Acad. Sci. USA. 2019;116:9533–9542. - PMC - PubMed
-
- Khamari R., Trinh A., Gabert P.E., Corazao-Rozas P., Riveros-Cruz S., Balayssac S., Malet-Martino M., Dekiouk S., Joncquel Chevalier Curt M., Maboudou P. Glucose metabolism and NRF2 coordinate the antioxidant response in melanoma resistant to MAPK inhibitors. Cell Death Dis. 2018;9:325. - PMC - PubMed
Publication types
MeSH terms
Substances
Associated data
LinkOut - more resources
Full Text Sources
Other Literature Sources
Medical
Molecular Biology Databases
Research Materials
