. 2021 Jul 20:779:146334.
doi: 10.1016/j.scitotenv.2021.146334. Epub 2021 Mar 12.

Urban environments and COVID-19 in three Eastern states of the United States

Affiliations

Urban environments and COVID-19 in three Eastern states of the United States

Whanhee Lee et al. Sci Total Environ. .

Abstract

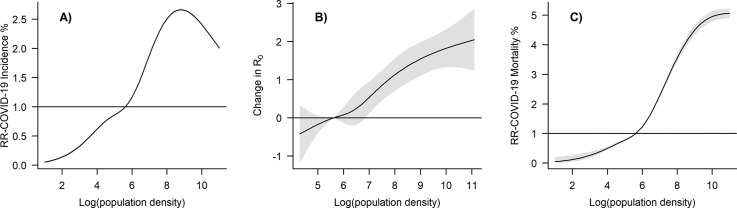
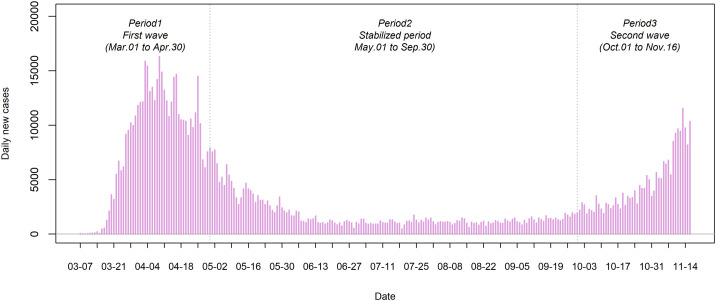
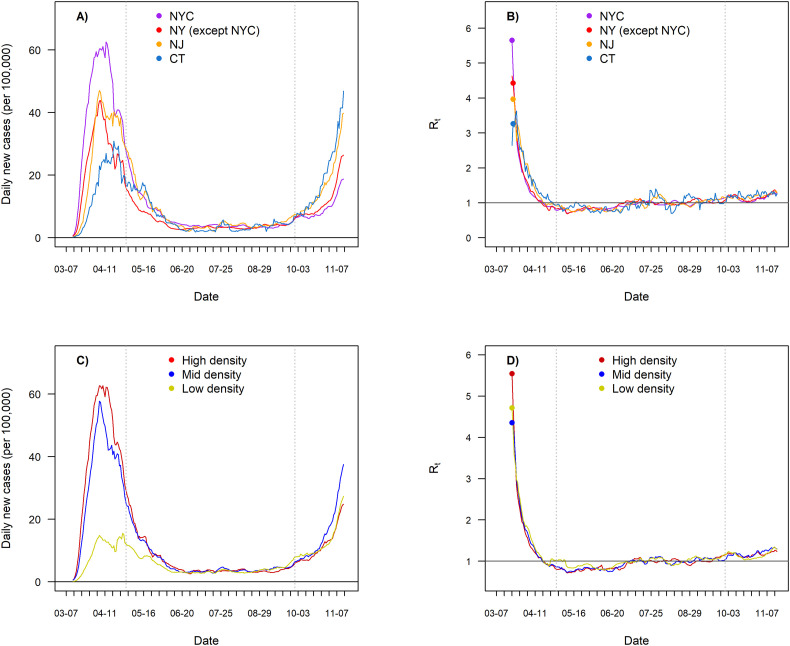
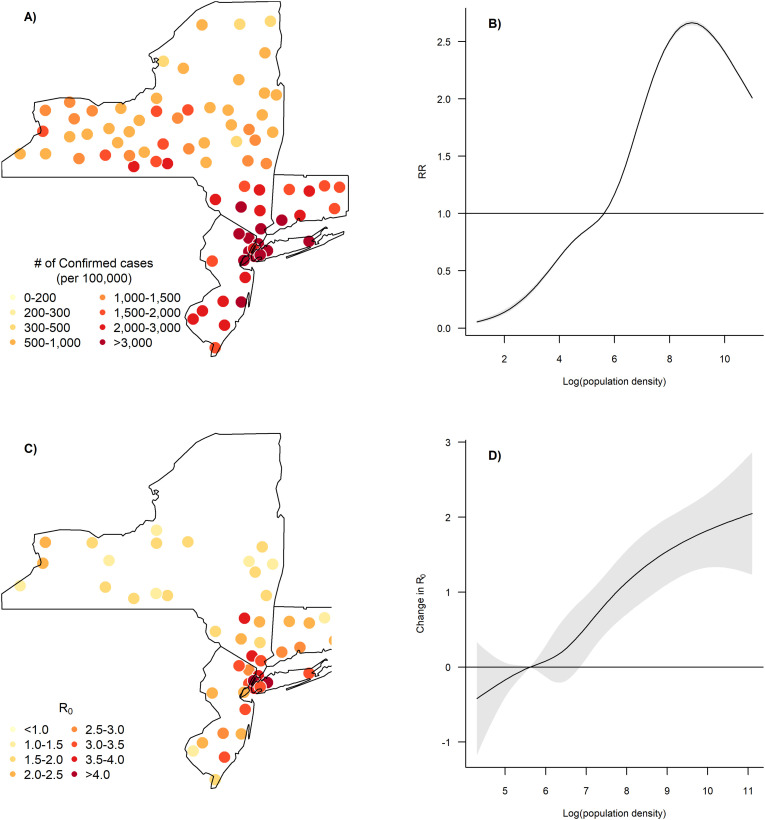
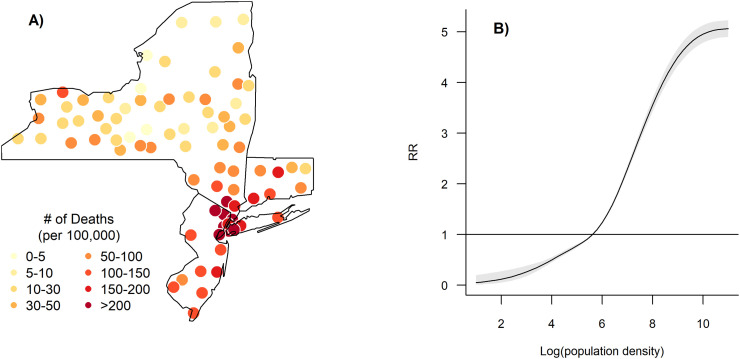
The United States has the highest numbers of confirmed cases and deaths during the novel coronavirus disease 2019 (COVID-19) pandemic. Previous studies reported that urban residents are more vulnerable to the spread and mortality of COVID-19 than rural residents. However, the pathways through which urban environments affect COVID-19 spread and mortality are unclear. We collected daily data on the number of confirmed cases and deaths of COVID-19 from Mar. 01 to Nov. 16, 2020 for all 91 counties in New York, New Jersey, and Connecticut in the United States. We calculated the COVID-19 incidence %, daily reproduction number, and mortality %, then estimated the associations with urban environment indicators using regression models. COVID-19 outcomes were generally highest in areas with high population density, and this pattern was evident in the early period of epidemic. Among the area-level demographic variables, the percentage of Black or Hispanic residents showed the strongest positive association with COVID-19 outcomes. Higher risk of COVID-19 outcomes was also associated with higher percentage of overcrowded households, uninsured people, and income inequality. The percent elderly, sex ratio (the ratio of males to females), and greenness were negatively associated with risk of COVID-19 outcomes. The results of this study could indicate where resources are most needed.

Keywords: COVID-19; Environmental justice; Inequality; Living conditions; Urban environment; Urbanization.


Conflict of interest statement

Declaration of competing interest None.

Figures

Unlabelled Image
Graphical abstract
Fig. 1
Fig. 1
Daily series of confirmed COVID-19 cases in three states (New York, New Jersey, and Connecticut) of the Unites States.
Fig. 2
Fig. 2
Epidemiological characteristics of COVID-19 in three states of the Unites States (NYC: New York City, NY: New York States, NJ: New Jersey, and CT: Connecticut). (A) Daily series of cases per 100,000 people by New York City and three states; (B) time-varying reproduction number (Rt) of COVID-19 by New York City and three states; (C) daily series of cases per 100,000 people by sub-areas divided by population density level; (D) time-varying Rt of COVID-19 by low, mid, high population density level.
Fig. 3
Fig. 3
Spatial pattern of the transmission of COVID-19 and the association between the transmission pattern and population density. (A) Geographical distribution of the total confirmed cases per 100,000 people; (B) association between the total confirmed cases per 100,000 people and log-transformed population density (persons per km2); (C) geographical distribution of the initial reproduction number (i.e. R0); (D) association between the initial reproduction number and log-transformed population density (persons per km2).
Fig. 4
Fig. 4
Spatial pattern of the mortality due to COVID-19 and the association between the mortality pattern and population density. (A) Geographical distribution of the total death cases per 100,000 people; (B) association between the total death cases per 100,000 people and log-transformed population density (persons per km2).

Similar articles

Cited by

References

    1. Aktay A., Bavadekar S., Cossoul G., Davis J., Desfontaines D., Fabrikant A., et al. 2020. Google COVID-19 Community Mobility Reports: Anonymization Process Description (Version 1.0)
    1. Allen J.G., Marr L.C. Recognizing and controlling airborne transmission of SARS-CoV-2 in indoor environments. Indoor Air. 2020;30:557. - PMC - PubMed
    1. Astell-Burt T., Feng X., Mavoa S., Badland H.M., Giles-Corti B. Do low-income neighbourhoods have the least green space? A cross-sectional study of Australia’s most populous cities. BMC Publ. Health. 2014;14:1–11. - PMC - PubMed
    1. Badr H.S., Du H., Marshall M., Dong E., Squire M.M., Gardner L.M. Association between mobility patterns and COVID-19 transmission in the USA: a mathematical modelling study. Lancet Infect. Dis. 2020;20:1247–1254. - PMC - PubMed
    1. Bahl P., Doolan C., de Silva C., Chughtai A.A., Bourouiba L., MacIntyre C.R. Airborne or droplet precautions for health workers treating COVID-19? J. Infect. Dis. 2020:jiaa189. doi: 10.1093/infdis/jiaa189. - DOI - PMC - PubMed