

Examining historical mercury sources in the Saint Louis River estuary: How legacy contamination influences biological mercury levels in Great Lakes coastal regions
- PMID: 33744580
- PMCID: PMC9563104
- DOI: 10.1016/j.scitotenv.2021.146284
Examining historical mercury sources in the Saint Louis River estuary: How legacy contamination influences biological mercury levels in Great Lakes coastal regions
Abstract
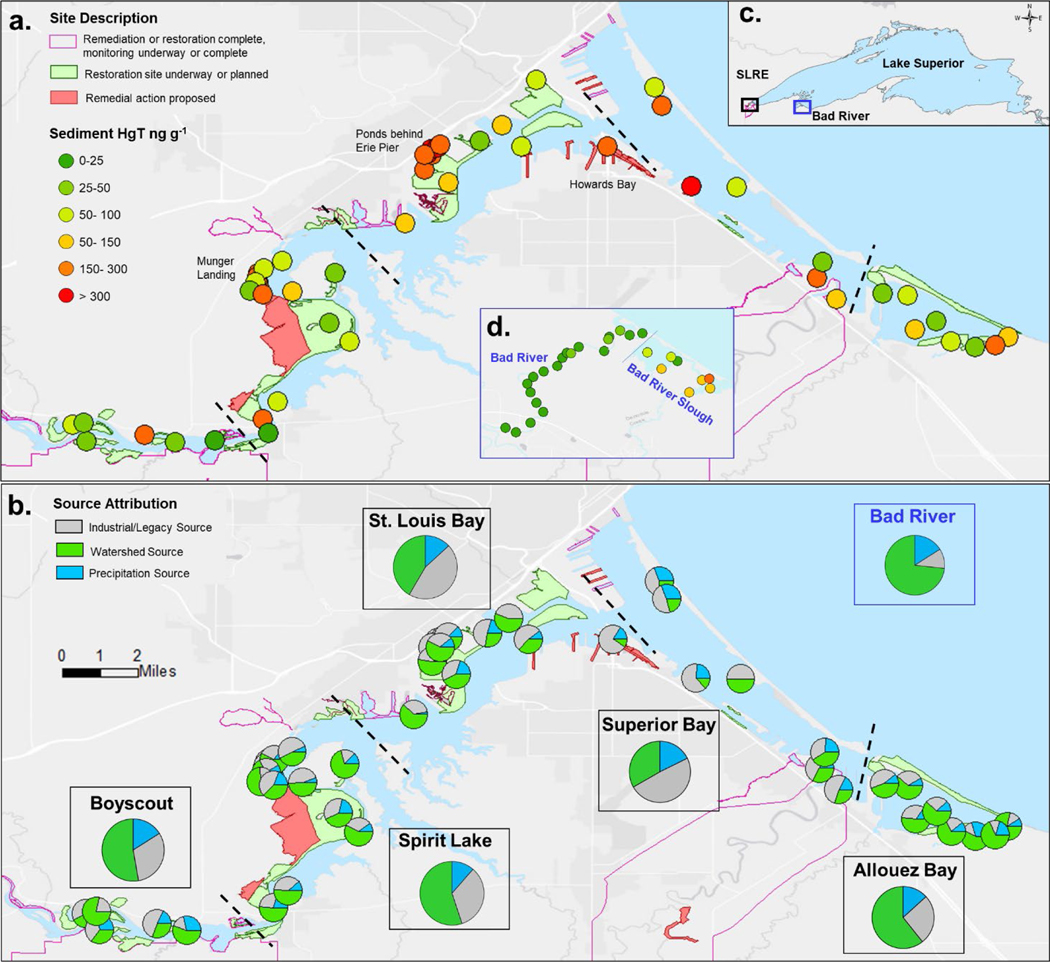
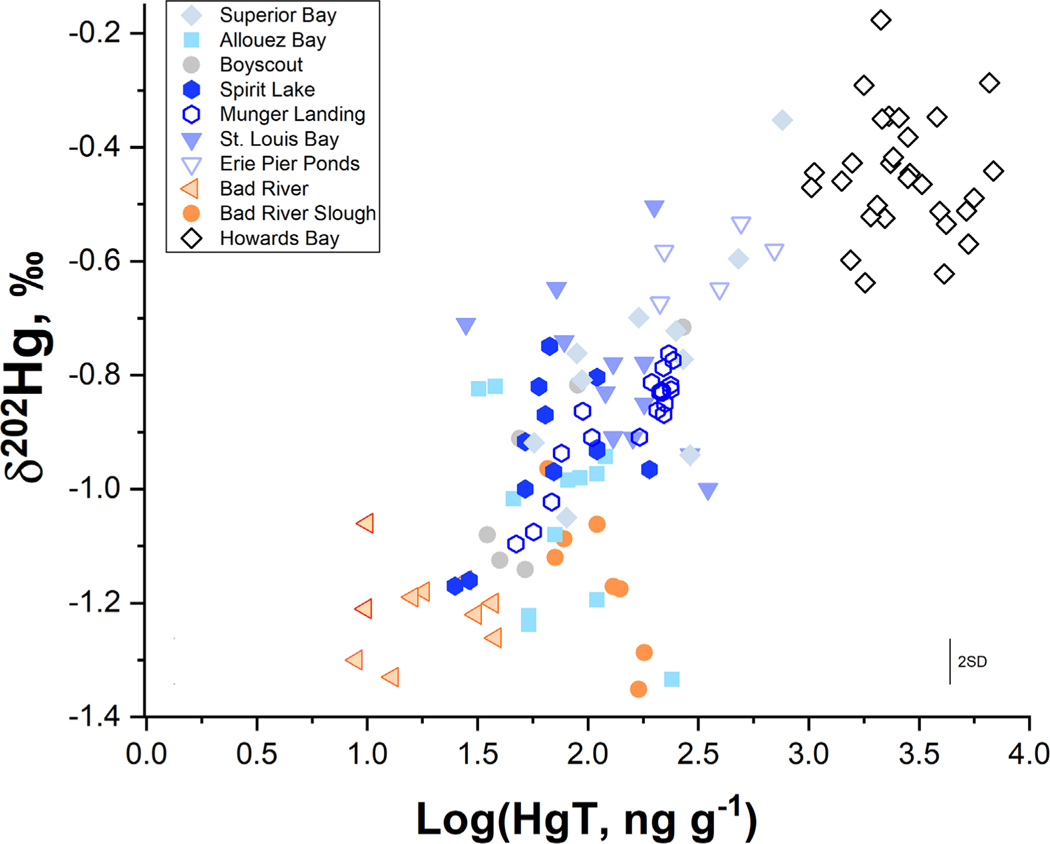
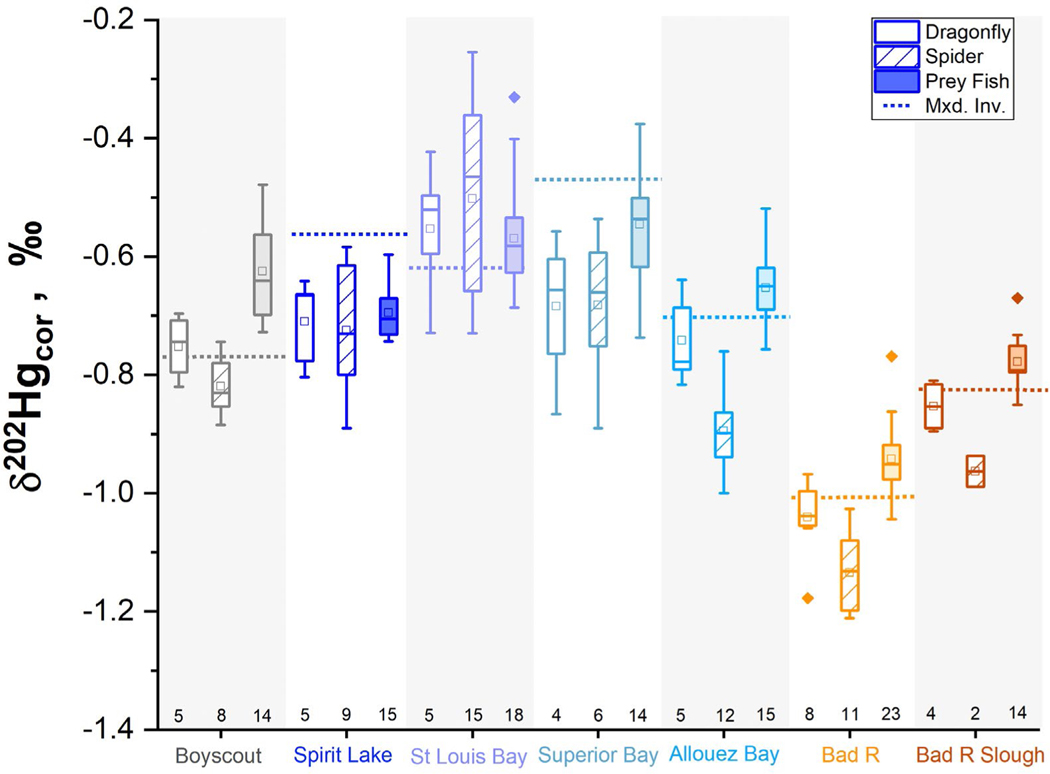
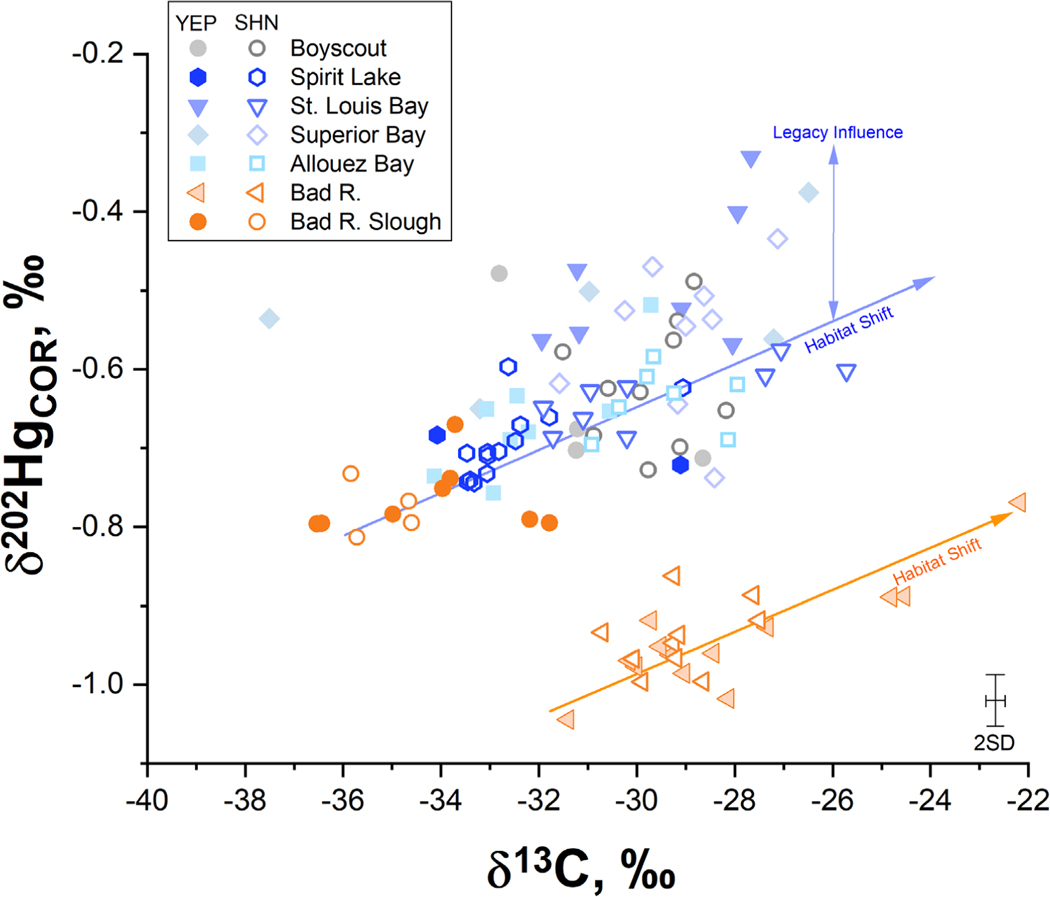
Industrial chemical contamination within coastal regions of the Great Lakes can pose serious risks to wetland habitat and offshore fisheries, often resulting in fish consumption advisories that directly affect human and wildlife health. Mercury (Hg) is a contaminant of concern in many of these highly urbanized and industrialized coastal regions, one of which is the Saint Louis River estuary (SLRE), the second largest tributary to Lake Superior. The SLRE has legacy Hg contamination that drives high Hg concentrations within sediments, but it is unclear whether legacy-derived Hg actively cycles within the food web. To understand the relative contributions of legacy versus contemporary Hg sources in coastal zones, Hg, carbon, and nitrogen stable isotope ratios were measured in sediments and food webs of SLRE and the Bad River, an estuarine reference site. Hg stable isotope values revealed that legacy contamination of Hg was widespread and heterogeneously distributed in sediments of SLRE, even in areas lacking industrial Hg sources. Similar isotope values were found in benthic invertebrates, riparian spiders, and prey fish from SLRE, confirming legacy Hg reaches the SLRE food web. Direct comparison of prey fish from SLRE and the Bad River confirmed that Hg isotope differences between the sites were not attributable to fractionation associated with rapid Hg bioaccumulation at estuarine mouths, but due to the presence of industrial Hg within SLRE. The Hg stable isotope values of game fish in both estuaries were dependent on fish migration and diet within the estuaries and extending into Lake Superior. These results indicate that Hg from legacy contamination is actively cycling within the SLRE food web and, through migration, this Hg also extends into Lake Superior via game fish. Understanding sources and the movement of Hg within the estuarine food web better informs restoration strategies for other impaired Great Lakes coastal zones.
Keywords: Bioaccumulation; Estuary; Great Lakes; Mercury; Site assessment; Stable isotopes.
Published by Elsevier B.V.
Conflict of interest statement
Declaration of competing interest The authors declare that they have no known competing financial interests or personal relationships that could have appeared to influence the work reported in this paper.
Figures
Similar articles
-
Mercury bioaccumulation in estuarine food webs.Ecol Appl. 2012 Mar;22(2):606-23. doi: 10.1890/11-0921.1. Ecol Appl. 2012. PMID: 22611858
-
Comparing nearshore benthic and pelagic prey as mercury sources to lake fish: the importance of prey quality and mercury content.Sci Total Environ. 2016 Sep 15;565:211-221. doi: 10.1016/j.scitotenv.2016.04.162. Epub 2016 May 9. Sci Total Environ. 2016. PMID: 27173839 Free PMC article.
-
The influence of legacy contamination on the transport and bioaccumulation of mercury within the Mobile River Basin.J Hazard Mater. 2021 Feb 15;404(Pt A):124097. doi: 10.1016/j.jhazmat.2020.124097. Epub 2020 Sep 28. J Hazard Mater. 2021. PMID: 33022526
-
Persistent organic pollutants and metals in the freshwater biota of the Canadian Subarctic and Arctic: an overview.Sci Total Environ. 2005 Dec 1;351-352:94-147. doi: 10.1016/j.scitotenv.2005.01.052. Epub 2005 Oct 12. Sci Total Environ. 2005. PMID: 16225909 Review.
-
Mercury contamination in the Laurentian Great Lakes region: introduction and overview.Environ Pollut. 2012 Feb;161:243-51. doi: 10.1016/j.envpol.2011.08.051. Epub 2011 Oct 14. Environ Pollut. 2012. PMID: 22000118 Review.
Cited by
-
Using mercury stable isotope fractionation to identify the contribution of historical mercury mining sources present in downstream water, sediment and fish.Front Environ Chem. 2023;4:1096199. doi: 10.3389/fenvc.2023.1096199. Epub 2023 Feb 9. Front Environ Chem. 2023. PMID: 37323923 Free PMC article.
-
Mercury Isotope Values in Shoreline Spiders Reveal the Transfer of Aquatic Mercury Sources to Terrestrial Food Webs.Environ Sci Technol Lett. 2023 Sep 13;10(10):891-896. doi: 10.1021/acs.estlett.3c00450. eCollection 2023 Oct 10. Environ Sci Technol Lett. 2023. PMID: 37840816 Free PMC article.
-
Internal Dynamics and Metabolism of Mercury in Biota: A Review of Insights from Mercury Stable Isotopes.Environ Sci Technol. 2022 Jul 5;56(13):9182-9195. doi: 10.1021/acs.est.1c08631. Epub 2022 Jun 19. Environ Sci Technol. 2022. PMID: 35723432 Free PMC article. Review.
References
-
- Andersen CR, Niemela S, Anderson J, Grayson S, Monson B, Christopherson D, et al. St. Louis River Watershed Monitoring and Assessment Report St. Paul, MN, 2013.
-
- Beck BF, Johnson NW. Geochemical factors influencing the production and transport of methylmercury in St. Louis River Estuary sediment. Appl Geochem 2014; 51: 44–54.
-
- Bellinger BJ, Hoffman JC, Angradi TR, Bolgrien DW, Starry M, Elonen C, et al. Water quality in the St. Louis River Area of Concern, Lake Superior: Historical and current conditions and delisting implications. J Great Lakes Res 2016; 42: 28–38.
-
- Bergquist BA, Blum JD. Mass-dependent and -independent fractionation of Hg isotopes by photoreduction in aquatic systems. Science 2007; 318: 417–20. - PubMed
MeSH terms
Substances
Grants and funding
LinkOut - more resources
Full Text Sources
Other Literature Sources
Medical
Research Materials
