

Whole-life body composition trajectory and longevity: role of insulin
- PMID: 33744845
- PMCID: PMC8064149
- DOI: 10.18632/aging.202727
Whole-life body composition trajectory and longevity: role of insulin
Abstract
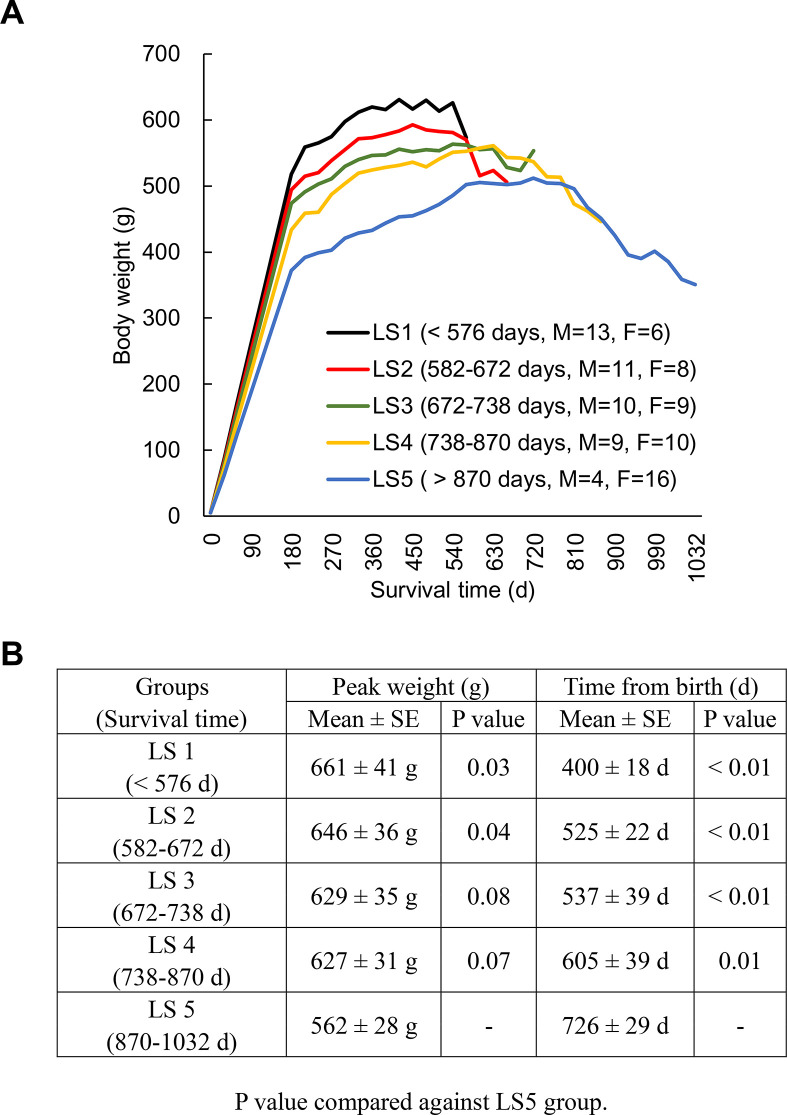
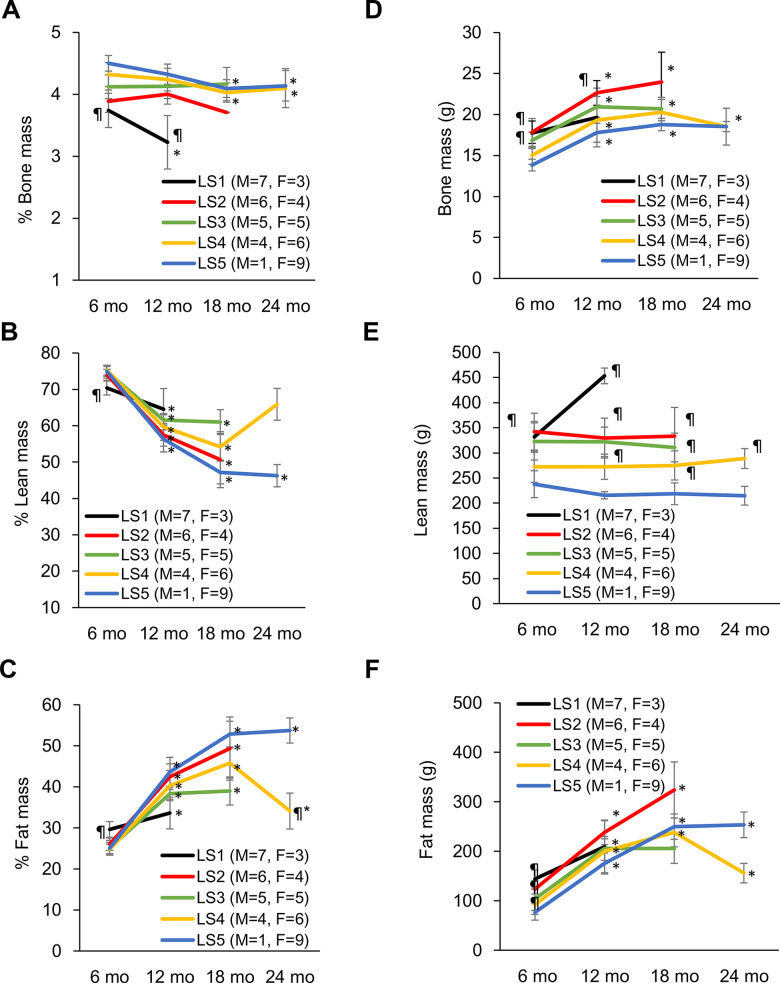
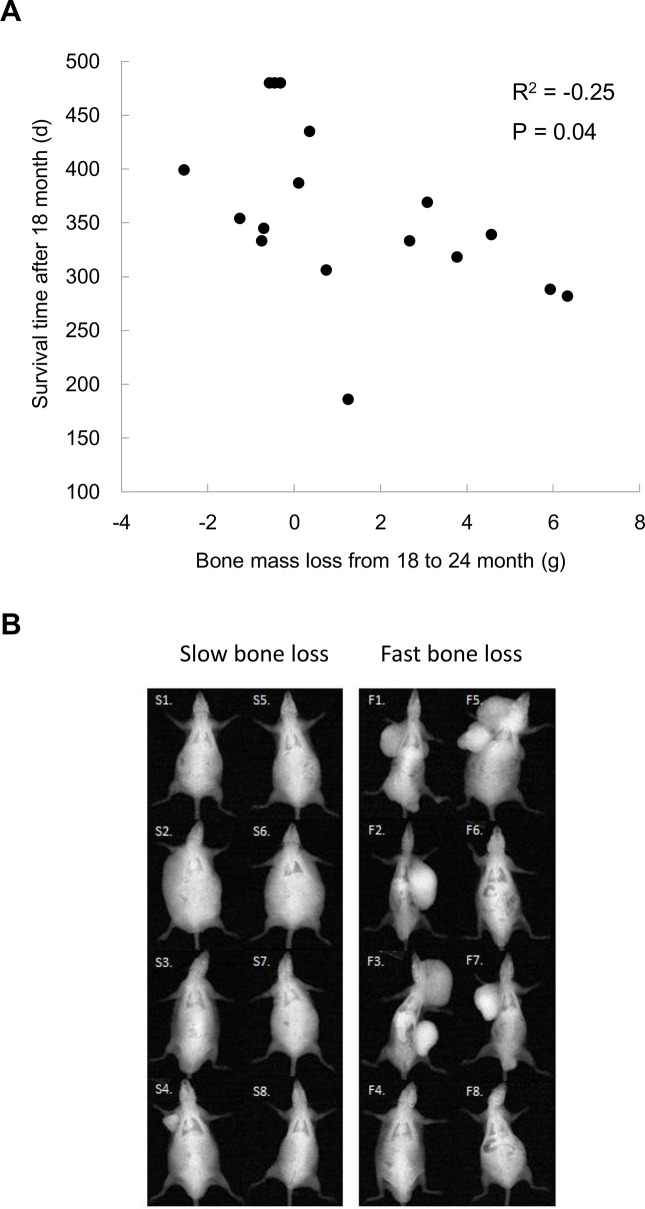
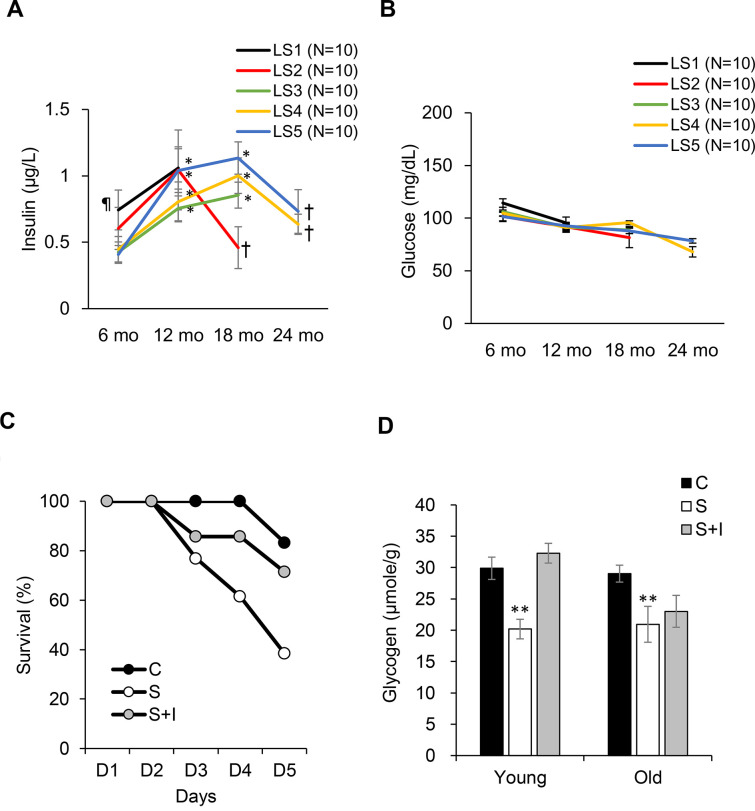
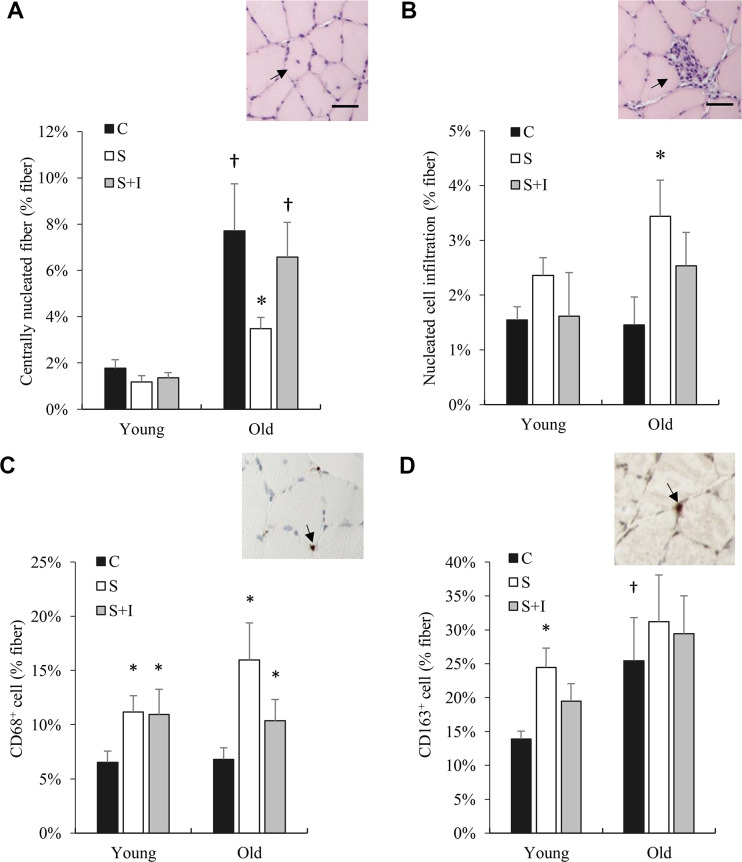
The present study assessed the body composition trajectory of rats (N = 96) placed into 5 groups according to lifespan, using dual-energy x-ray absorptiometry every 6 months until end-of-life. A striking linearity between lifespan and bone mass percentage (not absolute bone mass) was observed. Long-lived rats show a higher bone mass percentage with a delayed insulin rise to a similar peak level as short-lived counterparts, followed by insulin declines and bone mass loss. Decreasing insulin after streptozotocin (STZ) injection caused a rapid bone mass loss (-10.5%) with a decreased 5-day survival rate to 35% in old rats (20 months). Insulin replacement to STZ-injected rats completely blocked bone mass loss and increased the survival rate to 71%. Normal old rats (20 months) had faster lean mass loss despite greater myofiber regeneration (centronucleation) compared with the young rats (4 months). Increased CD68+ and CD163+ cell infiltration into insulin-depleted muscle suggests a bone marrow cell exhaustion by aging muscle. Bone produces stem cells and phagocytes to continuously rejuvenate peripheral tissues. Our data suggests that aging and unsustainable life is associated with development of disproportionality between bone and the growing body size, partly due to insulin reversal from hyperinsulinemia during late life.
Keywords: cachexia; frailty; longevity; osteopenia; sarcopenia.
Conflict of interest statement
Figures
Similar articles
-
Exceptional longevity and potential determinants of successful ageing in a cohort of 39 Labrador retrievers: results of a prospective longitudinal study.Acta Vet Scand. 2016 May 11;58(1):29. doi: 10.1186/s13028-016-0206-7. Acta Vet Scand. 2016. PMID: 27169845 Free PMC article.
-
Cross-sectional and longitudinal analysis of age-associated changes in body composition of male Brown Norway rats: association of serum leptin levels with peripheral adiposity.J Gerontol A Biol Sci Med Sci. 1999 Mar;54(3):B99-107. doi: 10.1093/gerona/54.3.b99. J Gerontol A Biol Sci Med Sci. 1999. PMID: 10191832
-
Can mesenchymal stem cell lysate reverse aging?Aging (Albany NY). 2018 Oct 24;10(10):2900-2910. doi: 10.18632/aging.101595. Aging (Albany NY). 2018. PMID: 30362957 Free PMC article.
-
The role of DXA in sarcopenia.Aging Clin Exp Res. 2016 Dec;28(6):1047-1060. doi: 10.1007/s40520-016-0589-3. Epub 2016 Jun 2. Aging Clin Exp Res. 2016. PMID: 27256078 Review.
-
Extended longevity and insulin signaling in adipose tissue.Exp Gerontol. 2005 Nov;40(11):878-83. doi: 10.1016/j.exger.2005.07.004. Epub 2005 Aug 25. Exp Gerontol. 2005. PMID: 16125891 Review.
Cited by
-
Senolytic effect of high intensity interval exercise on human skeletal muscle.Aging (Albany NY). 2023 Feb 8;15(3):765-776. doi: 10.18632/aging.204511. Epub 2023 Feb 8. Aging (Albany NY). 2023. PMID: 36779839 Free PMC article.
-
Vascular function in the aging human brain during muscle exertion.Aging (Albany NY). 2022 May 2;14(9):3910-3920. doi: 10.18632/aging.204052. Epub 2022 May 2. Aging (Albany NY). 2022. PMID: 35500246 Free PMC article.
-
Body Composition in Chronic Liver Disease.Int J Mol Sci. 2024 Jan 12;25(2):964. doi: 10.3390/ijms25020964. Int J Mol Sci. 2024. PMID: 38256036 Free PMC article. Review.
-
Editorial: Spotlight on aging: anthropological factors impacting physiology, prevention and management of aging conditions.Front Physiol. 2023 Nov 14;14:1331892. doi: 10.3389/fphys.2023.1331892. eCollection 2023. Front Physiol. 2023. PMID: 38033336 Free PMC article. No abstract available.
-
Exercise-induced MyoD mRNA Expression in Young and Older Human Skeletal Muscle: A Systematic Review and Meta-Analysis.Sports Med. 2025 Jul;55(7):1625-1649. doi: 10.1007/s40279-025-02207-4. Epub 2025 May 3. Sports Med. 2025. PMID: 40317450
References
Publication types
MeSH terms
Substances
LinkOut - more resources
Full Text Sources
Other Literature Sources
Medical
Research Materials
