. 2021 Apr 19;49(7):3826-3840.
doi: 10.1093/nar/gkab183.

Regulator-dependent temporal dynamics of a restriction-modification system's gene expression upon entering new host cells: single-cell and population studies

Affiliations

Regulator-dependent temporal dynamics of a restriction-modification system's gene expression upon entering new host cells: single-cell and population studies

Alessandro Negri et al. Nucleic Acids Res. .

Abstract

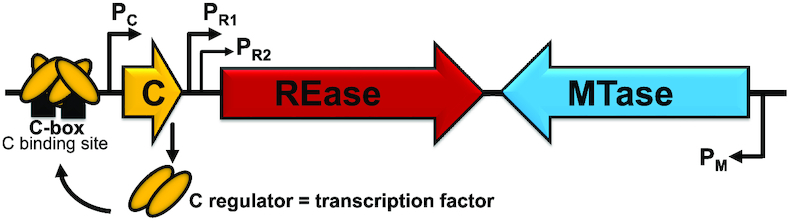
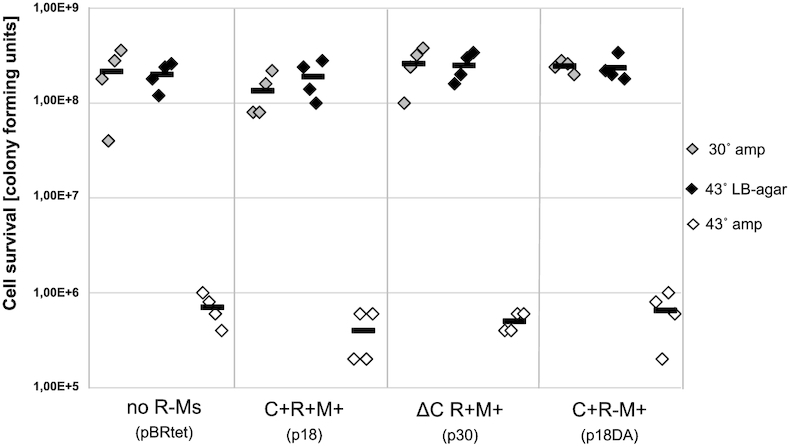
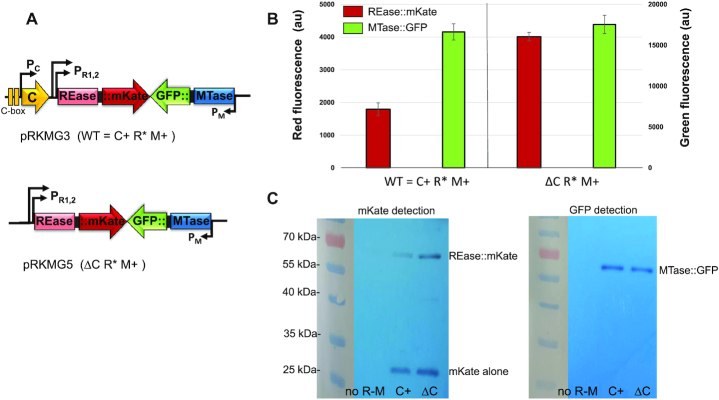
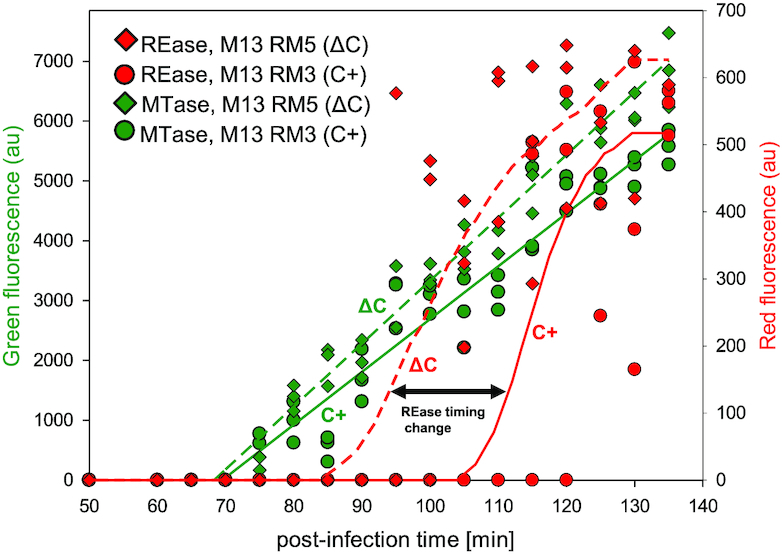
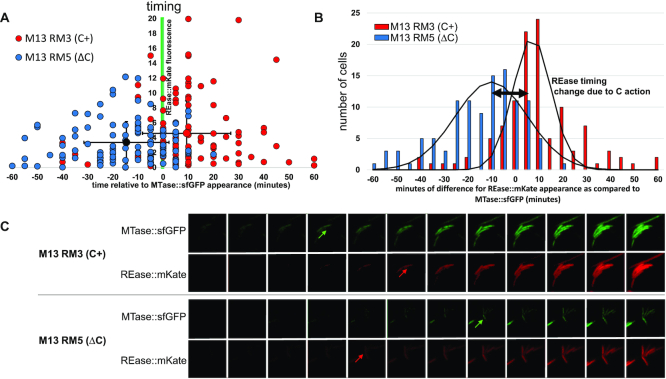
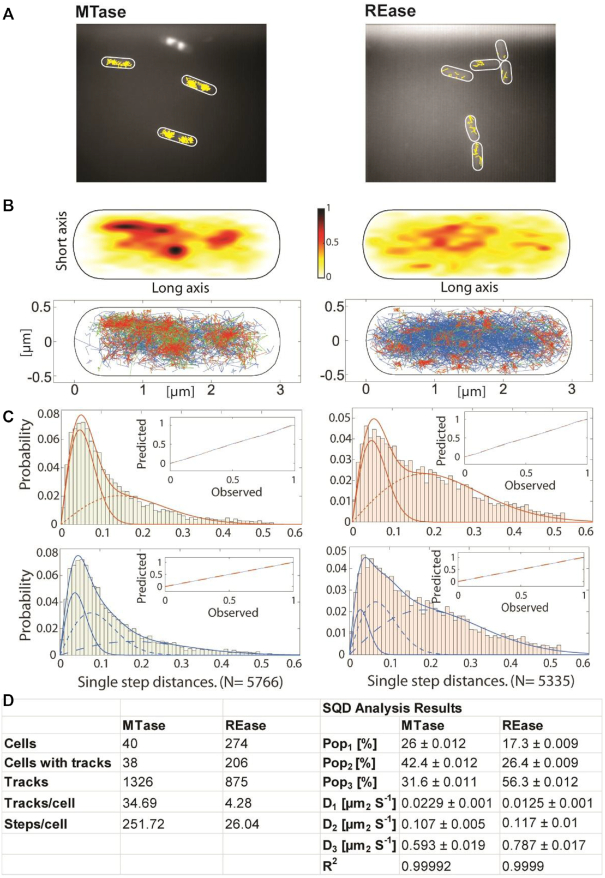
Restriction-modification (R-M) systems represent a first line of defense against invasive DNAs, such as bacteriophage DNAs, and are widespread among bacteria and archaea. By acquiring a Type II R-M system via horizontal gene transfer, the new hosts generally become more resistant to phage infection, through the action of a restriction endonuclease (REase), which cleaves DNA at or near specific sequences. A modification methyltransferase (MTase) serves to protect the host genome against its cognate REase activity. The production of R-M system components upon entering a new host cell must be finely tuned to confer protective methylation before the REase acts, to avoid host genome damage. Some type II R-M systems rely on a third component, the controller (C) protein, which is a transcription factor that regulates the production of REase and/or MTase. Previous studies have suggested C protein effects on the dynamics of expression of an R-M system during its establishment in a new host cell. Here, we directly examine these effects. By fluorescently labelling REase and MTase, we demonstrate that lack of a C protein reduces the delay of REase production, to the point of being simultaneous with, or even preceding, production of the MTase. Single molecule tracking suggests that a REase and a MTase employ different strategies for their target search within host cells, with the MTase spending much more time diffusing in proximity to the nucleoid than does the REase. This difference may partially ameliorate the toxic effects of premature REase expression.


Figures

Figure 1.
Figure 1.
Genetic map of Csp231I R-M system (not to scale), comprising its: regulator (C gene and its promoter PC), REase (and its two promoters: major PR1 and minor PR2; 8nt apart) and MTase (and its PM). The promoters are designated by arrows. The C-box (C binding site) consists of a pair of inverted repeats CTAAG-n5-CTTAG, marked as black bars. Production of C protein results in occupation of the left part of the C-box and subsequently the left and right part as a tetramer at higher C concentrations. The C protein provides an autoregulatory negative feed-back loop for its own transcription and also, to a lesser extent, for REase transcription due to bicistronic mRNA initiated from PC.
Figure 2.
Figure 2.
The MTase pre-expression is vital only at the stage of the Csp231I R-M system transfer into a new E. coli host, and C regulator does not play a role in this context. A two-plasmid system was generated. The first one was from series of plasmids harboring Csp231I R-M system variants: p18 (WT C+R+M+), p30 (ΔCR+M+) p18DA (C+R-M+), or pBRtet as a no R-M system control. The second plasmid (pHGMCsp) carried an additional, separate MTase gene on the thermo-sensitive pSC101 replicon. Cell survival after loss of the thermosensitive MTase plasmid was measured using a spotting assay and calculating CFUs. Dilutions of the cultures were spotted onto an agar plates for incubation at a permissive temperature for replication of pHGMCsp (30°C, grey dots) or at a non-permissive temperature, where MTase production is lost (43°C, black dots). To prove the MTase carrying plasmid is lost, the cell death due to lack of bla gene expression at 43°C on ampicillin supplemented plates (white dots) is shown. The average from four replicates is indicated by black bar.
Figure 3.
Figure 3.
Steady-state expression of R-M system fusion proteins. (A) Generated constructs contain entire ORF length fused to fluorescent reporter genes, with or without C regulatory protein, as shown. C protein binding sites (C-boxes) are indicated. In both cases, the inactive REase (R* = D162A, substitution in conserved catalytic center) is produced as a fusion to mKate, while the active MTase is expressed as a MTase::sfGFP fusion. (B) The level of expression for fusion proteins REase::mKate and MTase::sfGFP for R-M systems with (C+) and without C protein (ΔC) is measured in relative fluorescence (red and green) arbitrary units on separate y axes. (C) Production of fusion proteins was confirmed using commercial antibodies against fluorescent proteins on cell extracts from E. coli carrying pRKMG3 (WT C+) or pRKMG5 (ΔC). Cell extract without plasmid was used as negative control (no R-M). Expected MW: REase::mKate - 63.9 kDa, MTase::sfGFP - 61.2 kDa, mKate alone - 26 kDa.
Figure 4.
Figure 4.
In vivo kinetics of Csp231I restriction-modification gene expression after entering a new host cell. The R-M system was delivered to host cells by recombinant M13 phages during infection as described in Material and Methods section. The fluorescence signals were separately monitored in cultures in 5 min intervals, up to 140 min post-infection, to detect expression of REase::mKate (red) and MTase::sfGFP (green) in biological triplicates. The relative fluorescence (red and green) was measured in arbitrary units and shown on separate y axes. To compare the effects of C regulatory protein on R-M system transfer, the host cells were infected with recombinant M13 phages either carrying the C gene (M13RM3, C+, circles) or without the C gene (M13RM5, ΔC, diamonds). The trends for MTase expression (green) and REase (red) are shown by continuous (C-present R-M system) or dashed (C-absent R-M system) lines. The 15 min−shift in time for REase expression (C+ versus ΔC) is indicated by the black double arrow
Figure 5.
Figure 5.
REase delay is disturbed in cells lacking the C regulator as monitored in real-time at the single cell level. (A) Timing of REase expression (red fluorescence) in individual host cells, infected by recombinant M13 phages carrying R-M system with C protein (red points; N = 111) and without C protein (blue points; N = 110). The times are set in reference to appearance of MTase expression (green fluorescence detection), defined as time 0 (x axis). The vertical axis indicates the intensity of rising red fluorescence, which crossed the background red fluorescence baseline at the earliest time. The average time values for REase expression for both +C and ΔC systems are indicated with error bars (standard deviations), which are each about ±15 min. Mean REase expression timing for the ΔC R-M system is ∼15 min earlier than MTase expression, and about 10 min later than MTase expression for the +C R-M system. The two-tailed P value between the ±C groups is <0.0001. (B) Distribution curve of scattered points from panel A, showing the number of cells for each variant (ΔC versus +C) grouped by timing values of appearance of red fluorescence (REase expression) in comparison to appearance of green fluorescence (MTase). The black lines represent the trend lines indicating a roughly normal distribution for both variants. The double-headed arrow indicates the shift in means, of ∼15 min. (C) Representative series of time-lapse images taken independently for cells infected with the two variants of recombinant M13 phages (+C versus ΔC). The 12 frames cover a 60 min time range, with each shot taken at 5 min intervals after M13 infection. Arrows indicate the time of detection of rising fluorescence from no fluorescent background, red fluorescence for REase and green for MTase. In the upper panel for the +C- R-M system, REase expression is detected 10 min after MTase, whereas in the bottom panel for the ΔC R-M system, the REase expression precedes the MTase detection by about 15 min.
Figure 6.
Figure 6.
Single molecule tracking analyses of the MTase and REase, expressed at very low levels as mVenus fusions. (A) Representative tracks (in yellow) of enzyme molecules, in cells that are outlined by white ovals. (B) Projection of all tracks into a standardized cell of 3×1 μm size. Upper panels are heat maps, where darker shading indicates higher presence of molecule tracks. Lower panels are confinement maps, with tracks: (i) moving within a radius of 120 nm for at least five steps are shown in red, (ii) tracks moving freely in blue and (iii) tracks containing both confined and free motion in green (‘transitions’). (C) Jump distance diagrams showing the cumulative probability distribution of squared displacement analyses (SQD) to estimate the diffusion constants (D) and relative fractions of up to three diffusive states. Upper panels show data fitted with two Rayleigh distributions, lower panels with three distributions. Inset show deviation (blue line) of experimental data from modelled data (indicated by dashed red line). (D) Summary of data obtained from SQD analyses, diffusion constants D1–3 correspond to populations Pop1–3.

Similar articles

Cited by

References

    1. Labrie S.J., Samson J.E., Moineau S.. Bacteriophage resistance mechanisms. Nat. Rev. Microbiol. 2010; 8:317–327. - PubMed
    1. Makarova K.S., Wolf Y.I., Koonin E.V.. Comparative genomics of defense systems in archaea and bacteria. Nucleic Acids Res. 2013; 41:4360–4377. - PMC - PubMed
    1. Doron S., Melamed S., Ofir G., Leavitt A., Lopatina A., Keren M., Amitai G., Sorek R.. Systematic discovery of antiphage defense systems in the microbial pangenome. Science. 2018; 359:eaar4120. - PMC - PubMed
    1. Thomas C.M., Nielsen K.M.. Mechanisms of, and barriers to, horizontal gene transfer between bacteria. Nat. Rev. Microbiol. 2005; 3:711–721. - PubMed
    1. Johnston C.D., Skeete C.A., Fomenkov A., Roberts R.J., Rittling S.R.. Restriction-modification mediated barriers to exogenous DNA uptake and incorporation employed by Prevotella intermedia. PLoS One. 2017; 12:e0185234. - PMC - PubMed

Publication types

MeSH terms

Substances