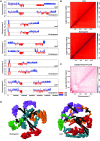
INT-Hi-C reveals distinct chromatin architecture in endosperm and leaf tissues of Arabidopsis
- PMID: 33744975
- PMCID: PMC8096224
- DOI: 10.1093/nar/gkab191
INT-Hi-C reveals distinct chromatin architecture in endosperm and leaf tissues of Arabidopsis
Abstract
Higher-order chromatin structure undergoes striking changes in response to various developmental and environmental signals, causing distinct cell types to adopt specific chromatin organization. High throughput chromatin conformation capture (Hi-C) allows studying higher-order chromatin structure; however, this technique requires substantial amounts of starting material, which has limited the establishment of cell type-specific higher-order chromatin structure in plants. To overcome this limitation, we established a protocol that is applicable to a limited amount of nuclei by combining the INTACT (isolation of nuclei tagged in specific cell types) method and Hi-C (INT-Hi-C). Using this INT-Hi-C protocol, we generated Hi-C data from INTACT purified endosperm and leaf nuclei. Our INT-Hi-C data from leaf accurately reiterated chromatin interaction patterns derived from conventional leaf Hi-C data. We found that the higher-order chromatin organization of mixed leaf tissues and endosperm differs and that DNA methylation and repressive histone marks positively correlate with the chromatin compaction level. We furthermore found that self-looped interacting genes have increased expression in leaves and endosperm and that interacting intergenic regions negatively impact on gene expression in the endosperm. Last, we identified several imprinted genes involved in long-range and trans interactions exclusively in endosperm. Our study provides evidence that the endosperm adopts a distinct higher-order chromatin structure that differs from other cell types in plants and that chromatin interactions influence transcriptional activity.
© The Author(s) 2021. Published by Oxford University Press on behalf of Nucleic Acids Research.
Figures


Similar articles
-
Control of Paternally Expressed Imprinted UPWARD CURLY LEAF1, a Gene Encoding an F-Box Protein That Regulates CURLY LEAF Polycomb Protein, in the Arabidopsis Endosperm.PLoS One. 2015 Feb 17;10(2):e0117431. doi: 10.1371/journal.pone.0117431. eCollection 2015. PLoS One. 2015. PMID: 25689861 Free PMC article.
-
Epigenetic signatures associated with imprinted paternally expressed genes in the Arabidopsis endosperm.Genome Biol. 2019 Feb 21;20(1):41. doi: 10.1186/s13059-019-1652-0. Genome Biol. 2019. PMID: 30791924 Free PMC article.
-
Transcriptome analysis of proliferating Arabidopsis endosperm reveals biological implications for the control of syncytial division, cytokinin signaling, and gene expression regulation.Plant Physiol. 2008 Dec;148(4):1964-84. doi: 10.1104/pp.108.128108. Epub 2008 Oct 15. Plant Physiol. 2008. PMID: 18923020 Free PMC article.
-
[Genomic imprinting and seed development].Yi Chuan. 2005 Jul;27(4):665-70. Yi Chuan. 2005. PMID: 16120596 Review. Chinese.
-
Plant Elongator-mediated transcriptional control in a chromatin and epigenetic context.Biochim Biophys Acta. 2016 Aug;1859(8):1025-33. doi: 10.1016/j.bbagrm.2016.06.008. Epub 2016 Jun 21. Biochim Biophys Acta. 2016. PMID: 27354117 Review.
Cited by
-
Genome Maintenance Mechanisms at the Chromatin Level.Int J Mol Sci. 2021 Sep 27;22(19):10384. doi: 10.3390/ijms221910384. Int J Mol Sci. 2021. PMID: 34638727 Free PMC article. Review.
-
Isolation of Nuclei Tagged in Specific Cell Types (INTACT) in Arabidopsis.Methods Mol Biol. 2023;2686:313-328. doi: 10.1007/978-1-0716-3299-4_16. Methods Mol Biol. 2023. PMID: 37540367
-
Binding by the Polycomb complex component BMI1 and H2A monoubiquitination shape local and long-range interactions in the Arabidopsis genome.Plant Cell. 2023 Jun 26;35(7):2484-2503. doi: 10.1093/plcell/koad112. Plant Cell. 2023. PMID: 37070946 Free PMC article.
-
Dynamic enhancer transcription associates with reprogramming of immune genes during pattern triggered immunity in Arabidopsis.BMC Biol. 2022 Jul 21;20(1):165. doi: 10.1186/s12915-022-01362-8. BMC Biol. 2022. PMID: 35864475 Free PMC article.
-
The maize gene maternal derepression of r1 encodes a DNA glycosylase that demethylates DNA and reduces siRNA expression in the endosperm.Plant Cell. 2022 Sep 27;34(10):3685-3701. doi: 10.1093/plcell/koac199. Plant Cell. 2022. PMID: 35775949 Free PMC article.
References
-
- Schubert I., Shaw P.. Organization and dynamics of plant interphase chromosomes. Trends Plant Sci. 2011; 16:273–281. - PubMed
-
- Rodriguez-Granados N.Y., Ramirez-Prado J.S., Veluchamy A., Latrasse D., Raynaud C., Crespi M., Ariel F., Benhamed M.. Put your 3D glasses on: plant chromatin is on show. J. Exp. Bot. 2016; 67:3205–3221. - PubMed
-
- Sexton T., Yaffe E., Kenigsberg E., Bantignies F., Leblanc B., Hoichman M., Parrinello H., Tanay A., Cavalli G.. Three-dimensional folding and functional organization principles of the Drosophila genome. Cell. 2012; 148:458–472. - PubMed
Publication types
MeSH terms
Substances
LinkOut - more resources
Full Text Sources
Other Literature Sources
Molecular Biology Databases

