. 2021 Aug;31(8):5866-5876.
doi: 10.1007/s00330-021-07787-z. Epub 2021 Mar 20.

An A.I. classifier derived from 4D radiomics of dynamic contrast-enhanced breast MRI data: potential to avoid unnecessary breast biopsies

Affiliations

An A.I. classifier derived from 4D radiomics of dynamic contrast-enhanced breast MRI data: potential to avoid unnecessary breast biopsies

Nina Pötsch et al. Eur Radiol. 2021 Aug.

Abstract

Objectives: Due to its high sensitivity, DCE MRI of the breast (bMRI) is increasingly used for both screening and assessment purposes. The high number of detected lesions poses a significant logistic challenge in clinical practice. The aim was to evaluate a temporally and spatially resolved (4D) radiomics approach to distinguish benign from malignant enhancing breast lesions and thereby avoid unnecessary biopsies.

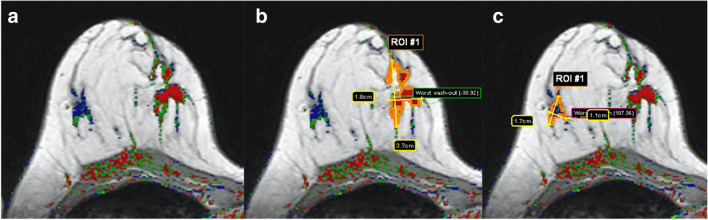
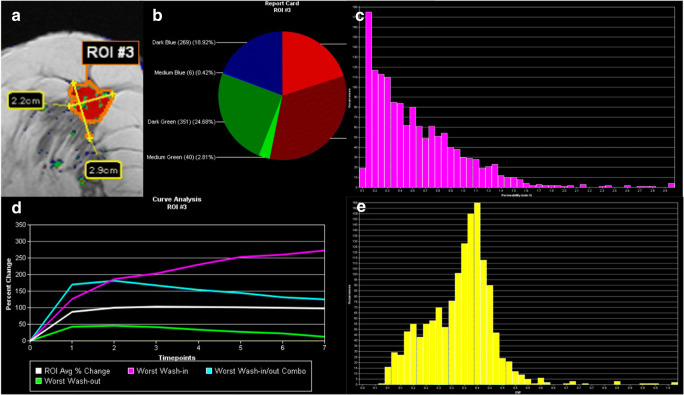
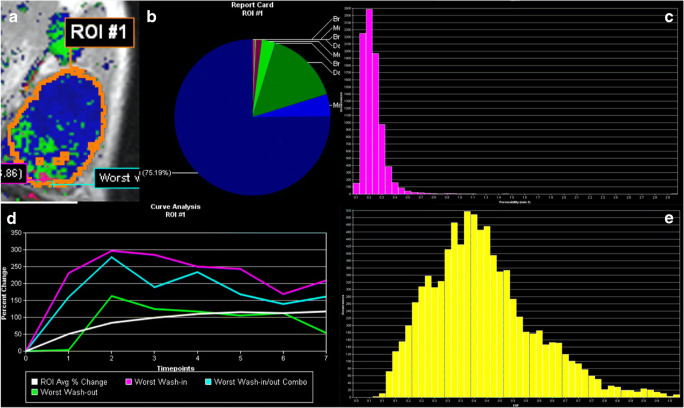
Methods: This retrospective study included consecutive patients with MRI-suspicious findings (BI-RADS 4/5). Two blinded readers analyzed DCE images using a commercially available software, automatically extracting BI-RADS curve types and pharmacokinetic enhancement features. After principal component analysis (PCA), a neural network-derived A.I. classifier to discriminate benign from malignant lesions was constructed and tested using a random split simple approach. The rate of avoidable biopsies was evaluated at exploratory cutoffs (C1, 100%, and C2, ≥ 95% sensitivity).

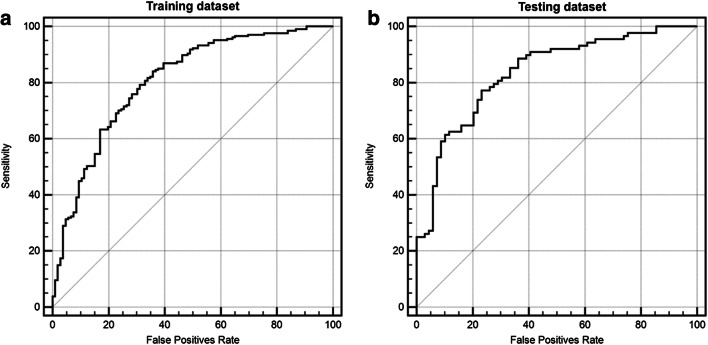
Results: Four hundred seventy (295 malignant) lesions in 329 female patients (mean age 55.1 years, range 18-85 years) were examined. Eighty-six DCE features were extracted based on automated volumetric lesion analysis. Five independent component features were extracted using PCA. The A.I. classifier achieved a significant (p < .001) accuracy to distinguish benign from malignant lesion within the test sample (AUC: 83.5%; 95% CI: 76.8-89.0%). Applying identified cutoffs on testing data not included in training dataset showed the potential to lower the number of unnecessary biopsies of benign lesions by 14.5% (C1) and 36.2% (C2).

Conclusion: The investigated automated 4D radiomics approach resulted in an accurate A.I. classifier able to distinguish between benign and malignant lesions. Its application could have avoided unnecessary biopsies.

Key points: • Principal component analysis of the extracted volumetric and temporally resolved (4D) DCE markers favored pharmacokinetic modeling derived features. • An A.I. classifier based on 86 extracted DCE features achieved a good to excellent diagnostic performance as measured by the area under the ROC curve with 80.6% (training dataset) and 83.5% (testing dataset). • Testing the resulting A.I. classifier showed the potential to lower the number of unnecessary biopsies of benign breast lesions by up to 36.2%, p < .001 at the cost of up to 4.5% (n = 4) false negative low-risk cancers.

Keywords: Breast MRI; Breast biopsies; Breast cancer; Neural network; Principal component analysis.


Conflict of interest statement

The authors of this manuscript declare no relationships with any companies, whose products or services may be related to the subject matter of the article.

Figures

Fig. 1
Fig. 1
Example for automated lesion segmentation in a 49-year-old woman with her2 type invasive breast cancer not otherwise specified (NST) in the medial right breast (a, coded red on the parametric map). After marking the lesion by a single mouse-click, an irregular mass is accurately delineated in a volumetric manner (b, only one slice shown here). Subsequently, the ultimately benign lesion (c, lateral right breast) is segmented automatically after marking it with one mouse-click
Fig. 2
Fig. 2
Visualization example of the volumetric analysis of a poorly differentiated (high grade, G3) invasive ductal cancer, not otherwise specified (NST) in a 54-year-old woman. a The segmentation also shown in Fig. 1, (b) the distribution of enhancement curve types as defined in the methods section (red: wash-out; green: plateau enhancement; blue: persistent enhancement; the shades denote the initial enhancement: dark: slow, intermediate: medium, bright: fast). c A histogram of ktrans while E shows a histogram of ve values. The signal-intensity time curves for the whole lesion (white), the maximum initial enhancement (purple), the maximum wash-out (green), and the maximum initial enhancement to wash-out curve (turquoise) are shown in d. The figure presents some of the visualization methods provided by the software used for image data analysis. All raw data were exported voxel-wise for further analysis as specified in the methods section. The A.I. classifier provided a pseudo-probability of malignancy of 77% which was above both C1 and C2 thresholds
Fig. 3
Fig. 3
Visualization example of the volumetric analysis of a fibroadenoma B2 (benign finding in biopsy, no further procedure needed) in a 34-year-old woman. a The segmentation also shown in Fig. 1, (b) the distribution of enhancement curve types as defined in the methods section (red: wash-out; green: plateau enhancement; blue: persistent enhancement; the shades denote the initial enhancement: dark: slow, intermediate: medium, bright: fast). c A histogram of ktrans, e a histogram of ve values. The signal-intensity time curves for the whole lesion (white), the maximum initial enhancement (purple), the maximum wash-out (green), and the most suspect curve (turquoise) are shown in d. The figure presents some of the visualization methods provided by the software used for image data analysis. All raw data were exported voxel-wise for further analysis as specified in the methods section. The A.I. classifier provided a pseudo-probability of malignancy of 6% which was below both C1 and C2 thresholds
Fig. 4
Fig. 4
Receiver operating characteristics (ROC) curves for the training (a) and testing (b) datasets. Detailed results are given in the Results section and Table 2

Similar articles

Cited by

References

    1. Sardanelli F, Boetes C, Borisch B, et al. Magnetic resonance imaging of the breast: recommendations from the EUSOMA working group. Eur J Cancer. 2010;46:1296–1316. doi: 10.1016/j.ejca.2010.02.015. - DOI - PubMed
    1. Clauser P, Mann R, Athanasiou A, et al. A survey by the European Society of Breast Imaging on the utilisation of breast MRI in clinical practice. Eur Radiol. 2018;28:1909–1918. doi: 10.1007/s00330-017-5121-4. - DOI - PMC - PubMed
    1. Bakker MF, de Lange SV, Pijnappel RM, et al. Supplemental MRI screening for women with extremely dense breast tissue. N Engl J Med. 2019;381:2091–2102. doi: 10.1056/NEJMoa1903986. - DOI - PubMed
    1. Comstock CE, Gatsonis C, Newstead GM, et al. Comparison of abbreviated breast MRI vs digital breast tomosynthesis for breast cancer detection among women with dense breasts undergoing screening. JAMA. 2020;323:746–756. doi: 10.1001/jama.2020.0572. - DOI - PMC - PubMed
    1. Verburg E, van Gils C, Bakker M, et al (2020) Computer-aided diagnosis in multiparametric magnetic resonance imaging screening of women with extremely dense breasts to reduce false-positive diagnoses. Invest Radiol https://pubmed.ncbi.nlm.nih.gov/32149858/. Accessed 2 Jun 2020 - PubMed