. 2021 Aug;141(8):2018-2027.e4.
doi: 10.1016/j.jid.2020.12.035. Epub 2021 Mar 18.

The Molecular Context of Vulnerability for CDK9 Suppression in Triple Wild-Type Melanoma

Affiliations

The Molecular Context of Vulnerability for CDK9 Suppression in Triple Wild-Type Melanoma

Samantha M Guhan et al. J Invest Dermatol. 2021 Aug.

Abstract

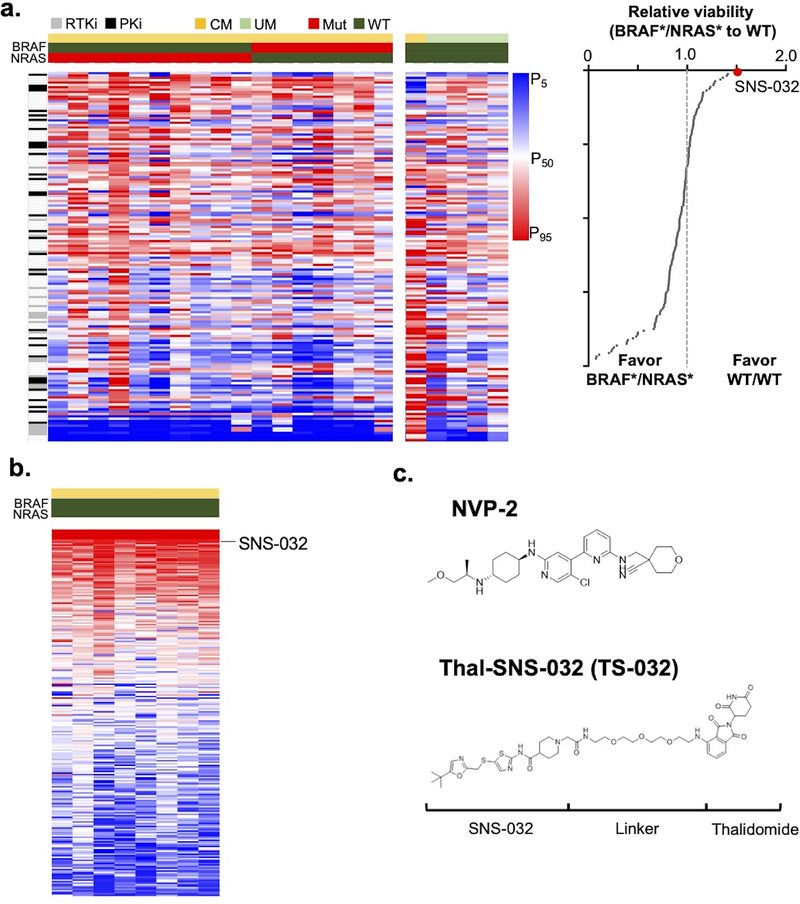
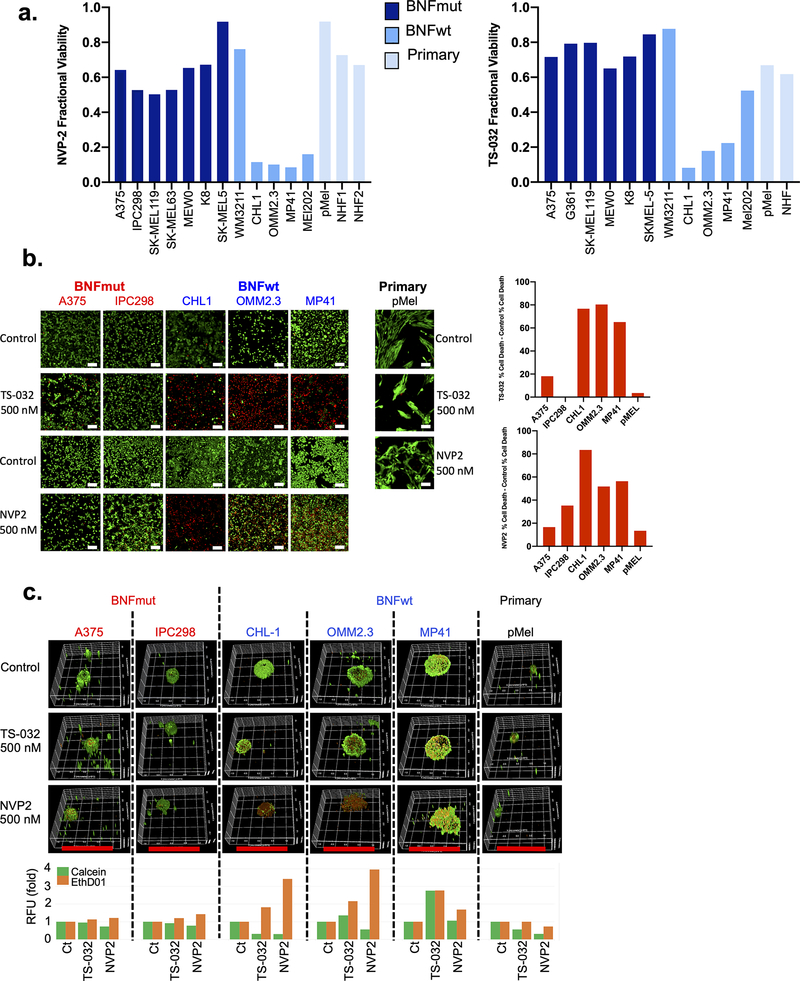
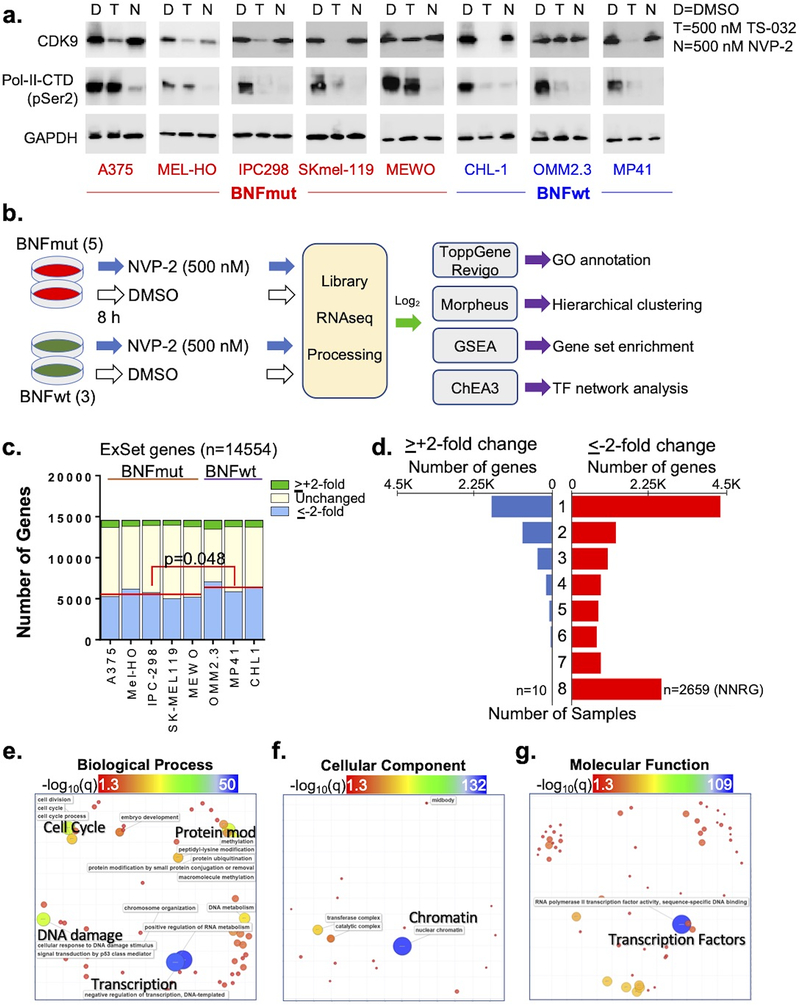
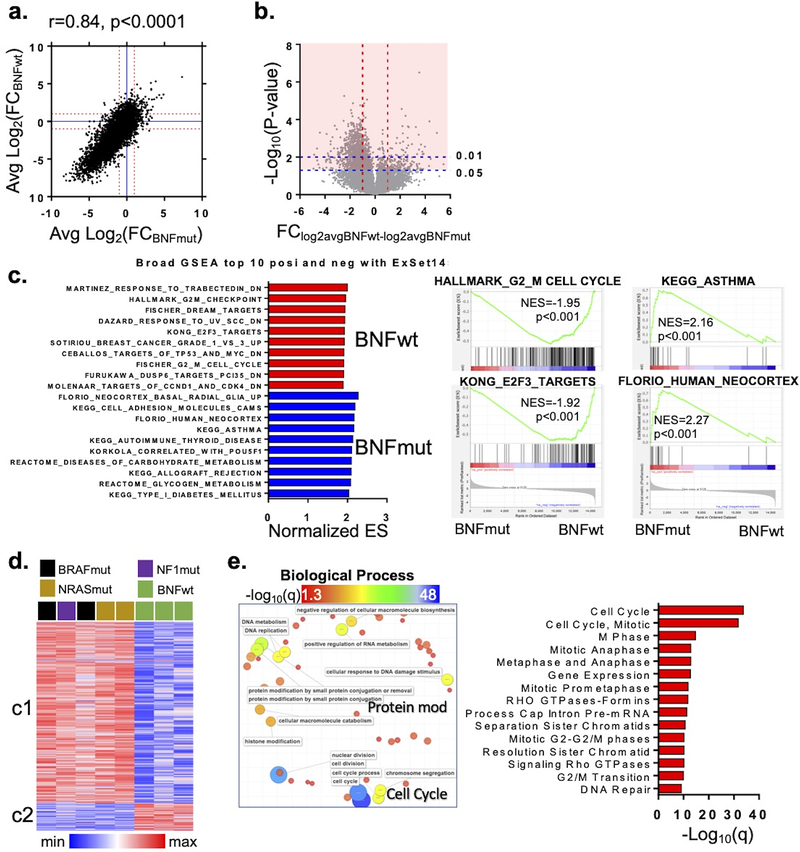
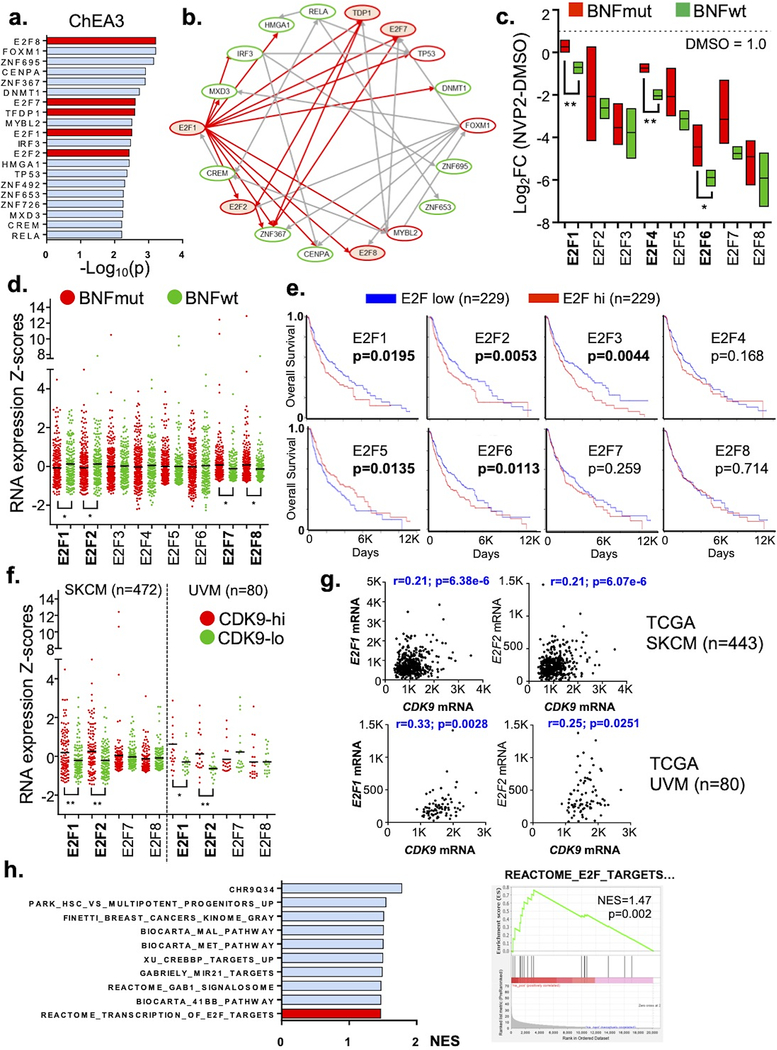
Approximately half of melanoma tumors lack a druggable target and are unresponsive to current targeted therapeutics. One proposed approach for treating these therapeutically orphaned tumors is by targeting transcriptional dependencies (oncogene starvation), whereby survival factors are depleted through inhibition of transcriptional regulators. A drug screen identified a CDK9 inhibitor (SNS-032) to have therapeutic selectivity against wild-type (wt) BRAFwt/NRASwt melanomas compared with BRAFmut/NRASmut mutated melanomas. We then used two strategies to inhibit CDK9 in vitro-a CDK9 degrader (TS-032) and a selective CDK9 kinase inhibitor (NVP-2). At 500 nM, both TS-032 and NVP-2 demonstrated greater suppression of BRAFwt/NRASwt/NF1wt cutaneous and uveal melanomas than mutant melanomas. RNA sequencing analysis of eight melanoma lines with NVP-2 treatment demonstrated that the context of this vulnerability appears to converge on a cell cycle network that includes many transcriptional regulators, such as the E2F family members. The Cancer Genome Atlas human melanoma tumor data further supported a potential oncogenic role for E2F1 and E2F2 in BRAFwt/NRASwt/NF1wt tumors and a direct link to CDK9. Our results suggest that transcriptional blockade through selective targeting of CDK9 is an effective method of suppressing therapeutically orphaned BRAF/NRAS/NF1 wt melanomas.


Figures

Figure 1:
Figure 1:. Comparative Genotype Drug Screen.
(a) Left panel, heatmap of viability for 23 melanoma lines (7 BRAF(V600E)-mutated lines, 11 NRAS-mutated lines (10 NRAS(Q61) and 1 NRAS(G12V) mutations), and 5 BRAFwt/NRASwt (4 uveal and 1 cutaneous melanoma line) screened against 158 Target Agents (10 μM; Table S1); Right panel, ratio of BRAF*/NRAS* lines to double WT lines. (b) Heat map of drug screen response in BRAFwt/NRASwt lines from Zhang et al. designating position of SNS-032. (c) Structures of a competitive CDK9 inhibitor (NVP-2) and the CDK9 degrader (TS-032). BRAF*, BRAF(V600E) mutated; NRAS*, NRAS mutated.
Figure 2:
Figure 2:. CDK9 Suppression Preferentially Targets Triple WT Melanomas.
(a) Cell viability of BNFmut (dark blue bars), BNFwt (medium blue bars), and primary cells (light blue bars; immortalized melanocytes, pMEL or normal human fibroblasts, NHF) after 24 hours of treatment with 500 nm TS-032 (left panel) or NVP-2 (right panel). Live(green)/dead (red) imaging and quantification of melanoma lines after 24 hours of 500 nm TS-032 and NVP-2 treatment in (b) 2D cultures (scale bar = 100 micrometers) or (c) 3D spheroid cultures (scare bar = 2 millimeters or 2000 micrometers). BNFwt, BRAF/NRAS/NF1 wildtype; BNFmut, BRAF/NRAS/NF1 mutated.
Figure 3.
Figure 3.. Identification of common NVP-2 response pathways.
(a) Western blots showing CDK9, RNA-Pol-II CTD-Ser phosphorylation and GAPDH 8 hrs after exposure to DMSO (D), 500 nMTS-032 (T) and 500 nM NVP-2. (b) Schematic of workflow for molecular analysis. (c) Changes in gene expression across 8 cell lines. Red line shown shows average number of genes that decreased by ≤−2x in BNFmut vs BNFwt lines. (d) Number of upregulated (blue, >+2x) or downregulated (red, <−2x) genes that are shared by 1–8 samples. GO annotations for 2659 NNRGs as computed by ToppGene and semantically trimmed by Revigo for Biological Processes (e), Cellular Component (f) and Molecular Function (g). Heatmap and size of circles are proportional to –log(q) of association. NNRG, NVP-2 negative response gene.
Figure 4.
Figure 4.. Distinct molecular pathways distinguish BNFwt from BNFmut lines.
(a) Scatterplot of log2FC’s for NVP-2-DMSO in BNFwt vs BNFmut cell lines. (b) Volcano plot of average Log2 fold changes ((avg log2 BNFwt) - (avg log2 BNFmut)) and –log10(p value). Red shading highlights n=2029 genes whose response to NVP-2 were significantly (p<0.05) different between BNFmut and BNFwt cells (c) Left panel, gene set enrichment analysis of all 14554 ExSet genes pre-ranked log2FC(NVP-DMSO) for BNFwt and BNFmut; right panel, representative graphs. (d) Unsupervised hierarchical clustering of 2029 genes into BNFmut vs BNFwt branches and c1 vs c2 clusters. c1 cluster genes strongly mapped to cell cycle (e) GO terms and (f) pathways.
Figure 5.
Figure 5.. Transcriptional Networks Associated with BNFwt cells.
(a) ChEA3 analysis of top ranking DNA binding proteins using 2029 cluster 1 (c1) genes. E2F family members highlighted in red. (b) TF interactome of top 20 DNA binding proteins. Red ovals indicate known cell cycle regulators; Arrows indicate evidence of TF binding at target as determined by ChIP-seq data, red arrows indicate known E2F TF targets. (c) Decrease in E2F transcription factors with NVP-2 among BNFmut and BNFwt cell lines. (d) Normalized RNA expression levels from TCGA SKCM cohort as stratified by BNFmut vs BNFwt samples. BNFmut tumors were defined as BRAF(V600E) + NRAS(G12–13, Q61) + all NF1 mutations. BNFwt tumors are all other samples. (e) Overall survival as determined by EF2-hi vs EF2-low samples (cut at median expression). (f) Normalized RNA expression in TCGA SKCM and UVM specimens as stratified by CDK9-hi vs CDK9-low samples (cut at 25th percentile (low) and 75th percentile (hi)). (g) Correlation between CDK9 and E2F1 and E2F2 in SKCM and UVM samples. (h) GSEA of pre-ranked TCGA SKCM samples (from most highly correlated to least). * p<0.05; ** p<0.01

Similar articles

Cited by

References

    1. Alla V, Engelmann D, Niemetz A, Pahnke J, Schmidt A, Kunz M, et al. E2F1 in melanoma progression and metastasis. J Natl Cancer Inst 2010;102(2):127–33. - PubMed
    1. Attwooll C, Lazzerini Denchi E, Helin K. The E2F family: specific functions and overlapping interests. EMBO J 2004;23(24):4709–16. - PMC - PubMed
    1. Bartkowiak B, Liu P, Phatnani HP, Fuda NJ, Cooper JJ, Price DH, et al. CDK12 is a transcription elongation-associated CTD kinase, the metazoan ortholog of yeast Ctk1. Genes & development 2010;24(20):2303–16. - PMC - PubMed
    1. Brahmer JR, Drake CG, Wollner I, Powderly JD, Picus J, Sharfman WH, et al. Phase I study of single-agent anti-programmed death-1 (MDX-1106) in refractory solid tumors: safety, clinical activity, pharmacodynamics, and immunologic correlates. Journal of clinical oncology : official journal of the American Society of Clinical Oncology 2010;28(19):3167–75. - PMC - PubMed
    1. Brahmer JR, Tykodi SS, Chow LQ, Hwu WJ, Topalian SL, Hwu P, et al. Safety and activity of anti-PD-L1 antibody in patients with advanced cancer. The New England journal of medicine 2012;366(26):2455–65. - PMC - PubMed

Publication types

MeSH terms