. 2021 Jul;161(1):196-210.
doi: 10.1053/j.gastro.2021.03.022. Epub 2021 Mar 19.

Sequential Administration of XPO1 and ATR Inhibitors Enhances Therapeutic Response in TP53-mutated Colorectal Cancer

Affiliations

Sequential Administration of XPO1 and ATR Inhibitors Enhances Therapeutic Response in TP53-mutated Colorectal Cancer

Akira Inoue et al. Gastroenterology. 2021 Jul.

Abstract

Background & aims: Understanding the mechanisms by which tumors adapt to therapy is critical for developing effective combination therapeutic approaches to improve clinical outcomes for patients with cancer.

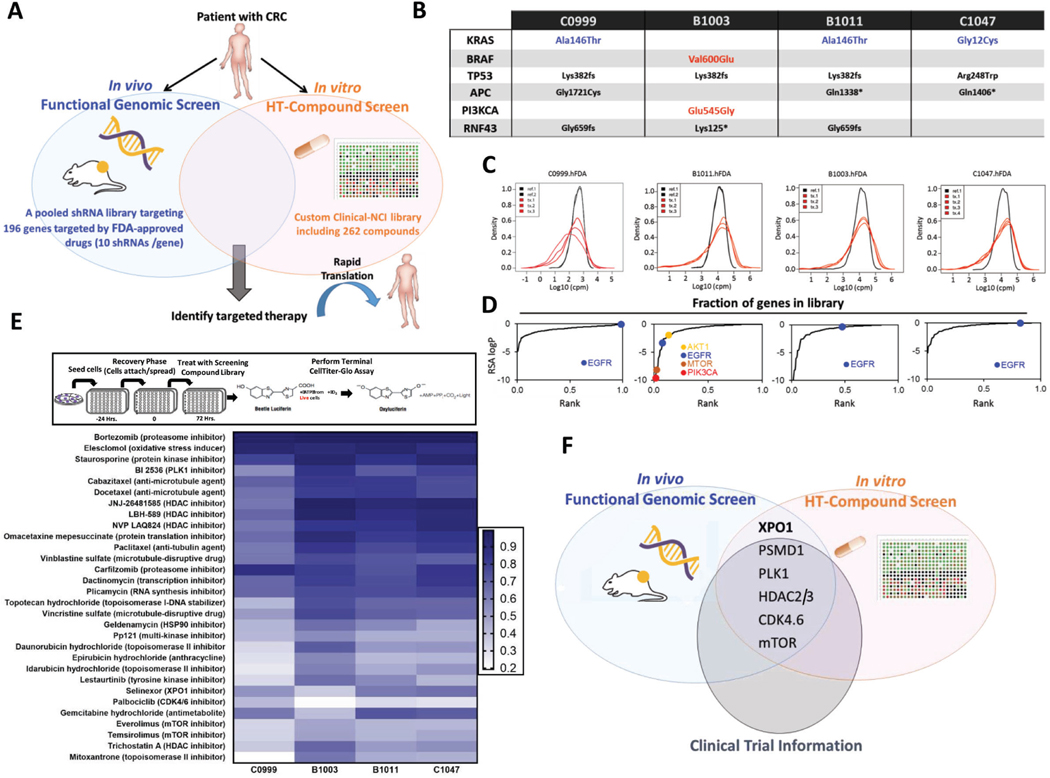
Methods: To identify promising and clinically actionable targets for managing colorectal cancer (CRC), we conducted a patient-centered functional genomics platform that includes approximately 200 genes and paired this with a high-throughput drug screen that includes 262 compounds in four patient-derived xenografts (PDXs) from patients with CRC.

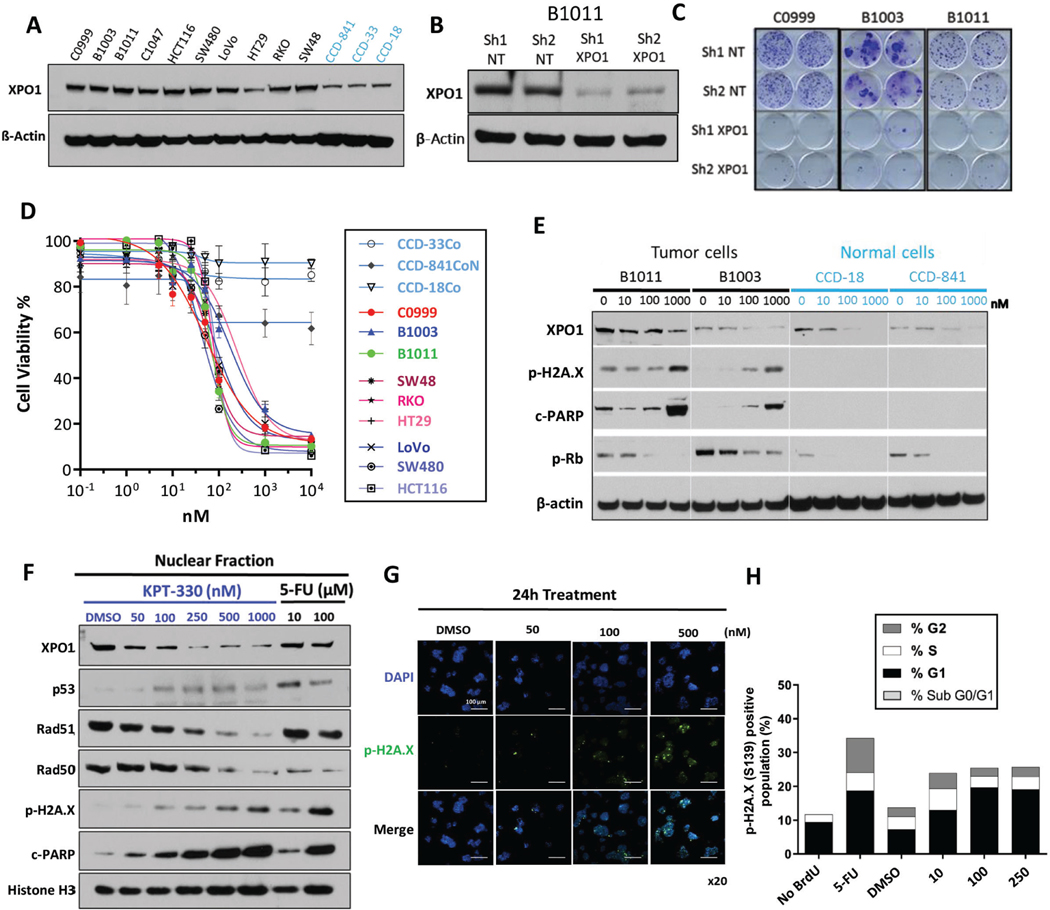
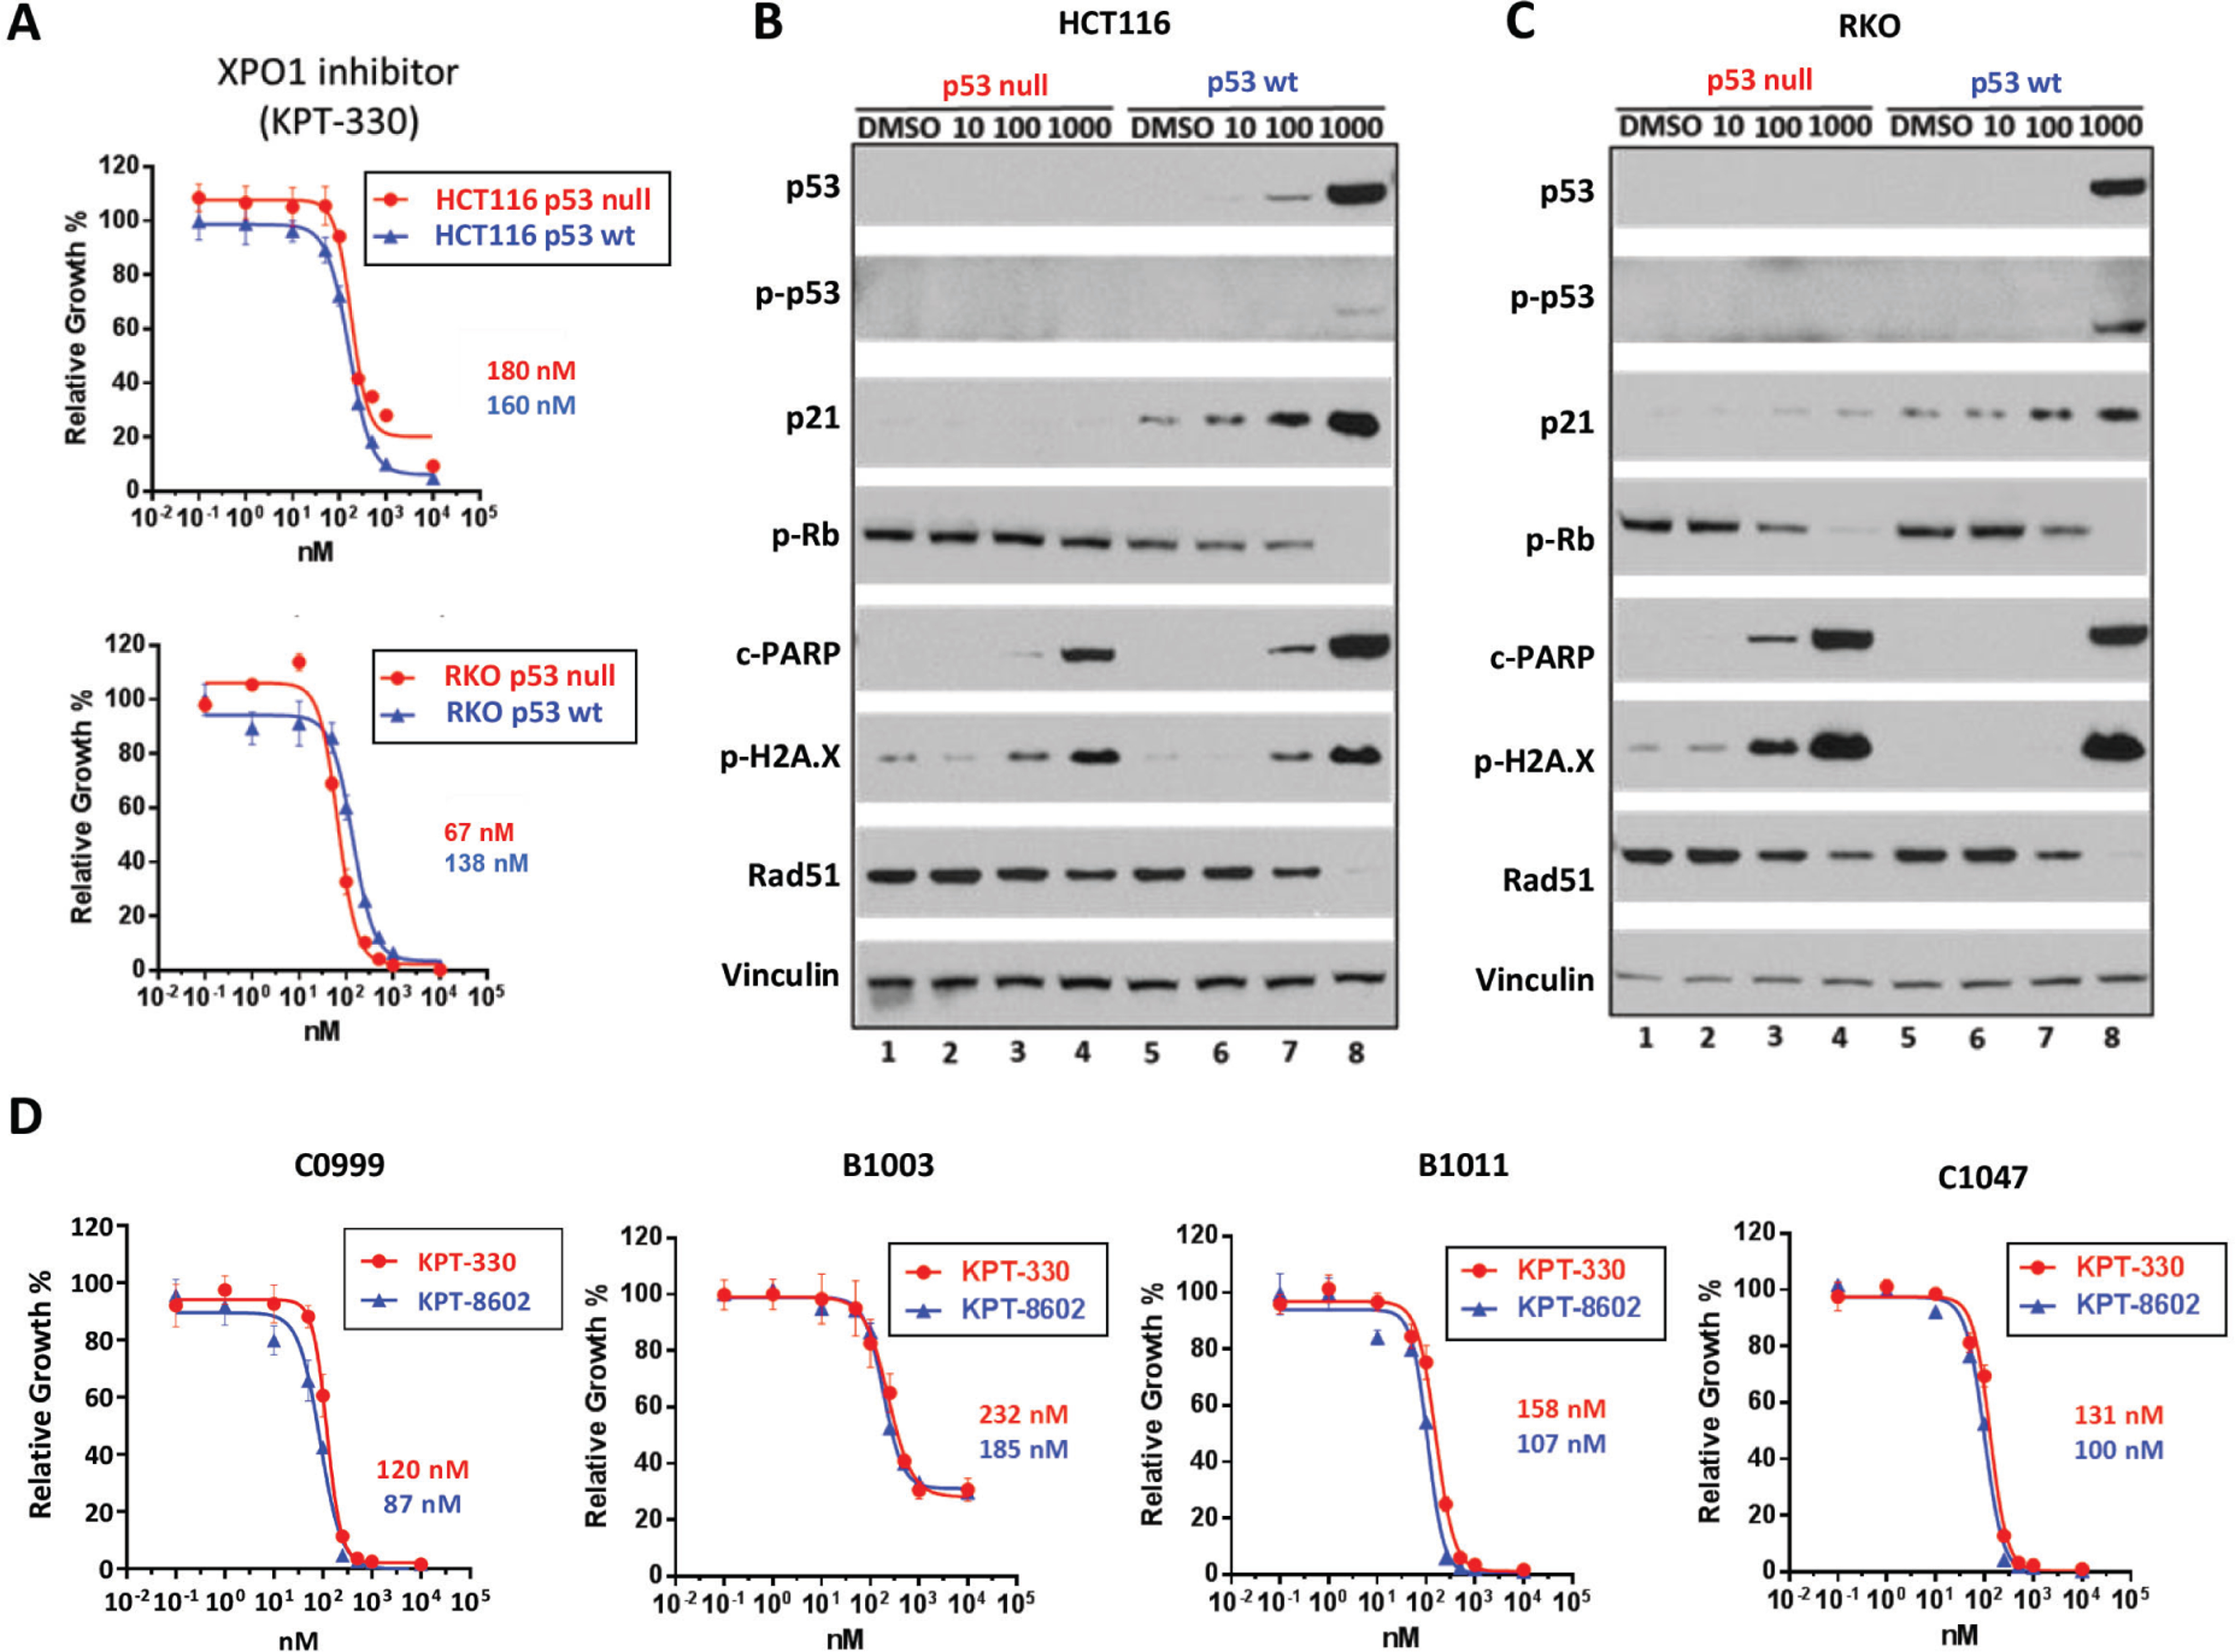
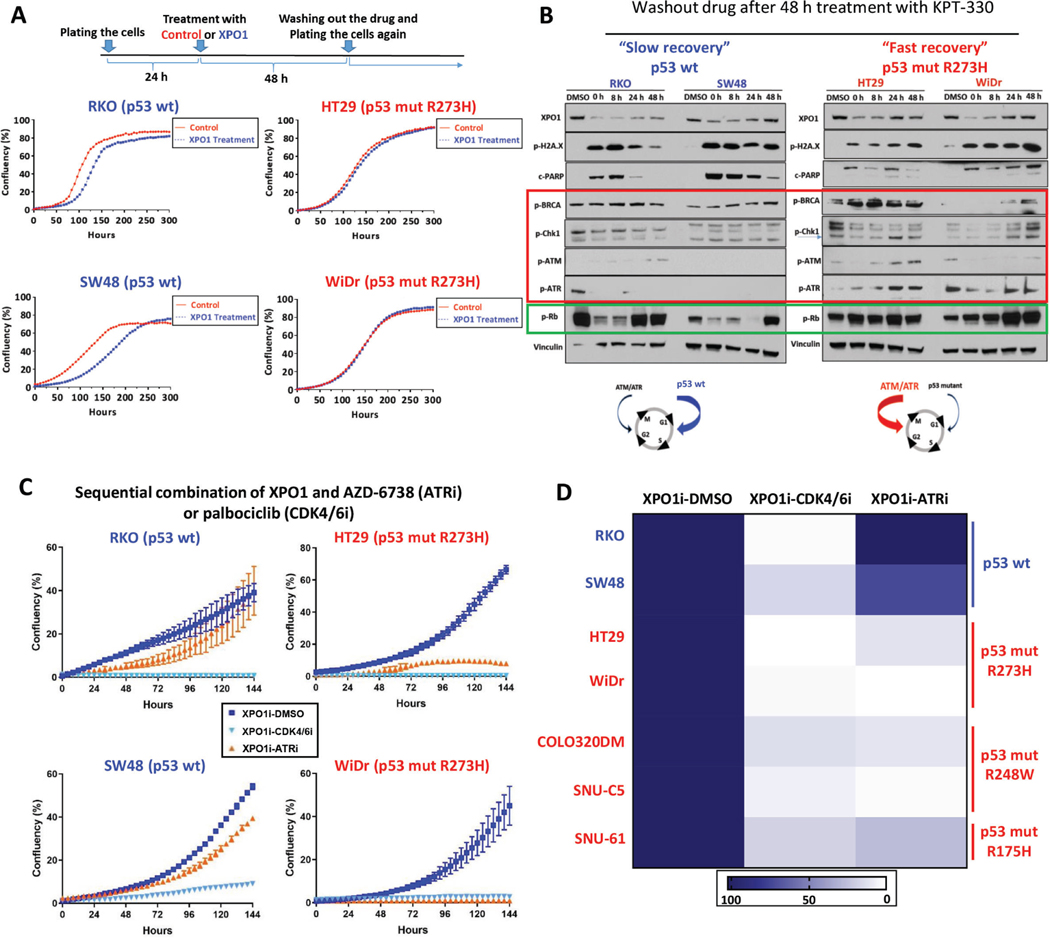
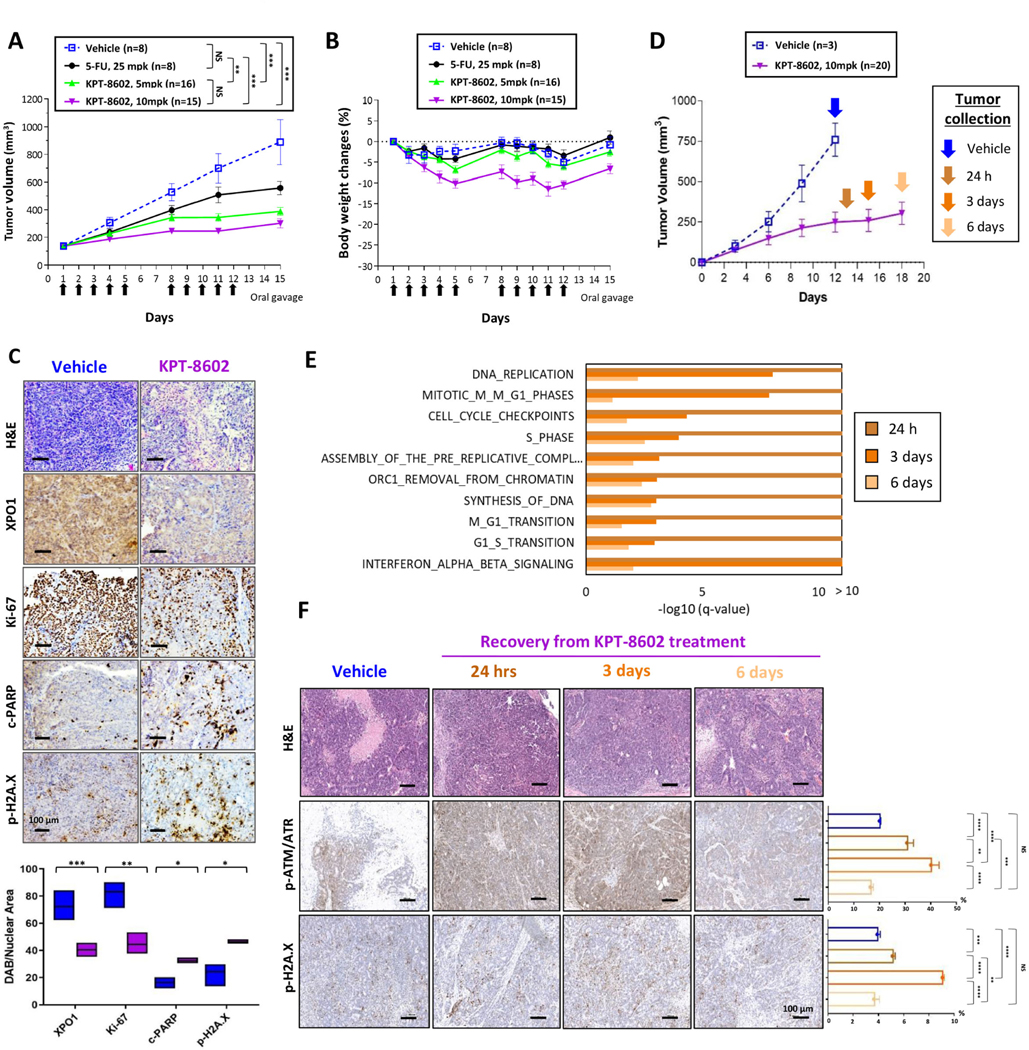
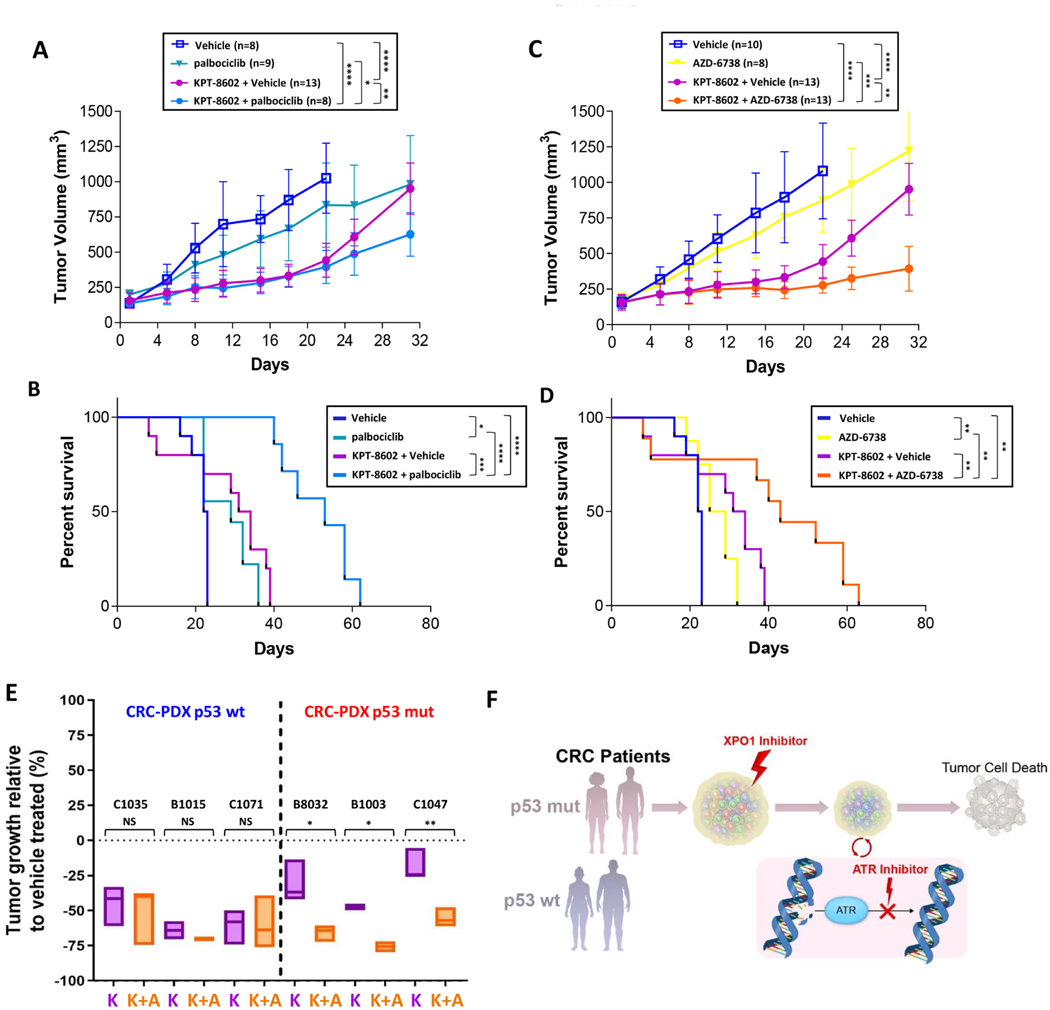
Results: Both screening methods identified exportin 1 (XPO1) inhibitors as drivers of DNA damage-induced lethality in CRC. Molecular characterization of the cellular response to XPO1 inhibition uncovered an adaptive mechanism that limited the duration of response in TP53-mutated, but not in TP53-wild-type CRC models. Comprehensive proteomic and transcriptomic characterization revealed that the ATM/ATR-CHK1/2 axes were selectively engaged in TP53-mutant CRC cells upon XPO1 inhibitor treatment and that this response was required for adapting to therapy and escaping cell death. Administration of KPT-8602, an XPO1 inhibitor, followed by AZD-6738, an ATR inhibitor, resulted in dramatic antitumor effects and prolonged survival in TP53-mutant models of CRC.

Conclusions: Our findings anticipate tremendous therapeutic benefit and support the further evaluation of XPO1 inhibitors, especially in combination with DNA damage checkpoint inhibitors, to elicit an enduring clinical response in patients with CRC harboring TP53 mutations.

Keywords: CRC; Combination Therapy; Genomic Biomarker; PDX.


Conflict of interest statement

Competing interests: G.F.D. is scientific advisor of Karyopharm Therapeutics. All other authors have no conflicts.

Figures

Figure 1.
Figure 1.
Integrated genomic and pharmacologic screening using CRC PDX models to identify therapeutic opportunities (A) Schematic of orthogonal screening platform: in vivo shRNA screens in CRC PDXs using a pooled genetic library targeting products of 196 FDA-approved or under clinical investigation genes was combined with in vitro high-throughput compound screens using a Custom Clinical NCI-library including 262 compounds. (B) Genetic landscape of 4 CRC PDXs in the in vitro and in vivo screening pipeline. Three out of four models displayed KRAS mutations (C0999, B1011 and C1047); one of the models harbored BRAF/PIK3CA mutation (B1003). (C) Density distribution of barcodes (shRNA) for transduced PDX cells (References) and three in vivo tumor replicates (Tx 1, 2 and 3) from 4 CRC PDXs infected with the FDAome shRNA lentiviral library. (D) Fraction of scoring genes in the library. Gene-rank analysis highlighting behavior of EGFR, AKT1, mTOR and PIK3CA hits in the FDAome in vivo screens executed in 4 independent CRC PDX models: C0999, B1003, B1011 and C1047 (RSA = redundant shRNA activity, logP). (E) Schematic of the high-throughput drug screen workflow and heatmap of the 30 most potent compounds and their AUCs for the 4 PDX models’ responses to drug exposure in vitro. Results were classified into 4 groups calculated by the extension of the area under the curve (AUCn; Class 1: AUCn≥0.7; Class2: AUCn≥0.4; Class3: AUCn>0.1; Class4: AUCn<0.1). (F) Topscoring genes and corresponding compounds were prioritized for investigation by integrating the orthogonal screening results with currently available clinical trial information in CRC.
Figure 2.
Figure 2.
Selective XPO1 inhibition drives DNA damage-dependent lethality in CRC (A) XPO1 expression level across CRC models (black, cell lines and PDX-derived primary cultures) and colon epithelial cells (light blue). (B) Knockdown efficiency of XPO1 using 2 independent shRNAs in B1011 PDX-derived cell line compared to 2 shNT (Non-targeting) controls. (C) Colony formation assay in C0999, B1003 and B1011 cells expressing shNT or XPO1-targeting shRNA. (D) Sensitivity to KPT-330 across a panel of CRC models (cell lines and PDX-derived primary cultures) and colon epithelial cells (light blue) based on ATP viability assay (96h). (E) Expression of indicated proteins in CRC (black) or normal colon epithelial (light blue) cells treated with KPT-330 at indicated doses for 24h. (F) Nuclear fraction of protein expression in B1011 PDX-derived cells treated with KPT-330 at indicated dose for 24h. 5-FU serves as positive control. (G) Immunofluorescence staining of phospho-H2A.X and DAPI in B1011 PDX-derived primary cells treated with DMSO or KPT-330 at indicated doses for 24h. (H) FACS analysis for cell-cycle (BrdU incorporation) and DNA damage accumulation (phospho-H2A.X). β-actin and Histone H3 serve as loading controls in Western analyses. Representative image from 3 independent experiments is shown. All data are mean ± S.D. of biological replicates (n=3 each). All the experiments were repeated 3 times.
Figure 3.
Figure 3.
Selective XPO1 inhibition induces DNA damage and apoptosis independent of TP53 status in CRC (A) Sensitivity to KPT-330 in HCT116 (upper panel) and RKO (lower panel) TP53 isogenic pairs based on ATP viability assay (96h). (B, C) Protein expression in HCT116 (B) and RKO (C) TP53 isogenic pairs treated with KPT-330 at indicated dose for 24h. (D) Four CRC PDX-derived cell lines were treated with KPT-330 or KPT-8602 at indicated concentration for 96h, and viability was assessed based on ATP activity. IC50 values are shown on the side. Representative image from 3 independent experiments is shown. All data are mean ± S.D. of biological replicates (n=3 each). All the experiments were repeated 3 times.
Figure 4.
Figure 4.
Differential TP53-dependent adaptation to XPO1 inhibition in CRC (A) TP53 wild type (RKO and SW48) and mutant (HT29 and WiDr) cells were treated with DMSO or KPT-330 (100nM) for 48h. Then, drugs were washed out and cells re-seeded onto 24-well plates. Confluence was monitored by IncuCyte to evaluate the recovery dynamics. (B) TP53 wild type (RKO and SW48) and mutant (HT29 and WiDr) cells were treated with DMSO or KPT-330 (100nM) for 48h. Then, drugs were washed out and protein expression analyzed by Western blotting at time indicated after washout (red box, DDR proteins; green box, Rb). (C) Sensitivity to KPT-330 followed by AZD-6738 or palbociclib in TP53 wild type (RKO and SW48) and mutant (HT29 and WiDr) cells (n=3). All the cells were treated with KPT-330 (100nM) for 48h followed by washout and reseeding onto 24-well plates. Cells were then treated with DMSO, AZD-6738 (1μM) or palbociclib (1μM). Confluence was monitored by IncuCyte to evaluate recovery dynamics during the second treatment. (D) Heatmap of normalized confluence (mean of three replicates) at 144h for TP53 wild type (RKO and SW48) and mutant (HT29, WiDr, COLO320DM, SNU-C5, SNU-61) CRC cells treated with KPT-330 (100nM) followed by either DMSO, AZD-6738 (1μM) or palbociclib (1μM). Representative image from 3 independent experiments is shown. All data are mean ± S.D. of biological replicates (n=3 each). All experiments were repeated 3 times.
Figure 5.
Figure 5.
Second-generation XPO1 inhibitor KPT-8602 shows potent anti-tumor activity in TP53-mutant CRC (A, B) Animals harboring tumors derived from TP53-mutant B1011 PDX model were randomized to treatment with vehicle, 25 mpk 5-FU, or 5 or 10 mpk KPT-8602. Arrows indicate days of oral dosing for KPT-8602. Tumor volumes (A) and body weight changes (B) are shown. (C) Representative images and signal quantification of IHC staining (Hematoxylin and Eosin (H&E), XPO1, Ki-67, cleaved-PARP, phospho-H2A.X) for B1011 treated with either vehicle or KPT-8602 at 10mpk. (D) Animals harboring B1011-derived tumors were randomized to vehicle or 10 mpk KPT-8602 for 12 days. Tumors were collected during drug recovery period at indicated time points. (E) Top ten enriched REACTOME pathways (Fisher’s exact test) for differentially expressed genes during drug recovery period at indicated time points. (F) Representative images of IHC staining (H&E, phospho-ATR/ATM, phospho-H2A.X) from tumors harvested from animals described in (D) at indicated time point during recovery. NS, not significant; *P<0.05; **P<0.01; ***P<0.001; ****P<0.0001 by unpaired two-tailed t-test. Bar = 100 μm.
Figure 6.
Figure 6.
Sequential dosing with KPT-8602 and palbociclib or AZD-6738 prolongs treatment response and survival in TP53-mutant CRCs (A, B) Animals harboring tumors derived from TP53-mutant B1011 model were randomized to treatment with vehicle, palbociclib (100mpk) or KPT-8602 (10mpk) for 2wk followed by vehicle or palbociclib for 2wk. Tumor growth (A) and Kaplan-Meier survival (B) curves are shown. (C, D) Animals harboring tumors derived from B1011 were randomized to treatment with vehicle, AZD-6738 (50mpk) or KPT-8602 (10mpk) for 2wk followed by vehicle or AZD-6738 for 2wk. Tumor growth (C) and Kaplan-Meier survival (D) curves are shown. (E) End-point tumor growth comparison (%) between treated groups (K: KPT-8602, K+A: KPT-8602+AZD-6738) and vehicle in three TP53 wild type and three TP53-mutant CRC PDXs. Endpoint tumor volumes were defined as the last measurements for each tumor when vehicle-treated tumors reached the ethical limit (see Suppl. Fig. 6). (F) Illustration of TP53-dependent adaption to DNA damage induced by XPO1 inhibition and the informed sequential combinations for patient-stratified clinical trial designs with CDK4/6 or ATR inhibitors in CRC. Tumor growth analysis: NS = not significant, *P<0.05, **P<0.01, ***P<0.001, ****P<0.0001 by unpaired two-tailed t-test. Survival analysis: *P<0.05, **P<0.01, ***P<0.001, ****P<0.0001 by Mantel-Cox test.

Comment in

  • Trapping Colorectal Cancer Into a Dead-end.
    Clemons NJ, Phillips WA. Clemons NJ, et al. Gastroenterology. 2021 Jul;161(1):33-35. doi: 10.1053/j.gastro.2021.03.046. Epub 2021 Mar 31. Gastroenterology. 2021. PMID: 33798528 No abstract available.

Similar articles

Cited by

References

    1. Siegel RL, Miller KD, Fuchs HE, et al. Cancer Statistics, 2021. CA Cancer J Clin 2021;71:7–33. - PubMed
    1. Lawrence MS, Stojanov P, Polak P, et al. Mutational heterogeneity in cancer and the search for new cancer-associated genes. Nature 2013;499:214–218. - PMC - PubMed
    1. Cancer Genome Atlas N Comprehensive molecular characterization of human colon and rectal cancer. Nature 2012;487:330–7. - PMC - PubMed
    1. Solomon BJ, Mok T, Kim DW, et al. First-line crizotinib versus chemotherapy in ALK-positive lung cancer. N Engl J Med 2014;371:2167–77. - PubMed
    1. Chapman PB, Hauschild A, Robert C, et al. Improved survival with vemurafenib in melanoma with BRAF V600E mutation. N Engl J Med 2011;364:2507–16. - PMC - PubMed

Publication types

MeSH terms