. 2021 Jan-Jun:296:100566.
doi: 10.1016/j.jbc.2021.100566. Epub 2021 Mar 18.

Nutrient availability regulates proline/alanine transporters in Trypanosoma brucei

Affiliations

Nutrient availability regulates proline/alanine transporters in Trypanosoma brucei

Alexander C Haindrich et al. J Biol Chem. 2021 Jan-Jun.

Abstract

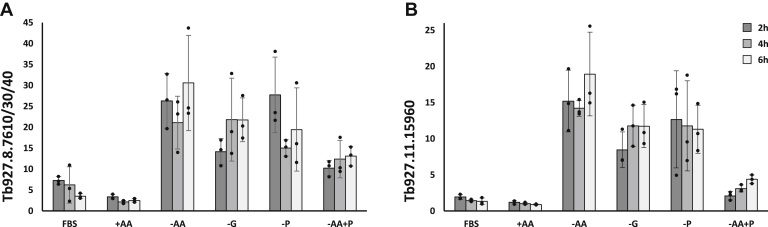
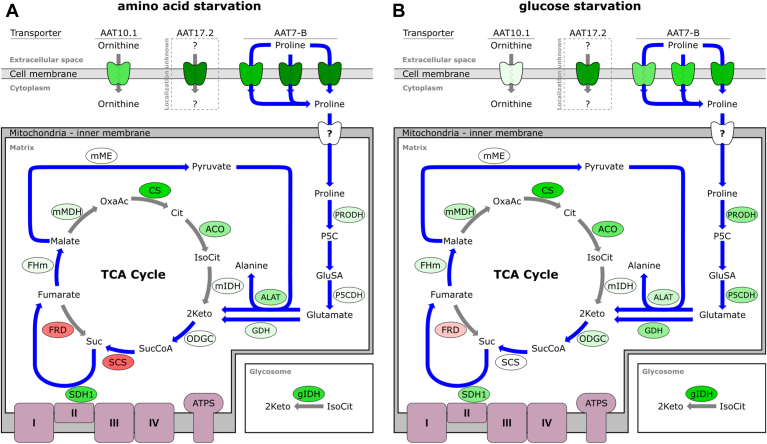
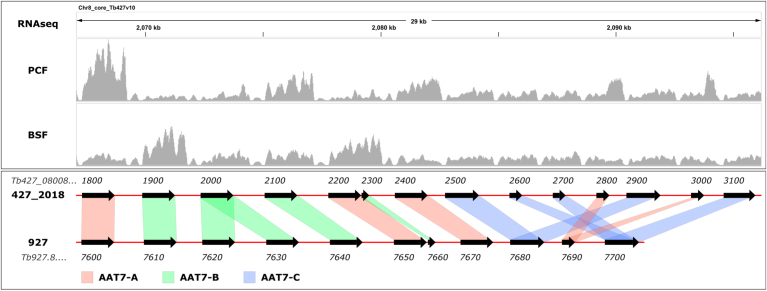
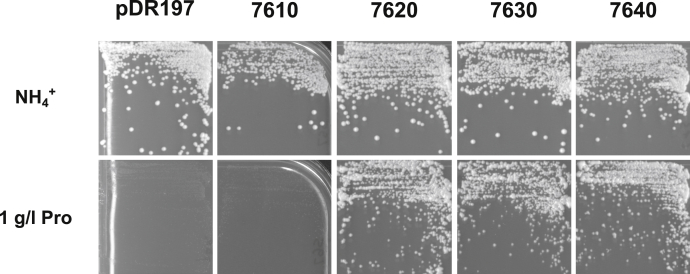
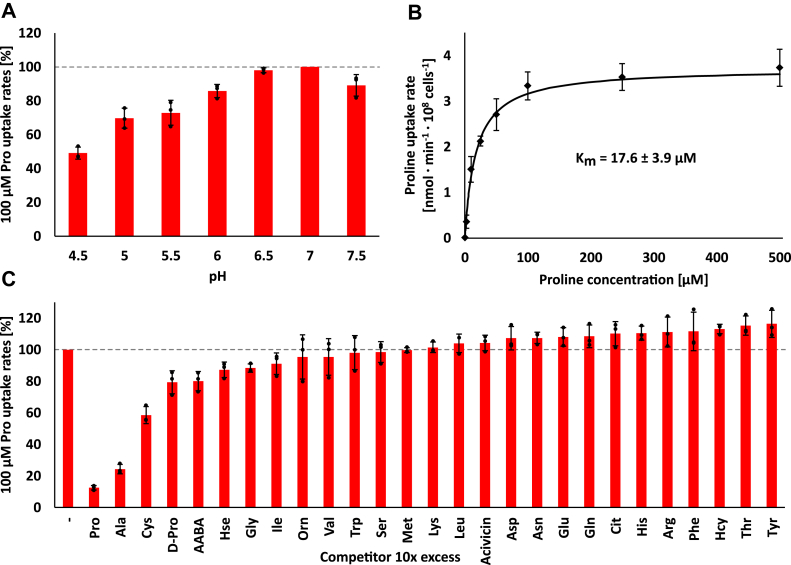
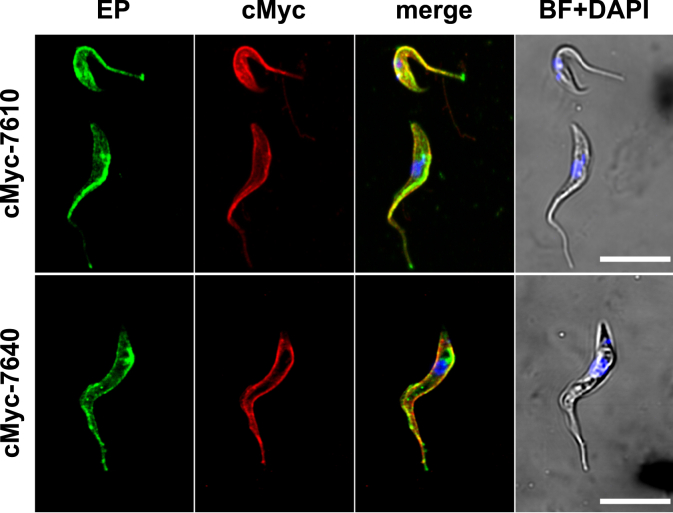
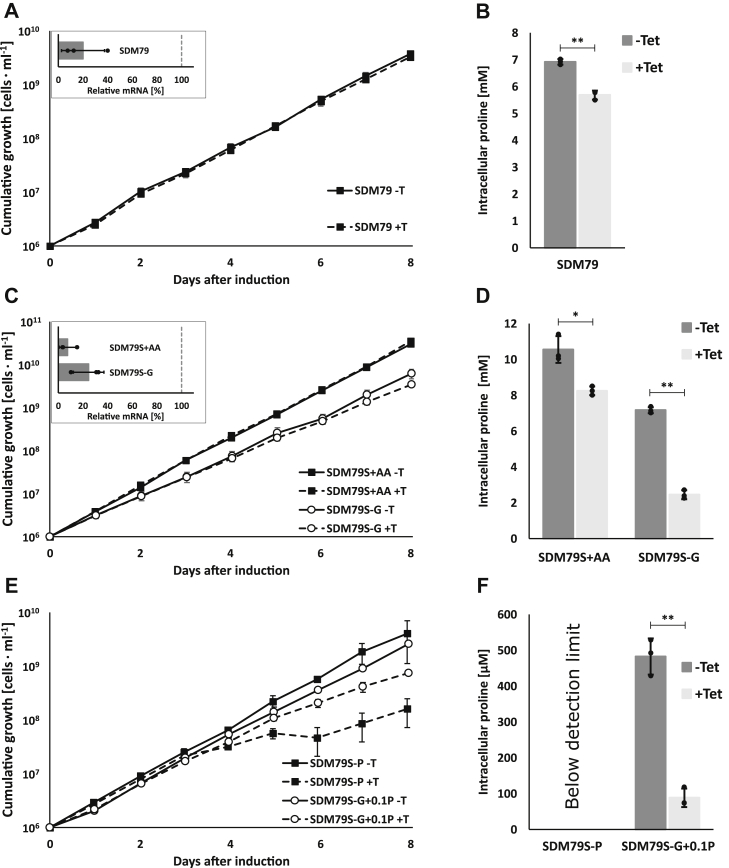
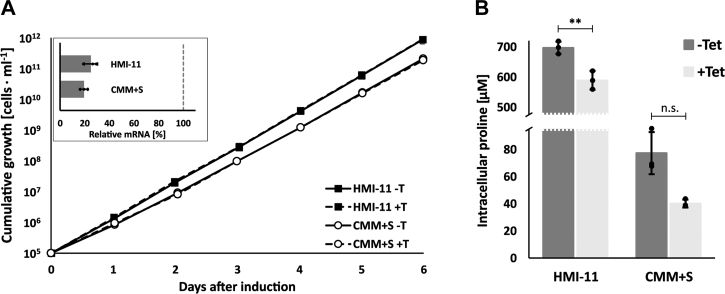
Trypanosoma brucei is a species of unicellular parasite that can cause severe diseases in livestock and humans, including African trypanosomiasis and Chagas disease. Adaptation to diverse environments and changes in nutritional conditions is essential for T. brucei to establish an infection when changing hosts or during invasion of different host tissues. One such adaptation is the ability of T. brucei to rapidly switch its energy metabolism from glucose metabolism in the mammalian blood to proline catabolism in the insect stages and vice versa. However, the mechanisms that support the parasite's response to nutrient availability remain unclear. Using RNAseq and qRT-PCR, we investigated the response of T. brucei to amino acid or glucose starvation and found increased mRNA levels of several amino acid transporters, including all genes of the amino acid transporter AAT7-B subgroup. Functional characterization revealed that AAT7-B members are plasma membrane-localized in T. brucei and when expressed in Saccharomyces cerevisiae supported the uptake of proline, alanine, and cysteine, while other amino acids were poorly recognized. All AAT7-B members showed a preference for proline, which is transported with high or low affinity. RNAi-mediated AAT7-B downregulation resulted in a reduction of intracellular proline concentrations and growth arrest under low proline availability in cultured procyclic form parasites. Taken together, these results suggest a role of AAT7-B transporters in the response of T. brucei to proline starvation and proline catabolism.

Keywords: Trypanosoma brucei; amino acid; amino acid transport; cell metabolism; energy metabolism; gene expression; parasite metabolism; transcriptomics; transporter.


Conflict of interest statement

Conflict of interest The authors declare that they have no conflicts of interest with the contents of this article.

Figures

Figure 1
Figure 1
qRT-PCR analysis of starved PCF. qRT-PCR analysis of amino acid transporter expression of T. brucei 29-13 starved for 2 h (dark gray), 4 h (medium gray), or 6 h (light gray) of glucose (G), amino acids (AA) or proline (P). y-Axis shows the expression of (A) Tb927.8.7610/30/40 or (B) Tb927.11.15960s, relative to the reference gene TERT. Media composition as described in Table 1 and Table S1. FBS, commercial SDM79 + 10%FBS; +AA, starvation medium SDM79S containing amino acids and glucose, but no FBS; −AA, starvation medium SDM79S containing glucose, but no amino acids and no FBS, −G; starvation medium SDM79S containing amino acids, but no glucose and no FBS; −P, starvation medium SDM79S containing amino acids and glucose, but no proline and no FBS; −AA+P, starvation medium SDM79S containing glucose and proline, but no other amino acids. Bars show the average of three independent experiments, error bars represent SD, black dots show individual data points.
Figure 2
Figure 2
Overview of metabolic genes regulated in starved T. brucei PCF. The scheme shows enzymes and transporters regulated in PCF cells starved of (A) amino acids or (B) glucose. Blue arrows show pathways involved in proline metabolism. Enzymes (in bubbles) and amino acid transporters (AATs, apple shape) are color coded according to Table 2. Color is intermediate of replicates I and II after 6 h of starvation. Transporter: AAT10.1, ornithine transporter Tb927.8.8290; AAT17.2, uncharacterized transporter Tb927.11.15960, AAT7-B, proline transporter Tb927.8.7610, Tb927.8.7630, Tb927.8.7640 (from left to right). ACO, aconitase; ALAT, alanine aminotransferase; Cit, citrate; CS, citrate synthase; FHm, mitochondrial fumarate hydratase; FRD, NADH-dependent fumarate reductase; GDH, glutamate dehydrogenase; gIDH, glycosomal isocitrate dehydrogenase; GluSA, glutamate-5-semialdehyde; 2Keto, 2-ketoglutarate; IsoCit, isocitrate; mIDH, mitochondrial isocitrate dehydrogenase; mMDH, mitochondrial malate dehydrogenase; mME, mitochondrial malic enzyme; ODGC, 2-oxoglutarate dehydrogenase complex; OxaAc, oxaloacetate; P5C, pyrroline-5-carboxylate; P5CDH, pyrroline-5-carboxylate dehydrogenase; PRODH, proline dehydrogenase; SCS, succinyl-coenzyme A synthetase; Suc, succinate; SucCoA, succinyl-coenzyme A; SDH1, succinate dehydrogenase.
Figure 3
Figure 3
Genes of the AAT7 locus are differentially expressed in PCF and BSF. Upper panel shows the mapping coverage from an RNAseq experiments for PCF cells grown for 6 h in SDM79 + 10% FBS or BSF cells grown in HMI-11. Lower panel shows the architecture of the AAT7 locus using the position of the CDS for T. brucei Lister 427_2018 (51) or T. brucei TREU 927, with connection of syntenic genes. AAT7 subgroup are color coded with red for AAT7-A, green for AAT7-B and blue for AAT7-C. Genes are abbreviated with the last four digits of their TriTrypDB GeneID.
Figure 4
Figure 4
AAT7-B transporters mediate uptake of proline. Expression of the genes coding for 7610, 7620, 7630, and 7640 in S. cerevisiae mutant 22574d and growth on M.am medium containing 1 g L−1 proline (Pro) for 4 days and on nonselective minimal medium containing 5 g L−1 ammonium sulfate (NH4+) for 3 days. As control mutant 22574d transformed with the expression vector (pDR197) is shown. The overexpressed ORFs of the AAT7-B group correspond to the sequences described in Table S3.
Figure 5
Figure 5
7610 is a high-affinity proline and alanine transporter. Uptake rates of L-[3H]-proline were determined using S. cerevisiae mutant 22574d expressing 7610. A, uptake rates of 100 μM proline at different pH values. Uptake rates are shown relative to the uptake rate at pH 7 (mean ± SD, n = 3). B, proline transport kinetics. Datapoints are means of at least three independent experiments (mean ± SD, n ≥ 3). Michaelis–Menten constant is the average of Km values of independent experiments (mean ± SD, n = 4). C, uptake of 100 μM proline in the presence of different amino acids and amino acids analogs at a 10× excess (1 mM). Uptake rates are shown relative to the uncompeted proline uptake rates (−) set to 100% (mean ± SD, n = 3; 100% correspond to 6.4–7.5 nmol min−1 108 cells−1). Common L-amino acids are abbreviated with their three-letter code, other substances are D-proline (D-Pro), α-amino butyric acid (AABA), homoserine (Hse), ornithine (Orn), citrulline (Cit), and homocysteine (Hcy). Bars show the average of three independent experiments, error bars represent SD, black dots show individual data points.
Figure 6
Figure 6
7610 and 7640 are localized at the pellicular membrane. PCF 29-13 cells expressing N-terminally cMyc tagged 7610 and 7640 were immunodecorated with α-cMyc antibody (red) and α-EP-procylin (green) and visualized by confocal microscopy. DAPI (blue), brightfield (gray), scale bar 10 μm.
Figure 7
Figure 7
AAT7-B RNAi in PCF T. brucei impacts cellular proline pools while growth is reduced only under low proline availability.A, growth curve in standard SDM79 ± Tet. B, intracellular proline concentration in cells grown for 3 days in SDM79 ± Tet as described below. C, growth curves of AAT7-B RNAi cells grown in starvation medium SDM79S either containing glucose (SDM79S+AA, ▪) or low glucose (SDM79S-G, ○), ± Tet. D, intracellular proline concentrations after 3 days of growth in SDM79S or SDM79S-G, ± Tet. E, growth curves of AAT7-B RNAi cells grown in starvation medium containing glucose, but with reduced proline (SDM79S-P, ▪) or in the absence of glucose and reduced proline (SDM79S-G+0.1P, ○), ± Tet. F, intracellular proline concentrations after 3 days of growth in SDM79S-P or SDM79S-G+0.1P, ± Tet. A, C, and E, growth curve (n = 3, error bars denote SD) in the presence (+T, dashed lines) or absence of tetracycline (−T, solid line). Inserts show qRT-PCR analysis of AAT7-B gene transcript levels 3 days after start of RNAi induction. Bar shows downregulation relative to noninduced cells. AN1 was used as reference gene (mean ± SD, n = 3, dots show individual measurements). B, D, and F, intracellular proline concentration in cells grown for 3 days with (+Tet) or without tetracycline (−Tet), (mean ± SD, n = 3, technical repeats, similar results were obtained in an independent biological repeat, dots show individual measurements). Statistical significance was determined using paired, two-tailed t-test (∗p ≤ 0.05; ∗∗p ≤ 0.01; n.s. not significant). Media were prepared as summarized in Table 1 and Table S1 and supplemented with 10% FBS.
Figure 8
Figure 8
RNA interference against AAT7-B in BSF T. brucei.A, growth curve of RNAi cells in HMI-11(▪) or CMM+S (○), with (+T, dashed line) or without tetracycline (−T, solid line) (mean ± SD, n = 3). Insert shows qRT-PCR analysis of AAT7-B RNAi in HMI-11 and CMM+S, RNA was extracted 2 days after start of RNAi induction. Bars show downregulation in cells grown in the respective medium relative to noninduced cells. TERT was used as reference gene (mean ± SD, n = 3, dots show individual measurements). B, intracellular proline concentrations after 2 days of growth in HMI-11 or CMM+S, with (light gray column) or without tetracycline (dark gray column) (mean±SD, n = 3, dots show individual points). Statistical significance was determined using paired, two-tailed t-test (∗p ≤ 0.05; ∗∗p ≤ 0.01; n.s. not significant).

Similar articles

Cited by

References

    1. Simpson A.G.B., Stevens J.R., Lukes J. The evolution and diversity of kinetoplastid flagellates. Trends Parasitol. 2006;22:168–174. - PubMed
    1. Jackson A.P., Otto T.D., Aslett M., Armstrong S.D., Bringaud F., Schlacht A., Hartley C., Sanders M., Wastling J.M., Dacks J.B., Acosta-Serrano A., Field M.C., Ginger M.L., Berriman M. Kinetoplastid phylogenomics reveals the evolutionary innovations associated with the origins of parasitism. Curr. Biol. 2016;26:161–172. - PMC - PubMed
    1. Chaudhary K., Roos D.S. Protozoan genomics for drug discovery. Nat. Biotechnol. 2005;23:1089–1091. - PMC - PubMed
    1. Jackson A.P. Genome evolution in trypanosomatid parasites. Parasitology. 2015;142 Suppl:S40–56. - PMC - PubMed
    1. Smith T.K., Bringaud F., Nolan D.P., Figueiredo L.M. Metabolic reprogramming during the Trypanosoma brucei life cycle. F1000Research. 2017;6:1–12. - PMC - PubMed

Publication types

MeSH terms