Gut Microbiome Alterations and Functional Prediction in Chronic Spontaneous Urticaria Patients
- PMID: 33746191
- PMCID: PMC9723274
- DOI: 10.4014/jmb.2012.12022
Gut Microbiome Alterations and Functional Prediction in Chronic Spontaneous Urticaria Patients
Abstract
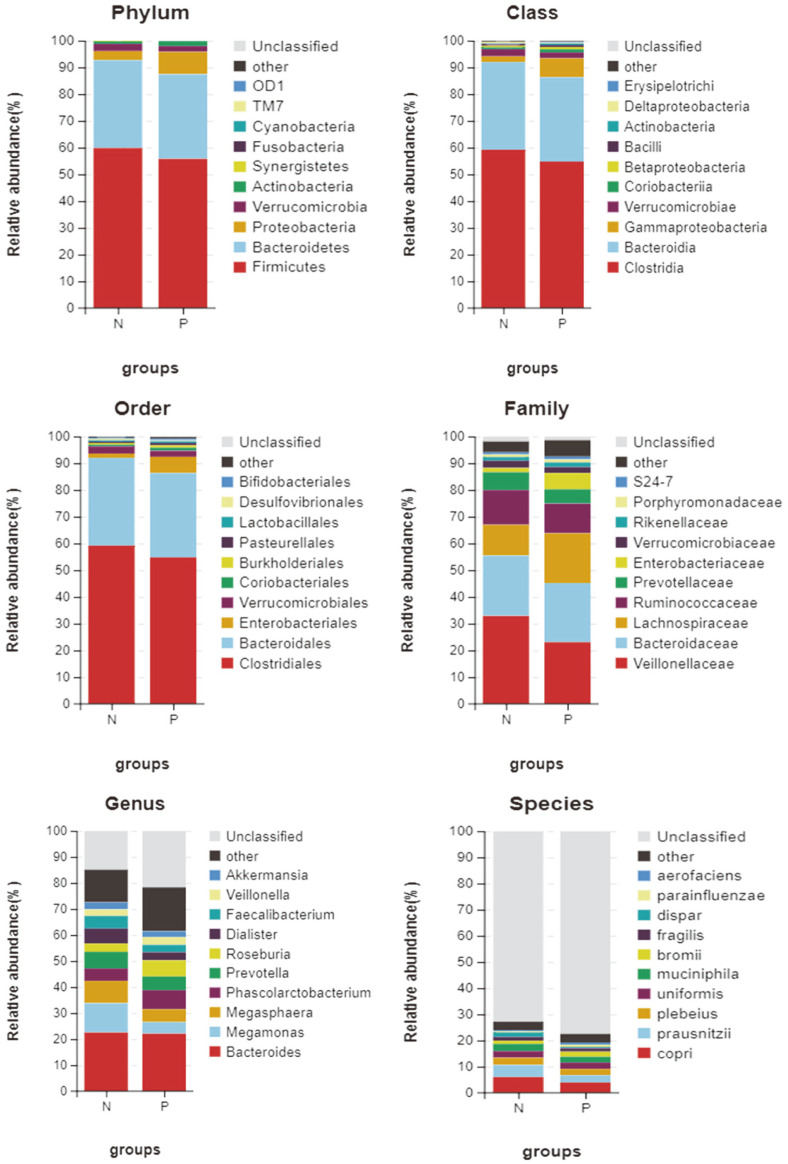
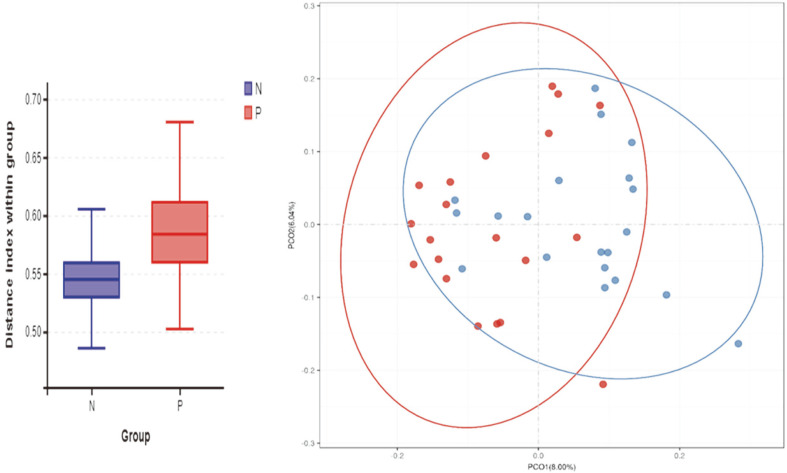
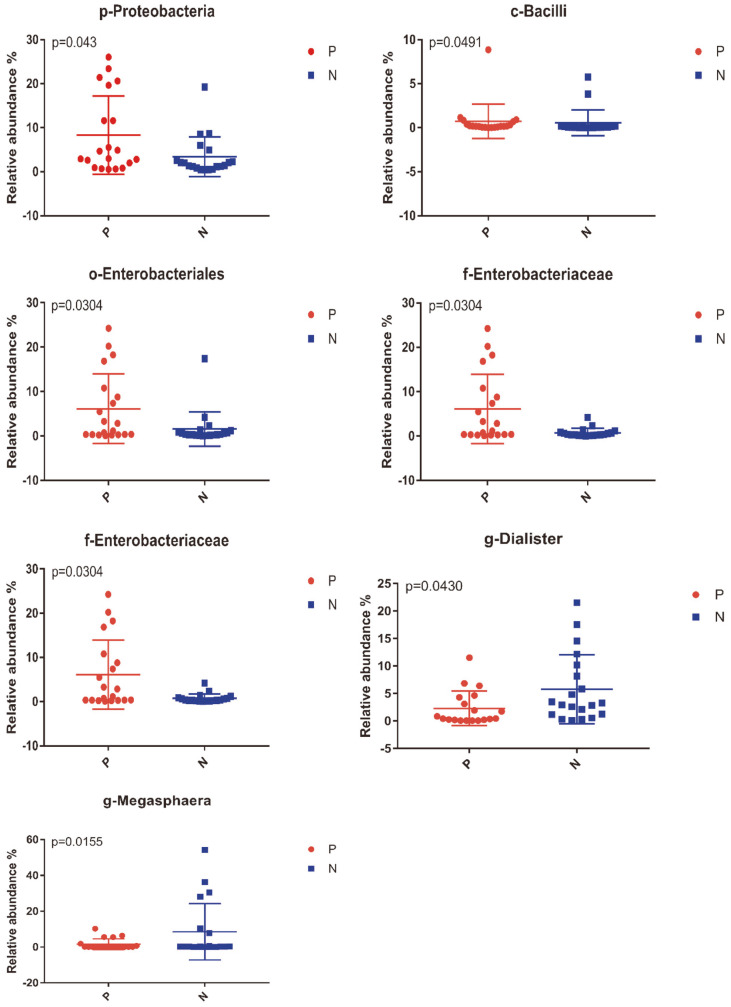
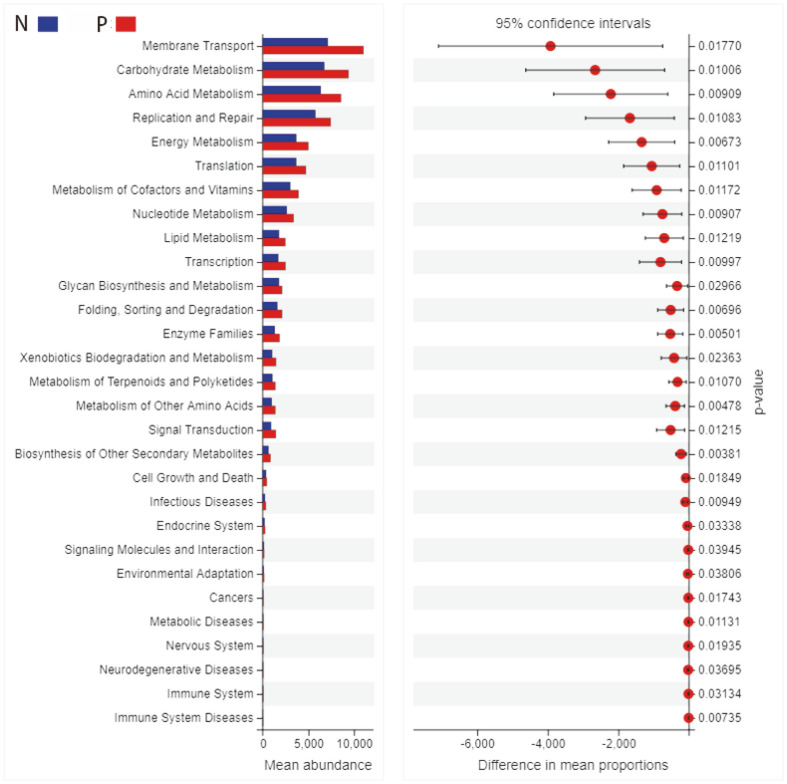
The effects of the gut microbiome on both allergy and autoimmunity in dermatological diseases have been indicated in several recent studies. Chronic spontaneous urticaria (CSU) is a disease involving allergy and autoimmunity, and there is no report detailing the role of microbiota alterations in its development. This study was performed to identify the fecal microbial composition of CSU patients and investigate the different compositions and potential genetic functions on the fecal microbiota between CSU patients and normal controls. The gut microbiota of CSU patients and healthy individuals were obtained by 16s rRNA massive sequencing. Gut microbiota diversity and composition were compared, and bioinformatics analysis of the differences was performed. The gut microbiota composition results showed that Firmicutes, Bacteroidetes, Proteobacteria, and Verrucomicrobia were dominant microbiota in CSU patients. The differential analysis showed that relative abundance of the Proteobacteria (p = 0.03), Bacilli (p = 0.04), Enterobacterales (p = 0.03), Enterobacteriaceae (p = 0.03) was significantly increased in CSU patients. In contrast, the relative abundance of Megamonas, Megasphaera, and Dialister (all p < 0.05) in these patients significantly decreased compared with healthy controls. The different microbiological compositions impacted normal gastrointestinal functions based on function prediction, resulting in abnormal pathways, including transport and metabolism. We found CSU patients exhibited gut microbiota dysbiosis compared with healthy controls. Our results indicated CSU is associated with gut microbiota dysbiosis and pointed out that the bacterial taxa increased in CSU patients, which might be involved in the pathogenesis of CSU. These results provided clues for future microbial-based therapies on CSU.
Keywords: Gut microbiome; bacterial diversity; dysbiosis; urticaria.
Conflict of interest statement
The authors have no financial conflicts of interest to declare.
Figures
Similar articles
-
Gut Microbiome Composition in Patients with Chronic Urticaria: A Review of Current Evidence and Data.Life (Basel). 2023 Jan 4;13(1):152. doi: 10.3390/life13010152. Life (Basel). 2023. PMID: 36676101 Free PMC article. Review.
-
Abnormalities in Gut Microbiota and Metabolism in Patients With Chronic Spontaneous Urticaria.Front Immunol. 2021 Oct 15;12:691304. doi: 10.3389/fimmu.2021.691304. eCollection 2021. Front Immunol. 2021. PMID: 34721374 Free PMC article.
-
Combined microbiome and metabolome analysis of gut microbiota and metabolite interactions in chronic spontaneous urticaria.Front Cell Infect Microbiol. 2023 Jan 11;12:1094737. doi: 10.3389/fcimb.2022.1094737. eCollection 2022. Front Cell Infect Microbiol. 2023. PMID: 36710970 Free PMC article.
-
Gut Microbiome and Serum Metabolome Analyses Identify Unsaturated Fatty Acids and Butanoate Metabolism Induced by Gut Microbiota in Patients With Chronic Spontaneous Urticaria.Front Cell Infect Microbiol. 2020 Feb 21;10:24. doi: 10.3389/fcimb.2020.00024. eCollection 2020. Front Cell Infect Microbiol. 2020. PMID: 32154184 Free PMC article.
-
Gut microbiota alterations in colorectal adenoma-carcinoma sequence based on 16S rRNA gene sequencing: A systematic review and meta-analysis.Microb Pathog. 2024 Oct;195:106889. doi: 10.1016/j.micpath.2024.106889. Epub 2024 Aug 26. Microb Pathog. 2024. PMID: 39197689
Cited by
-
Current insights on gut microbiome and chronic urticaria: progress in the pathogenesis and opportunities for novel therapeutic approaches.Gut Microbes. 2024 Jan-Dec;16(1):2382774. doi: 10.1080/19490976.2024.2382774. Epub 2024 Jul 30. Gut Microbes. 2024. PMID: 39078229 Free PMC article. Review.
-
Changes of Gut Microbiome in Adolescent Patients with Chronic Spontaneous Urticaria After Omalizumab Treatment.Clin Cosmet Investig Dermatol. 2023 Feb 4;16:345-357. doi: 10.2147/CCID.S393406. eCollection 2023. Clin Cosmet Investig Dermatol. 2023. PMID: 36762258 Free PMC article.
-
Salivary Microbiota Is Significantly Less Diverse in Patients with Chronic Spontaneous Urticaria Compared to Healthy Controls: Preliminary Results.Life (Basel). 2021 Dec 1;11(12):1329. doi: 10.3390/life11121329. Life (Basel). 2021. PMID: 34947860 Free PMC article.
-
Gut Microbiome Composition in Patients with Chronic Urticaria: A Review of Current Evidence and Data.Life (Basel). 2023 Jan 4;13(1):152. doi: 10.3390/life13010152. Life (Basel). 2023. PMID: 36676101 Free PMC article. Review.
-
Causal relationship between gut microbiota and urticaria: a bidirectional two-sample mendelian randomization study.Front Microbiol. 2023 Jun 22;14:1189484. doi: 10.3389/fmicb.2023.1189484. eCollection 2023. Front Microbiol. 2023. PMID: 37426010 Free PMC article.
References
-
- The definition, diagnostic testing, and management of chronic inducible urticarias - The EAACI/GA2LEN/EDF/ UNEV consensus recommendations 2016 update and revision - PubMed
MeSH terms
Substances
LinkOut - more resources
Full Text Sources
Other Literature Sources