. 2022 Jan:127:103311.
doi: 10.1016/j.jue.2020.103311. Epub 2020 Dec 4.

JUE Insight: College student travel contributed to local COVID-19 spread

Affiliations

JUE Insight: College student travel contributed to local COVID-19 spread

Daniel Mangrum et al. J Urban Econ. 2022 Jan.

Abstract

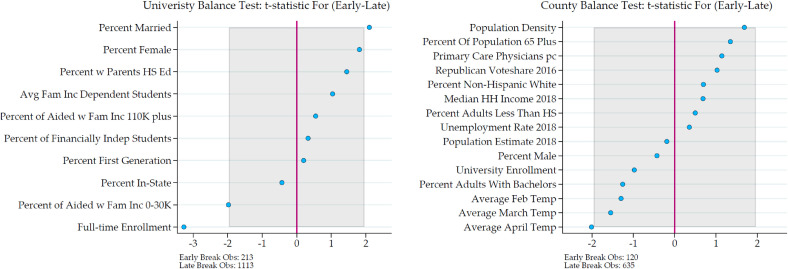
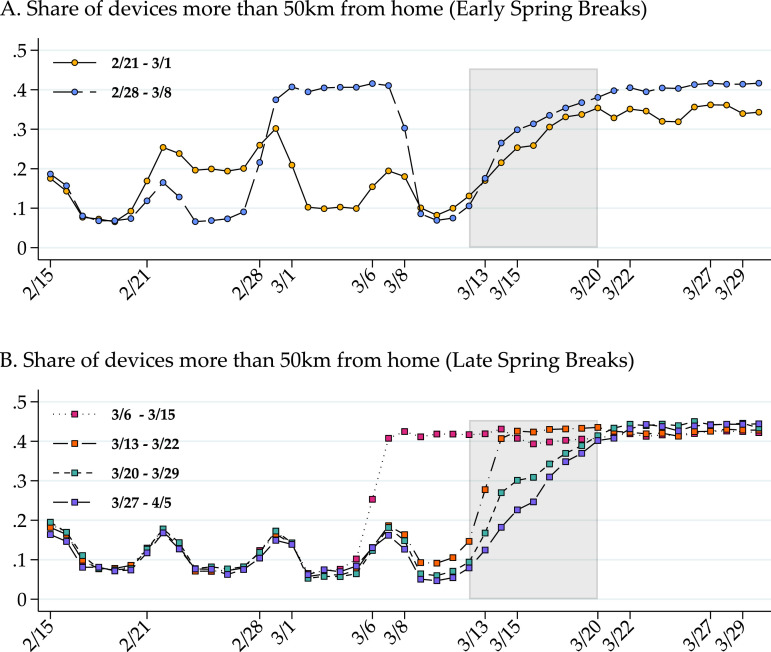
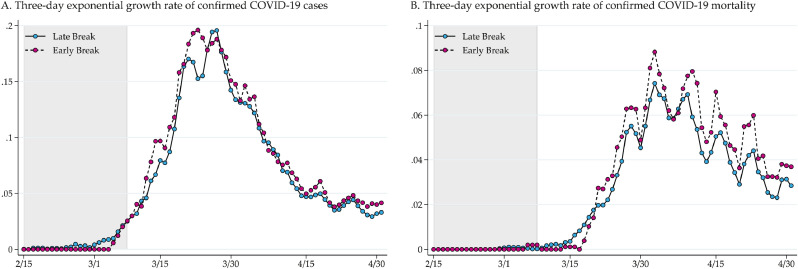
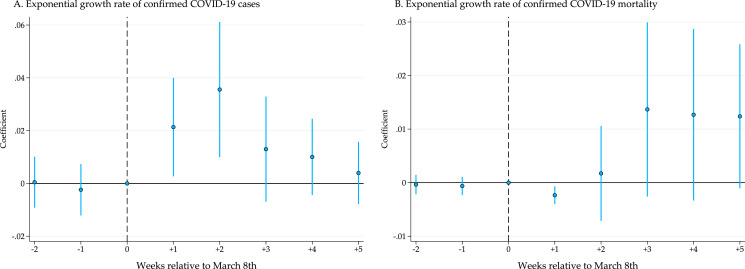
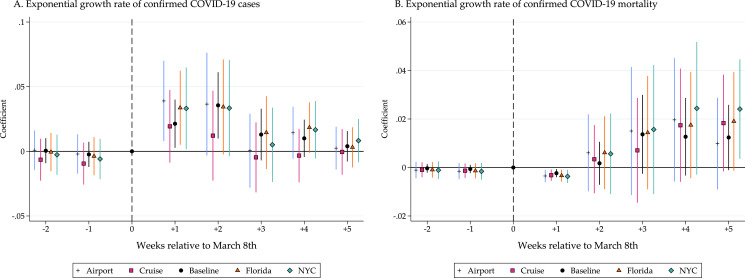
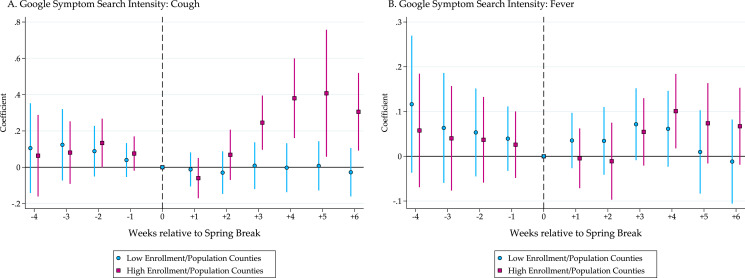
Due to the suspension of in-person classes in response to the COVID-19 pandemic, students at universities with earlier spring breaks traveled and returned to campus while those with later spring breaks largely did not. We use variation in academic calendars to study how travel affected the evolution of COVID-19 cases and mortality. Estimates imply that counties with more early spring break students had a higher growth rate of cases than counties with fewer early spring break students. The increase in case growth rates peaked two weeks after spring break. Effects are larger for universities with students more likely to travel through airports, to New York City, and to popular Florida destinations. Consistent with secondary spread to more vulnerable populations, we find a delayed increase in mortality growth rates. Lastly, we present evidence that viral infection transmission due to college student travel also occurred prior to the COVID-19 pandemic.

Keywords: COVID-19; Externalities; Higher education; Mobility; Spillovers.


Figures

Fig. 1
Fig. 1
Difference in Means Test Statistics by Early and Late Spring Break for Universities and Counties. Notes: The figures above plot the test statistics from tests for a difference in means between early and late spring break universities (left) and counties (right). A full table of means, standard deviations, mean differences and test statistics can be found in Table A.1. Universities are assigned as early spring break if the university spring break ended prior to March 9th (213 out of 1326 universities). Counties are assigned as early spring break if at least 25% of the college student enrollment in the county had a spring break ending prior to March 9th (120 our of 755 counties). The shaded region represents the critical value for the 95% confidence interval. All data for universities come from IPEDS or the College Scorecard. Data for counties come from Killeen et al. (2020), MIT Election Lab, and NOAA.
Fig. 2
Fig. 2
Effect of University Spring Break Timing on Student Travel. Notes: Each panel plots the share of devices more than 50km from home by early versus late spring break status. Home is the university CBG and is defined as the primary location of the device at night over a six week period. The shaded regions denote the dates in which most universities suspended in-person classes. Device data are from SafeGraph.
Fig. 3
Fig. 3
Evolution of COVID-19 Case and Mortality Growth Rates for Early Versus Late Spring Break Counties. Notes: Each panel above plots the average three-day exponential growth rate of either confirmed COVID-19 cases or mortality separately for early versus late spring break counties. Early spring break counties are defined as counties with more than 25% of the college student population having a spring break which ends before March 9th (120 counties). Late spring break counties are counties with fewer than 25% of the county college student population with early spring breaks (635 counties). The shaded region denotes the early spring break period ending on March 8th. Outcome data come from the New York Times. We also replicate this plot for the level of both confirmed cases and mortality in Figure A.3 to show how the two groups diverge over time.
Fig. 4
Fig. 4
Event Study Estimates for the Impact of Spring Break Travel on COVID-19 Cases and Mortality. Notes: Each marker plots a coefficient estimate of γj from the event study specification defined by Eq. (1). Vertical bars represent the 95% confidence intervals derived using standard errors clustered at the county level. Each outcome observation is a county’s weekly exponential growth rate. Outcome data come from the New York Times.
Fig. 5
Fig. 5
Event Study Estimates: Heterogeneous Impact by Mode and Destination of Travel. Notes: Each marker plots a coefficient estimate of γj from the event study specification where the marker in the legend denotes the heterogeneity subsample used for treatment counties. Vertical bars represent the 95% confidence intervals derived using standard errors clustered at the county level. Each outcome observation is a county’s weekly exponential growth rate. Outcome data come from the New York Times.
Fig. 6
Fig. 6
Event Study Estimates for the Impact of Spring Break Travel on Google Symptom Search Intensity Prior to COVID-19 Notes: Each marker plots a coefficient estimate from the event study specification described in Eq. (2). Each outcome is a Google search intensity measure for either cough or fever at the county-day level. The sample includes counties with a single university in our sample plus all adjacent counties with no universities. Blue circles denote coefficient estimates from the specification in which all adjacent non-university counties are included along with single university counties with below median college student enrollment relative to the county population. Pink squares denote coefficient estimates from the specification in which all adjacent non-university counties are included along with single university counties with above median college student enrollment relative to the county population. Vertical bars represent the 95% confidence intervals derived using standard errors clustered at the county level.

Similar articles

Cited by

References

    1. Abel J.R., Deitz R. Do colleges and universities increase their region’s human capital? J. Econ. Geog. 2012;12(3):667–691.
    1. Abouk R., Heydari B. The immediate effect of Covid-19 policies on social distancing behavior in the United States. Available at SSRN. 2020 - PMC - PubMed
    1. Adda J. Economic activity and the spread of viral diseases: evidence from high frequency data. Q. J. Econ. 2016;131(2):891–941.
    1. Ahammer A., Halla M., Lackner M., et al. Technical Report. 2020. Mass Gatherings Contributed to Early COVID-19 Mortality: Evidence from US Sports.
    1. Alfaro L., Faia E., Lamersdorf N., Saidi F. Working Paper. 2020. Social Interactions in Pandemics: Fear, Altruism, and Reciprocity. - DOI

LinkOut - more resources