. 2021 Jun:196:107788.
doi: 10.1016/j.buildenv.2021.107788. Epub 2021 Mar 13.

Probable airborne transmission of SARS-CoV-2 in a poorly ventilated restaurant

Affiliations

Probable airborne transmission of SARS-CoV-2 in a poorly ventilated restaurant

Yuguo Li et al. Build Environ. 2021 Jun.

Abstract

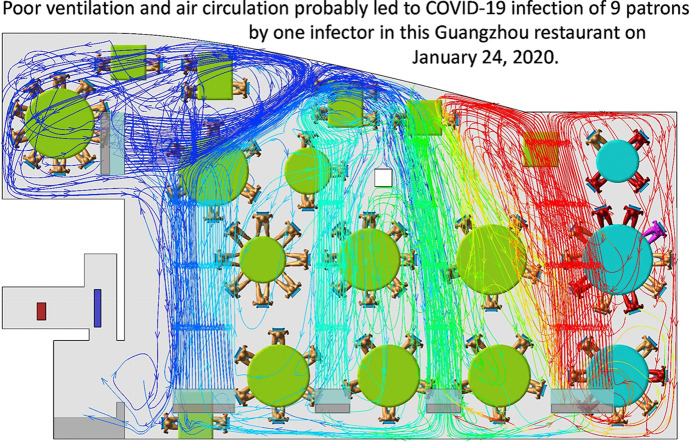
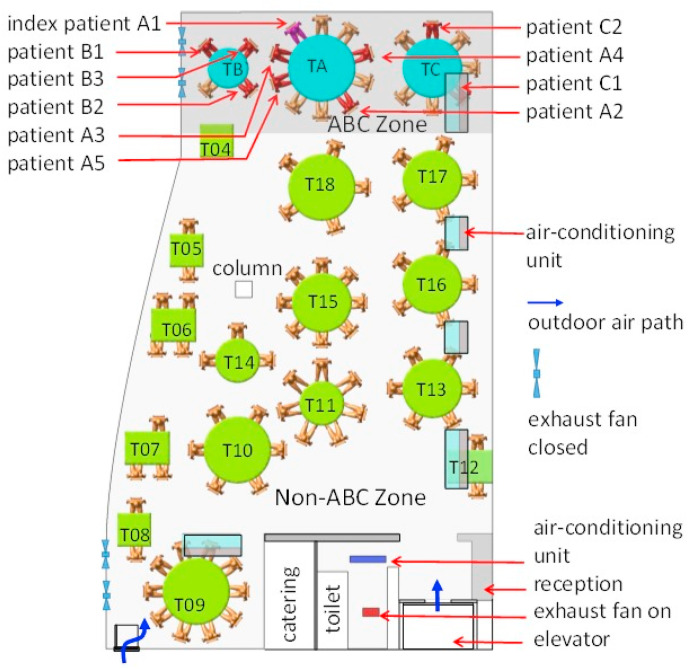
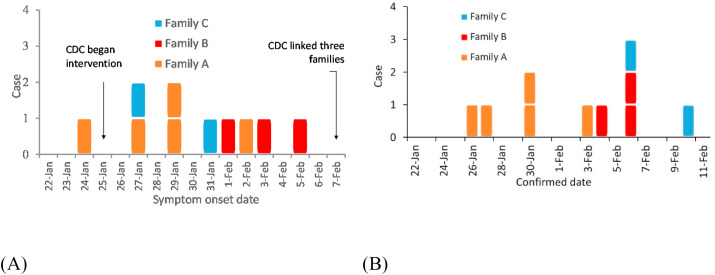
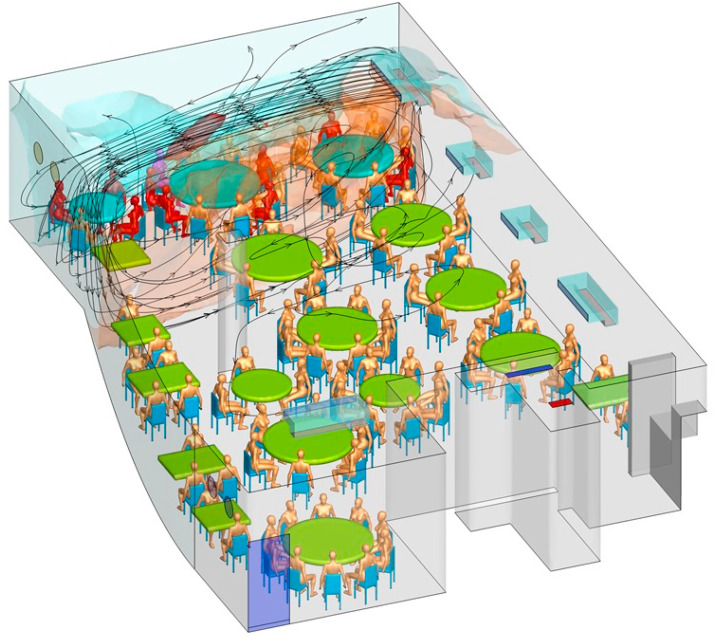
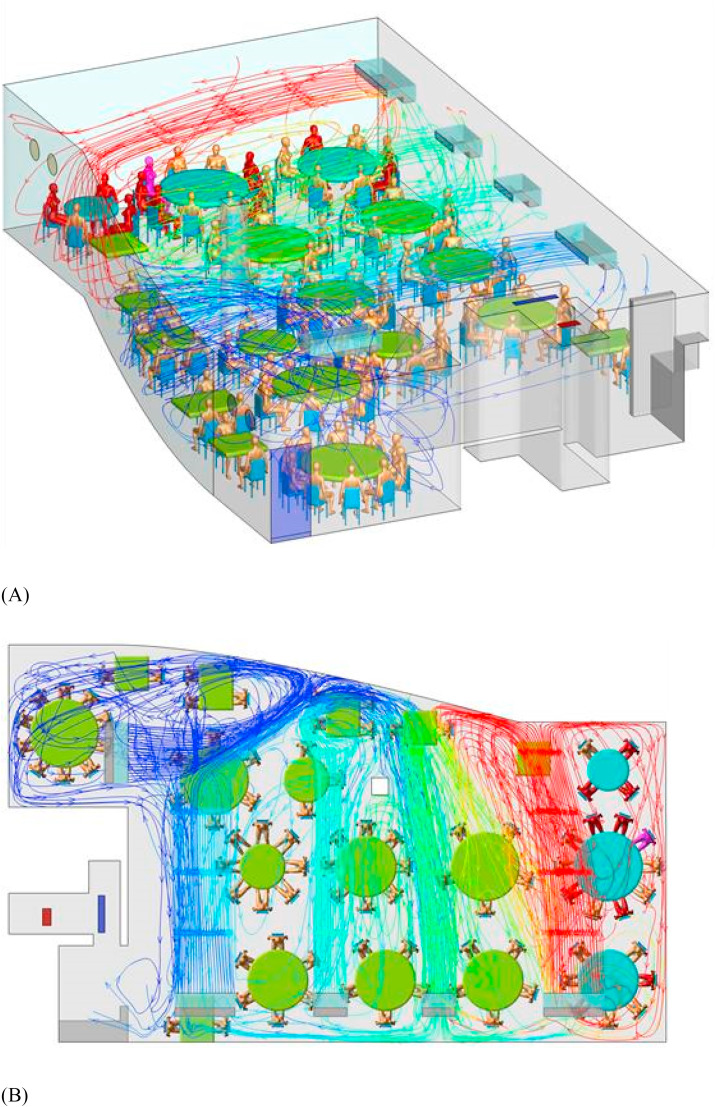
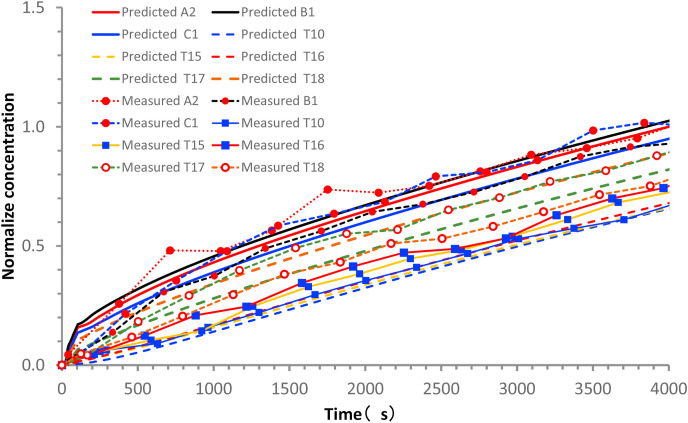
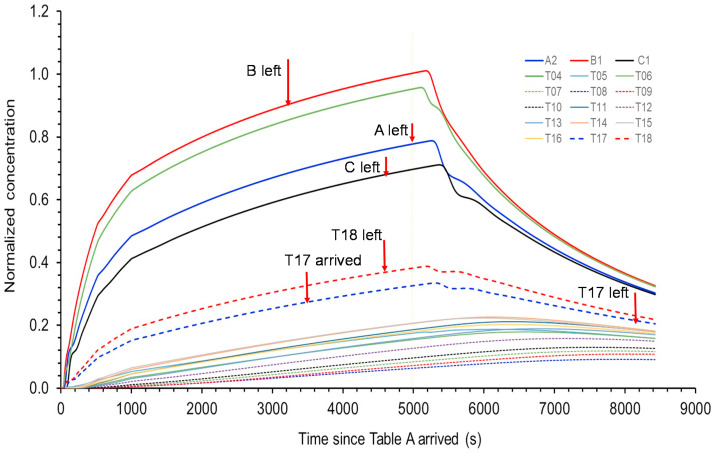
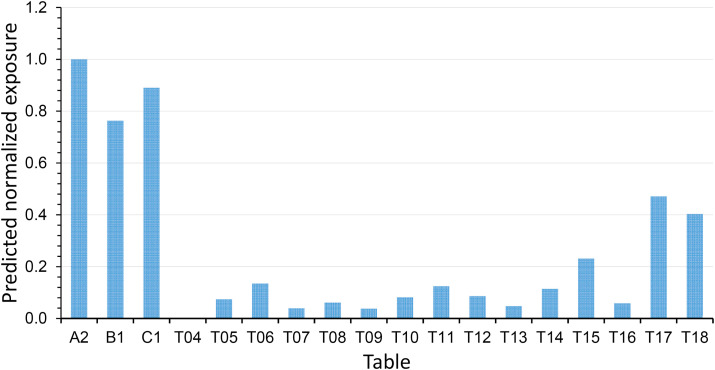
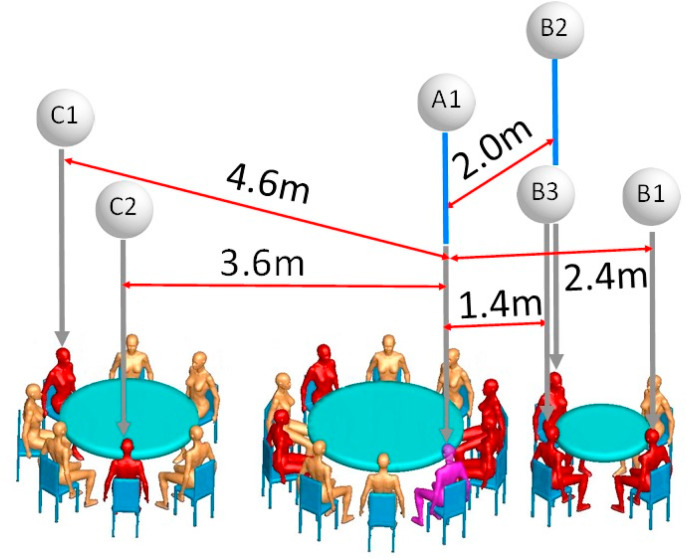
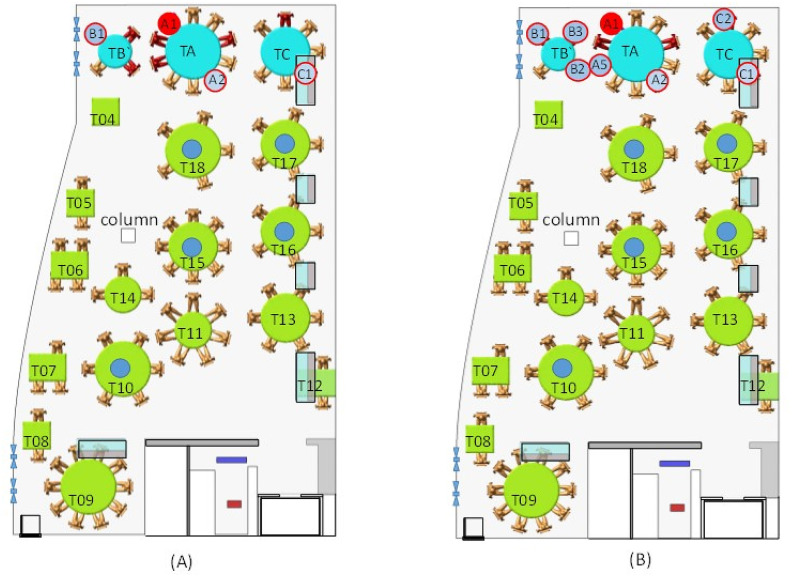
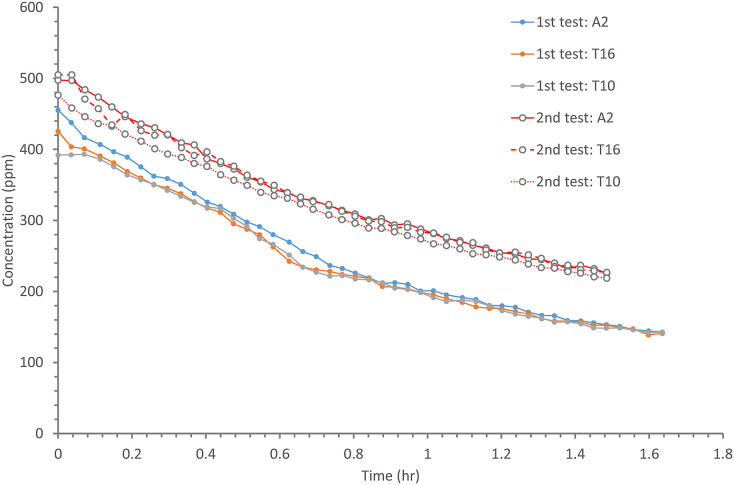
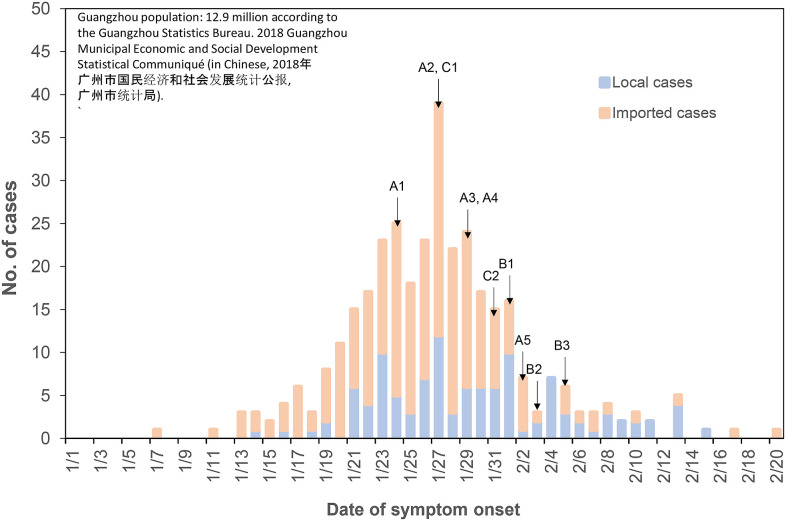
Although airborne transmission of severe acute respiratory syndrome coronavirus 2 (SARS-CoV-2) has been recognized, the condition of ventilation for its occurrence is still being debated. We analyzed a coronavirus disease 2019 (COVID-19) outbreak involving three families in a restaurant in Guangzhou, China, assessed the possibility of airborne transmission, and characterized the associated environmental conditions. We collected epidemiological data, obtained a full video recording and seating records from the restaurant, and measured the dispersion of a warm tracer gas as a surrogate for exhaled droplets from the index case. Computer simulations were performed to simulate the spread of fine exhaled droplets. We compared the in-room location of subsequently infected cases and spread of the simulated virus-laden aerosol tracer. The ventilation rate was measured using the tracer gas concentration decay method. This outbreak involved ten infected persons in three families (A, B, C). All ten persons ate lunch at three neighboring tables at the same restaurant on January 24, 2020. None of the restaurant staff or the 68 patrons at the other 15 tables became infected. During this occasion, the measured ventilation rate was 0.9 L/s per person. No close contact or fomite contact was identified, aside from back-to-back sitting in some cases. Analysis of the airflow dynamics indicates that the infection distribution is consistent with a spread pattern representative of long-range transmission of exhaled virus-laden aerosols. Airborne transmission of the SARS-CoV-2 virus is possible in crowded space with a ventilation rate of 1 L/s per person.

Keywords: Aerosol transmission; Airborne transmission; Building ventilation; COVID-19; SARS-CoV-2.


Conflict of interest statement

The authors declare that they have no known competing financial interests or personal relationships that could have appeared to influence the work reported in this paper.

Figures

Image 1
Graphical abstract
Fig. 1
Fig. 1
(Color Online) Distribution of SARS-CoV-2 infection cases at tables in Restaurant X. The probable air-flow zones are shown in dark grey and light grey. Eighty-nine patrons are shown at the 18 tables, with one table being empty (T04). Tables TA, TB, and TC are where families A, B, and C sat, some of whose members became infected. Patient A1 at TA is the suspected index case, who had symptoms shortly after returning to the hotel where Family A was staying. Patients A2–A5, B1–B3, and C1–C2 are the individuals who became infected. Other tables are numbered as T04–T18. Each of the five air-conditioning units (fan coil units) condition a particular zone. Patrons and waiters entered the restaurant floor via the elevator and stairwell, which are connected by the fire door. (For interpretation of the references to color in this figure legend, the reader is referred to the Web version of this article.)
Fig. 2
Fig. 2
(Color Online) Dates of (A) symptom onset and (B) confirmation of the 10 patients from the three families. Patients from family A, B, C are represented by yellow, red and blue squares respectively. (For interpretation of the references to color in this figure legend, the reader is referred to the Web version of this article.)
Fig. 3
Fig. 3
(Color Online) Simulated dispersion of fine droplets exhaled from index case A1 (purple), which are initially confined within the cloud envelope (ABC bubble) due to the zoned air-conditioning arrangement. The fine droplets disperse into the other zone via air exchange and are eventually removed via the restroom exhaust fan. The streamlines originated from the ABC air conditioning unit are plotted to show the formation of the ABC bubble. The ABC zone clearly has a higher concentration of fine droplets than the non-ABC zone. Other infected patients are shown in red and non-infected patrons in gold. (For interpretation of the references to color in this figure legend, the reader is referred to the Web version of this article.)
Fig. 4
Fig. 4
(Color Online) Simulated air streamlines originating from the air conditioning units in the restaurant using computational fluid dynamics. The index case A1 is shown in purple, other infected patients in red, and non-infected in gold. The streamlines are colored by the concentration of predicted infectious droplet nuclei, with red the highest and blue the lowest. (A) 3D view and (B) top view. (For interpretation of the references to color in this figure legend, the reader is referred to the Web version of this article.)
Fig. 5
Fig. 5
(Color Online) Comparison between measured and predicted concentrations at monitoring points during exhaled tracer spread test, normalized by the A2 value at 4000 s. (For interpretation of the references to color in this figure legend, the reader is referred to the Web version of this article.)
Fig. 6
Fig. 6
(Color Online) Predicted concentrations normalized to B1 at 4920 s for some patrons at tables A, B, and C, and other tables after table A patrons arrived at time zero (12:01 p.m.). Table A patrons left the restaurant at time 4920 s (1:22 p.m.). Due to the nature of the air flows, the concentrations for some patrons continued to rise after 4920 s. The results are used to calculate the exposure using the exposure duration data in Table 3. The prediction concentration profiles clearly show a separated ABC zone (i.e., bubble, including T04, which had no patrons), a T17/T18 zone, a zone with T11 and T13–16, and a zone with T07–T10 and T12 close to the outdoor air supply. (For interpretation of the references to color in this figure legend, the reader is referred to the Web version of this article.)
Fig. 7
Fig. 7
(Color Online) Predicted exposure of the infectious-virus-containing droplet nuclei normalized to A1 during the entire lunch period at all tables. As no patron was present at Table T04, no exposure can be calculated. (For interpretation of the references to color in this figure legend, the reader is referred to the Web version of this article.)
Fig. 8
Fig. 8
(Color Online) Distances between index case A1 (purple) and the five infected individuals of families B and C (red). (For interpretation of the references to color in this figure legend, the reader is referred to the Web version of this article.)
Fig. C.1
Fig. C.1
(Color Online) Location of tracer gas (ethane) concentration sensors on the floor plan during the (A) afternoon test and (B) morning test with a leak. The red seat indicates the position of index case A1. Small red-outlined circles indicate the seating location of the infected patrons. Small blue circles indicate the location of the tracer gas sensors. The tables are numbered TA, TB, and TC for families A, B, and C, respectively, and T04–T18 for the other tables. The morning test with a leak was unintended; the tracer gas leaked due to a damaged pipe below TA. Nevertheless, the measured data from test (B) also support the observed distribution in test (A).
Fig. C.2
Fig. C.2
(Color Online) Measured tracer gas concentration profile from the two tracer gas decay tests for ventilation rate measurement. The concentrations were monitored at three locations during each test: seat A2, Table 10 (T10), and Table 16 (T16). For each test, the three curves are reasonably close, suggesting the room air flow was reasonably fully mixed by using the mixing fans during the test.
Fig. D.1
Fig. D.1
(Color Online) The epidemiological curve in Guangzhou (population 12.9 million), where restaurant X is located and where families B and C live. The symptom onset dates of all infected members of families A, B, and C are also shown. By January 24, when A1 had the first symptoms, there were 72 symptomatic cases (15 local and 59 imported); by January 27, when C1 had the first symptoms, there were 202 symptomatic cases (52 local and 150 imported); and by Feb 1, when B1 had the first symptoms, there were 296 symptomatic cases (83 local and 213 imported). With close contact tracing, families B and C did not have contact with any of the identified cases and/or any visitors from Hubei Province 14 days prior to the onset of their symptoms.

References

    1. Morawska L., Cao J. Airborne transmission of SARS-CoV-2: the world should face the reality. Environ. Int. 2020;139:105730. - PMC - PubMed
    1. USA Centers for Disease Control and Prevention CDC . U.S. Department of Health & Human Services; Washington DC, USA: 2020. How 2019-nCoV Spreads.https://www.cdc.gov/coronavirus/2019-ncov/about/transmission.html
    1. World Health Organization Coronavirus disease (COVID-19): how is it transmitted? https://www.who.int/news-room/q-a-detail/coronavirus-disease-covid-19-ho... (Accessed on 15 November 2020)
    1. Riley E.C., Murphy G., Riley R.L. Airborne spread of measles in a suburban elementary school. Am. J. Epidemiol. 1978;107(5):421–432. - PubMed
    1. American Society of Heating . vol. 62. ASHRAE Standard; Atlanta, USA: 2019. (Refrigerating and Air-Conditioning Engineers (ASHRAE) Ventilation for Acceptable Indoor Air Quality). 1.