

A Ceramic PZT-based PMUT Array for Endoscopic Photoacoustic Imaging
- PMID: 33746476
- PMCID: PMC7978059
- DOI: 10.1109/jmems.2020.3010773
A Ceramic PZT-based PMUT Array for Endoscopic Photoacoustic Imaging
Abstract
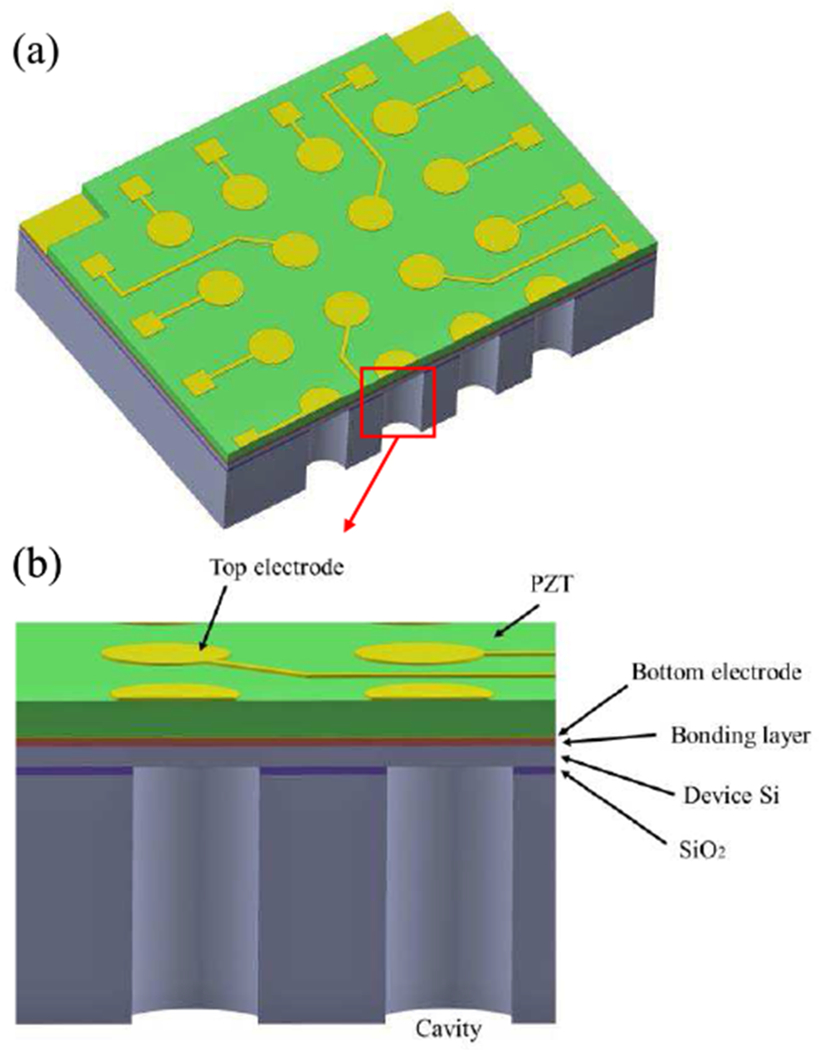
In this paper, we present the design, fabrication, and characterization of a compact 4 × 4 piezoelectric micromachined ultrasonic transducer (pMUT) array and its application to photoacoustic imaging. The uniqueness of this pMUT array is the integration of a 4 μm-thick ceramic PZT, having significantly higher piezoelectric coefficient and lower stress than sol-gel or sputtered PZT. The fabricated pMUT array has a small chip size of only 1.8 × 1.6 mm2 with each pMUT element having a diameter of 210 μm. The fabricated device was characterized with electrical impedance measurement and acoustic sensing test. Photoacoustic imaging has also been successfully demonstrated on an agar phantom with a pencil lead embedded using the fabricated pMUT array.
Keywords: Ceramic PZT; Endoscopic Imaging; Microelectromechanical Systems; PMUT Array; Photoacoustic Imaging; Piezoelectric Micromachined Ultrasonic Transducers.
Figures


References
-
- Wang X, Pang Y, Ku G, Xie X, Stoica G, and Wang L, “Noninvasive laser-induced photoacoustic tomography for structural and functional in vivo imaging of the brain,” Nat. Biotechnol, vol. 21, no. 7, pp. 803–806, 2003. - PubMed
-
- Ermilov SA et al. “Laser optoacoustic imaging system for detection of breast cancer,” J. Biomed. Opt, vol. 14, no. 2, pp. 024007, 2009. - PubMed
-
- Xi L, and Jiang H, “High resolution three-dimensional photoacoustic imaging of human finger joints in vivo,” Appl. Phys. Lett, vol. 107, pp. 063701, 2015.
-
- Ku G, Wang X, Stoica G, and Wang LV, “Multiple-bandwidth photoacoustic tomography,” Phys. Med. Biol, vol. 49, pp. 1329–1338, 2004. - PubMed
Grants and funding
LinkOut - more resources
Full Text Sources