. 2021 Feb 1;33(2):021901.
doi: 10.1063/5.0037640. Epub 2021 Feb 2.

Fluid dynamics and epidemiology: Seasonality and transmission dynamics

Affiliations

Fluid dynamics and epidemiology: Seasonality and transmission dynamics

Talib Dbouk et al. Phys Fluids (1994). .

Abstract

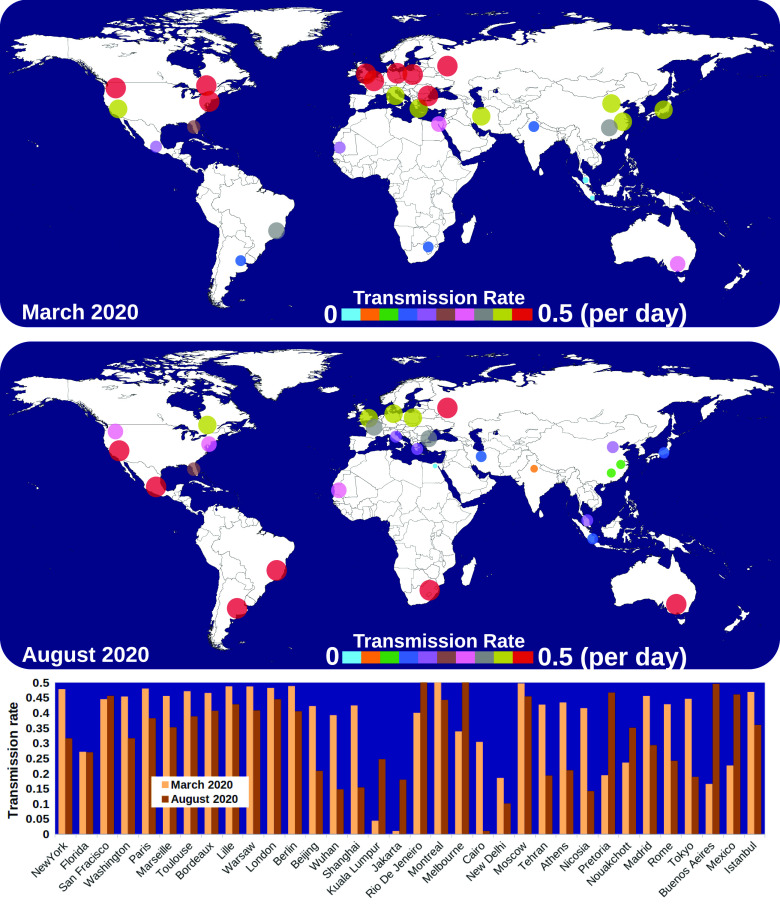
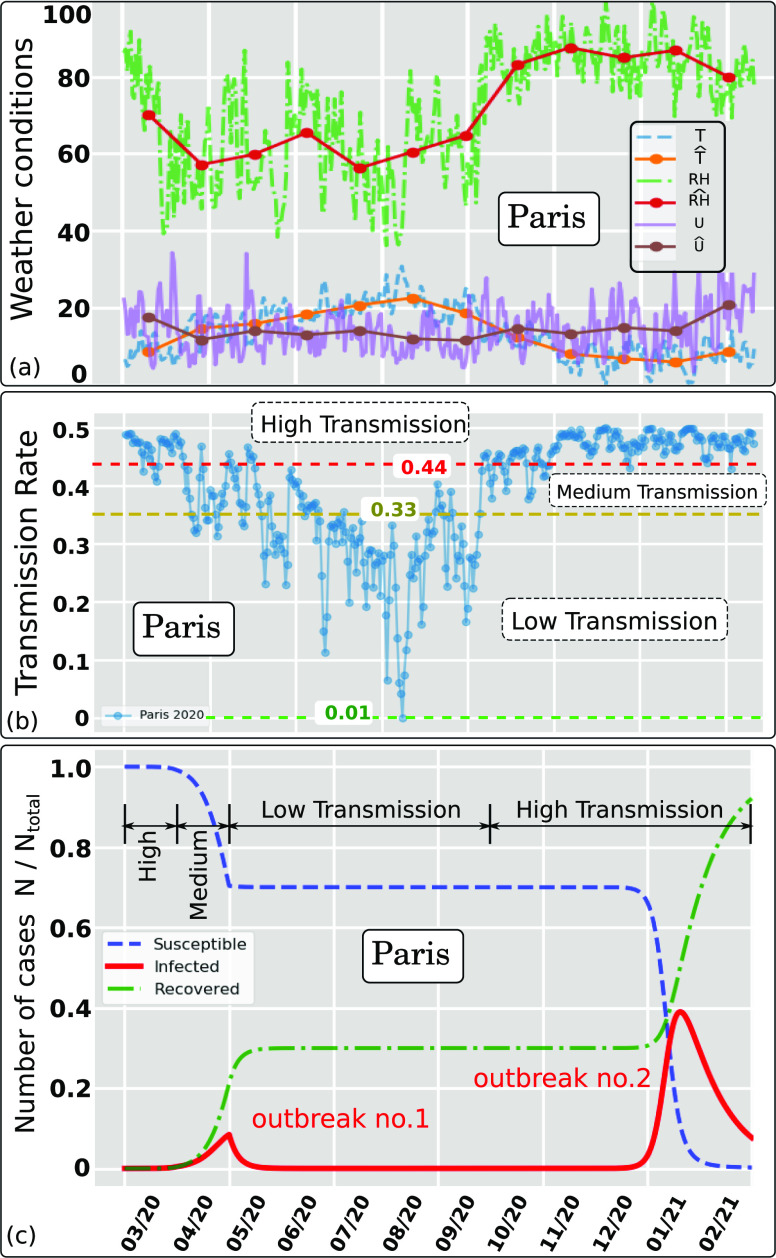
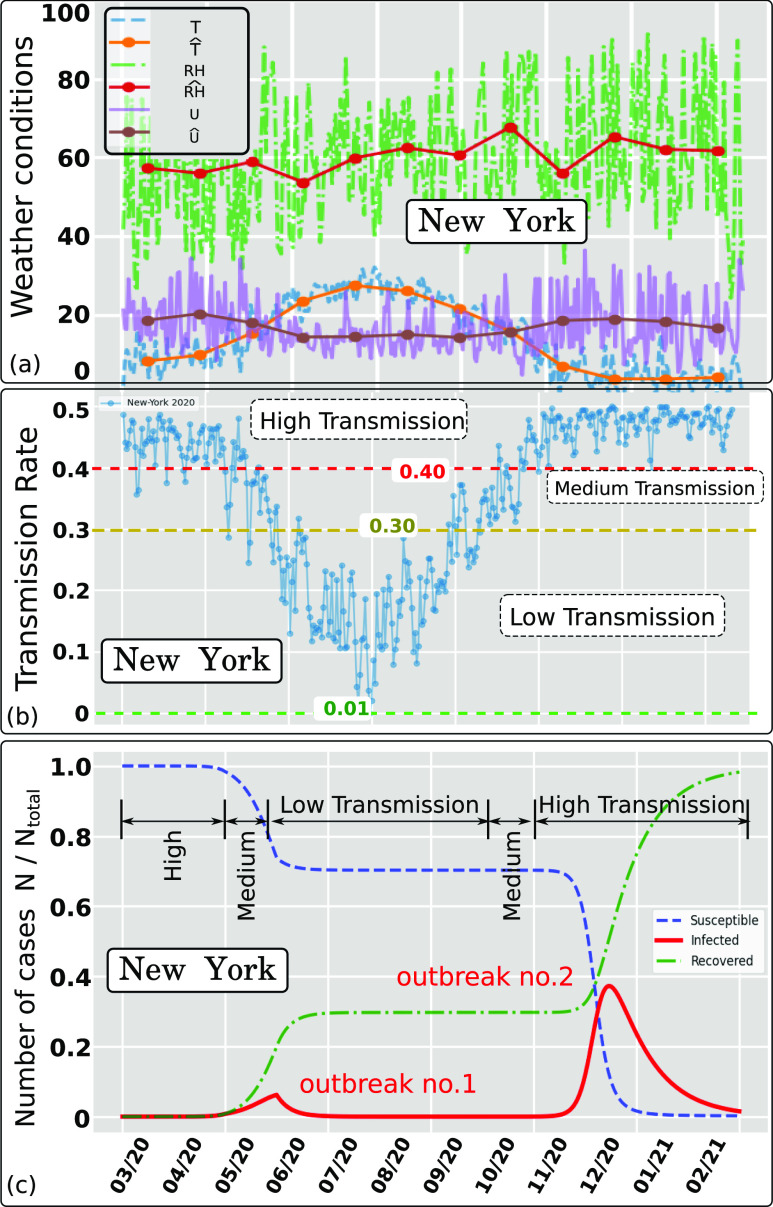
Epidemic models do not account for the effects of climate conditions on the transmission dynamics of viruses. This study presents the vital relationship between weather seasonality, airborne virus transmission, and pandemic outbreaks over a whole year. Using the data obtained from high-fidelity multi-phase, fluid dynamics simulations, we calculate the concentration rate of Coronavirus particles in contaminated saliva droplets and use it to derive a new Airborne Infection Rate (AIR) index. Combining the simplest form of an epidemiological model, the susceptible-infected-recovered, and the AIR index, we show through data evidence how weather seasonality induces two outbreaks per year, as it is observed with the COVID-19 pandemic worldwide. We present the results for the number of cases and transmission rates for three cities, New York, Paris, and Rio de Janeiro. The results suggest that two pandemic outbreaks per year are inevitable because they are directly linked to what we call weather seasonality. The pandemic outbreaks are associated with changes in temperature, relative humidity, and wind speed independently of the particular season. We propose that epidemiological models must incorporate climate effects through the AIR index.


Figures

FIG. 1.
FIG. 1.
Climate effects on airborne virus transmission. (a) An infected individual expelling contaminated saliva droplets. (b) Coronavirus (CoV) particles in saliva droplets at an initial concentration C0, showing the evaporation process. (c) The structure of a CoV particle. (d) An example of the computed C/C0 variation with time at environmental conditions of 4 km/h wind speed, T = 20 °C, and RH = 50%.
FIG. 2.
FIG. 2.
An example of the climate conditions’ effect on airborne virus transmission for the case study at 4 km/h wind speed, T = 20 °C, and RH = 50%. (a) Size distribution of contaminated saliva droplets emitted by a cough from an infected person; droplets expelled initially into the environment at a cough speed of about 8.5 km/h and own a non-uniform droplets size distribution. (b) Concentration of CoV in each expelled saliva droplet; assuming initially a uniform distribution of virus particles over the droplets population, the CoV concentration decreases in each droplet as function of time at different proportions and different rates.
FIG. 3.
FIG. 3.
The combined effect of relative humidity and air temperature on the CoV concentration in saliva. An example at 4 km/h wind speed and relative humidities (a) RH = 10%, (b) RH = 30%, (c) RH = 50%, and (d) RH = 90%. The sharp decrease in the values is not physical; it is related to the fact that the droplets’ cloud left the computational domain located at 8 m away from the mouth of an individual.
FIG. 4.
FIG. 4.
Effect of weather conditions on the CoV concentration rate (per unit time) as a function of the wind speed, temperature, and relative humidity. Wind at (a) 4 km/h, (b) 10 km/h, (c) 15 km/h, and (d) 20 km/h. The concentration C is made dimensionless by division by the initial concentration C0 at t = 0.
FIG. 5.
FIG. 5.
Scaling of the virus concentration rate (CR) with temperature (T), relative humidity (RH)). and wind speed (U). The solid square symbols represent the data points from the simulations. The lines (dashed, dotted-dashed, and solid) represent the single model predictions, which were found to fit all the data points very accurately. The two black solid lines are the maximum and minimum boundary limits for the range of data used to produce the results, (0 °C ≤ T ≤ 40 °C), (10% ≤ RH ≤ 90%), and (4 km/h ≤ U ≤ 20 km/h). The green and red circles show the strong and weak states of the virus particles, respectively. All the real variables denoted by ξ are made dimensionless by the 〈*〉 operator [see Eq. (4)]. min(CR) ≈ 0 and max(CR) ≈ 0.5.
FIG. 6.
FIG. 6.
Weather-dependent transmission rate (β) in different cities worldwide during March and August 2020. The highest transmission, related to the CoV airborne concentration rate, is found to be about 0.5 per day. The above implies that the probability is P = 1 (100%) for a susceptible individual to be infected in two days due to the weather conditions (wind speed, temperature, and relative humidity) in different regions.
FIG. 7.
FIG. 7.
Effect of weather conditions (wind speed, temperature, and relative humidity) on the Airborne Infection Rate index (AIR = β) for Paris in 2020. The hat symbol denotes daily weather data averaged per month. (a) Weather data recorded between March and October 2020 (included) and estimated weather data between November 2020 and February 2021 based on the last year’s recorded weather. (b) Weather dependent transmission rate showing three trends denoted high, medium, and low separated by the respective threshold values 0.44 and 0.33. (c) Pandemic modeling and long time prediction (daily number of cases) using the weather-dependent transmission rate [Fig. 7(b)] in the standard SIR model. Two outbreaks predicted due to the weather seasonality in Paris (i^le de France) using I = 73 as total infected individuals in Paris on 1 March 2020 (source: WHO1). Ntotal ≈ 12.279 · 106.
FIG. 8.
FIG. 8.
Effect of weather conditions (wind speed, temperature, and relative humidity) on the Airborne Infection Rate index (AIR = β) for New York state (USA) in 2020. The hat symbol denotes daily weather data averaged per month. (a) Weather data recorded between March and October 2020 (included) and estimated weather data between November 2020 and February 2021 based on the last year’s recorded weather. (b) Weather dependent transmission rate showing three trends denoted high, medium, and low separated by the respective threshold values 0.40 and 0.30. (c) Pandemic modeling and long time prediction (daily number of cases) using the weather-dependent transmission rate [Fig. 8(b)] in the standard SIR model. Two outbreaks predicted due to the weather seasonality in New York using I = 1 as approximate total infected individuals on 01 March 2020. Ntotal ≈ 19.47 · 106.
FIG. 9.
FIG. 9.
Effect of weather conditions (wind speed, temperature, and relative humidity) on the Airborne Infection Rate index (AIR = β) for Rio de Janeiro in 2020. The hat symbol denotes daily weather data averaged per month. (a) Weather data recorded between March and October 2020 (included) and estimated weather data between November 2020 and February 2021 based on the last year’s recorded weather. (b) Weather dependent transmission rate showing three trends denoted high, medium, and low separated by the respective threshold values 0.40 and 0.30. (c) Pandemic modeling and long time prediction (daily number of cases) using the weather-dependent transmission rate [Fig. 9(b)] in the standard SIR model. An outbreak predicted due to the weather seasonality in Rio de Janeiro using I = 1 as approximate total infected individuals on 1 March 2020. Ntotal ≈ 13.458 · 106.

References

    1. WHO, “Coronavirus disease (covid-19),” World Health Organization, 2020.
    1. Chinazzi M., Davis J. T., Ajelli M., Gioannini C., Litvinova M., Merler S., Pastore y Piontti A., Mu K., Rossi L., Sun K., Viboud C., Xiong X., Yu H., Halloran M. E., Longini I. M., and Vespignani A., “The effect of travel restrictions on the spread of the 2019 novel coronavirus (COVID-19) outbreak,” Science 368, 395–400 (2020).10.1126/science.aba9757 - DOI - PMC - PubMed
    1. Dehning J., Zierenberg J., Spitzner F. P., Wibral M., Neto J. P., Wilczek M., and Priesemann V., “Inferring change points in the spread of COVID-19 reveals the effectiveness of interventions,” Science 369, eabb9789 (2020).10.1126/science.abb9789 - DOI - PMC - PubMed
    1. Enserink M. and Kupferschmidt K., “With COVID-19, modeling takes on life and death importance,” Science 367, 1414–1415 (2020).10.1126/science.367.6485.1414-b - DOI - PubMed
    1. Metcalf C. J. E., Morris D. H., and Park S. W., “Mathematical models to guide pandemic response,” Science 369, 368–369 (2020).10.1126/science.abd1668 - DOI - PubMed

LinkOut - more resources