. 2021 Feb;33(2):023306.
doi: 10.1063/5.0040914. Epub 2021 Feb 22.

SARS COV-2 virus-laden droplets coughed from deep lungs: Numerical quantification in a single-path whole respiratory tract geometry

Affiliations

SARS COV-2 virus-laden droplets coughed from deep lungs: Numerical quantification in a single-path whole respiratory tract geometry

Xiuhua April Si et al. Phys Fluids (1994). 2021 Feb.

Abstract

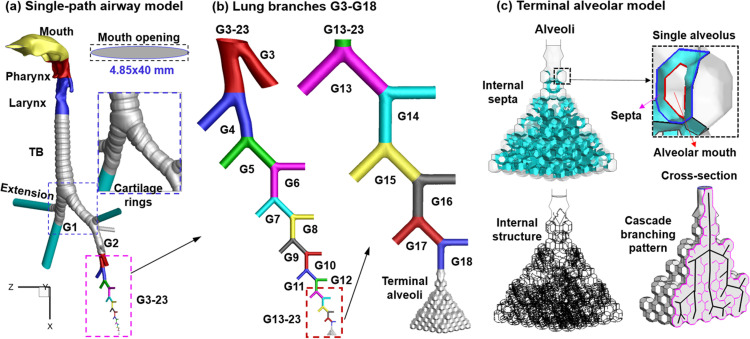
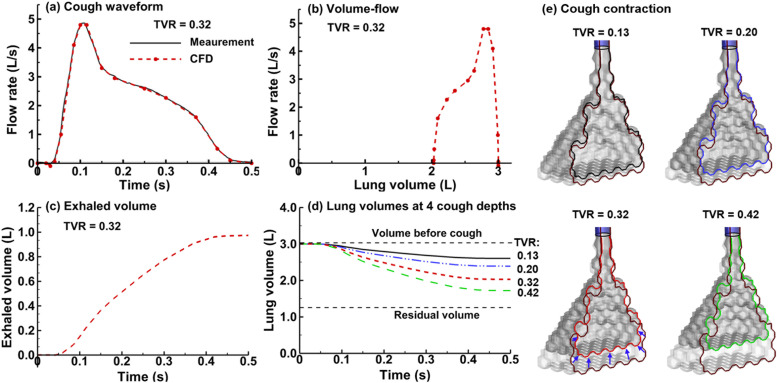
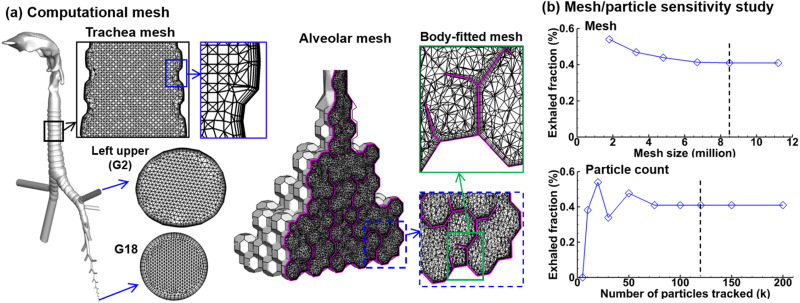
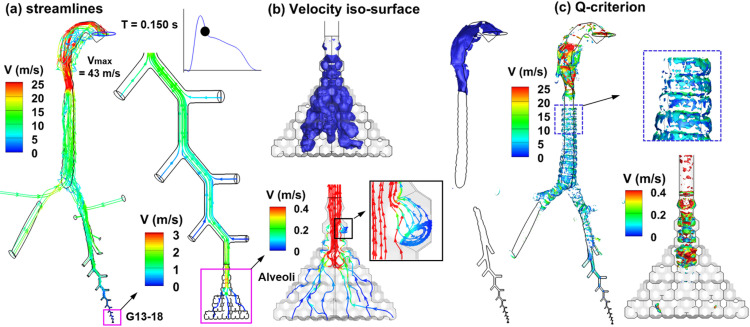
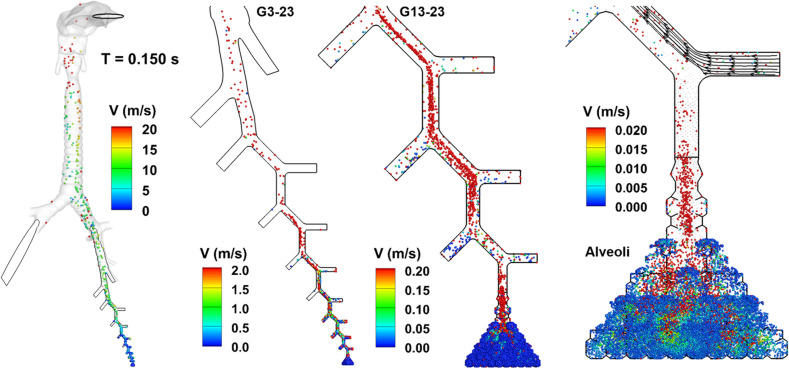
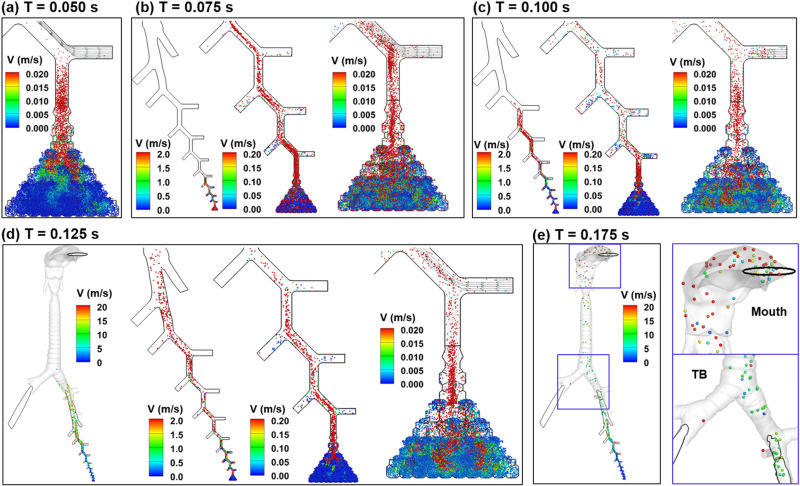
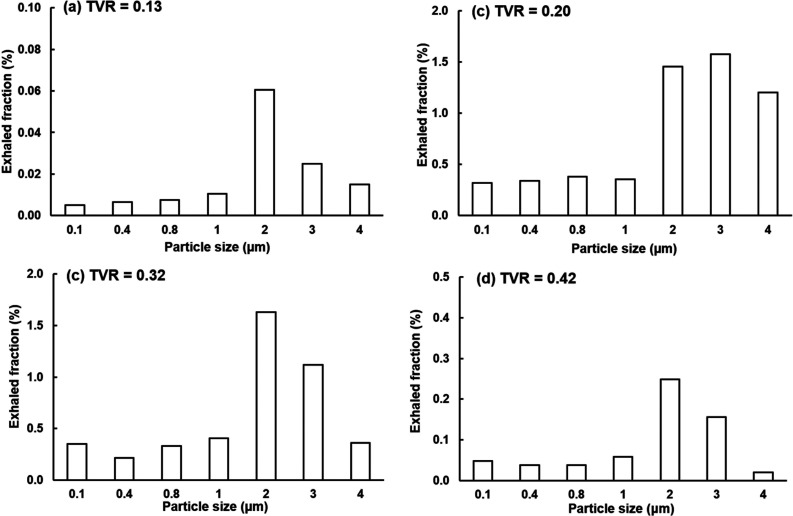
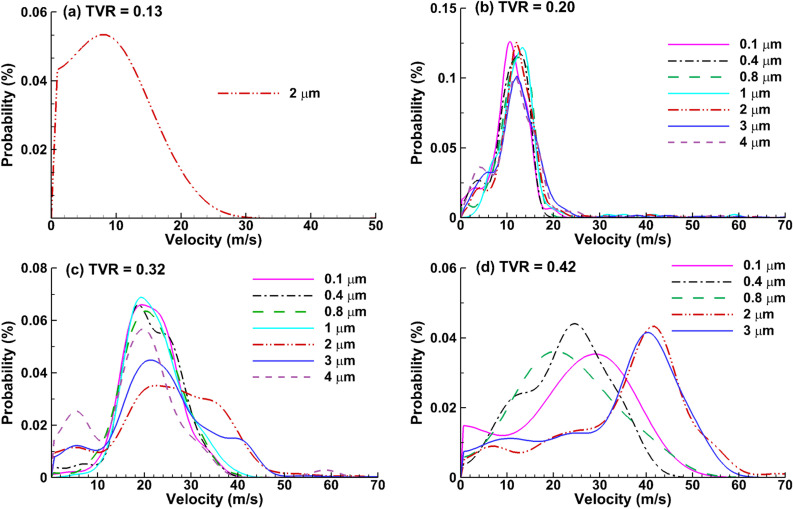
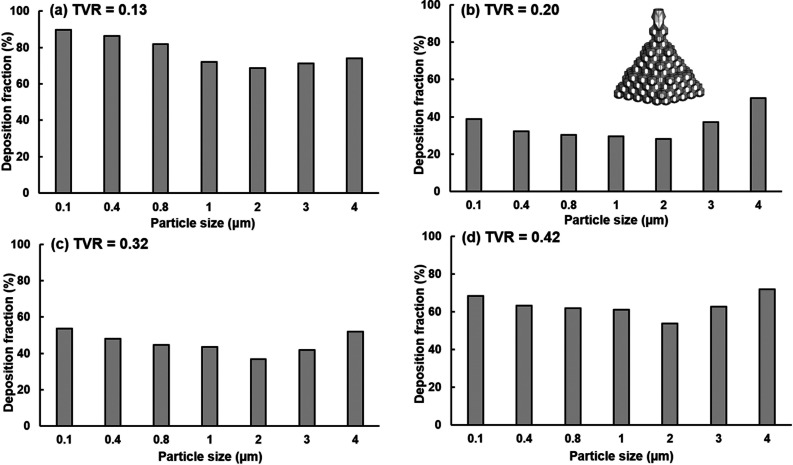
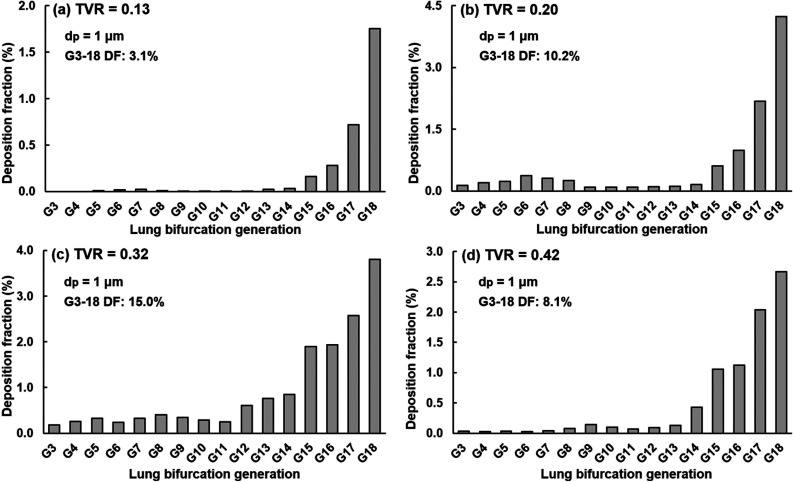
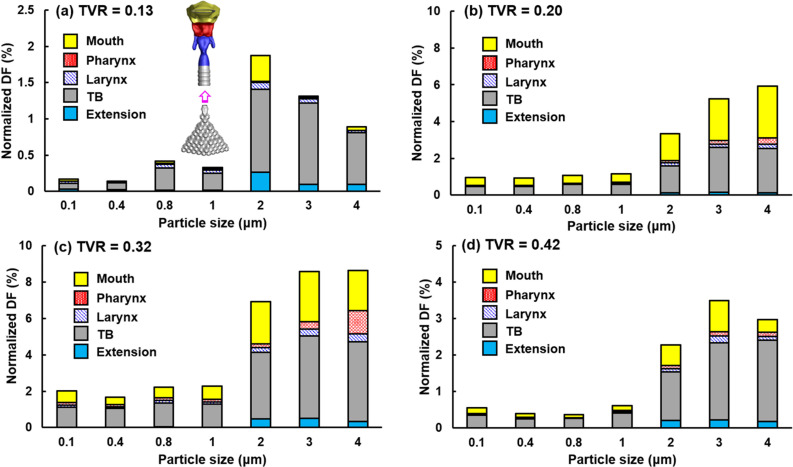
When an infected person coughs, many virus-laden droplets will be exhaled out of the mouth. Droplets from deep lungs are especially infectious because the alveoli are the major sites of coronavirus replication. However, their exhalation fraction, size distribution, and exiting speeds are unclear. This study investigated the behavior and fate of respiratory droplets (0.1-4 μm) during coughs in a single-path respiratory tract model extending from terminal alveoli to mouth opening. An experimentally measured cough waveform was used to control the alveolar wall motions and the flow boundary conditions at lung branches from G2 to G18. The mouth opening was modeled after the image of a coughing subject captured using a high-speed camera. A well-tested k-ω turbulence model and Lagrangian particle tracking algorithm were applied to simulate cough flow evolutions and droplet dynamics under four cough depths, i.e., tidal volume ratio (TVR) = 0.13, 0.20. 0.32, and 0.42. The results show that 2-μm droplets have the highest exhalation fraction, regardless of cough depths. A nonlinear relationship exists between the droplet exhalation fraction and cough depth due to a complex deposition mechanism confounded by multiscale airway passages, multiregime flows, and drastic transient flow effects. The highest exhalation fraction is 1.6% at the normal cough depth (TVR = 0.32), with a mean exiting speed of 20 m/s. The finding that most exhaled droplets from deep lungs are 2 μm highlights the need for more effective facemasks in blocking 2-μm droplets and smaller both in infectious source control and self-protection from airborne virus-laden droplets.


Figures

FIG. 1.
FIG. 1.
Multiscale single-path whole lung model: (a) single-path airway model from the mouth to the terminal alveoli, (b) single-path lung branches from G3 to G23, and (c) terminal alveolar model with internal septa and a cascade-branching pattern of alveolar ducts. The mouth opening has an ellipse ship and a dimension of 4.85 × 40 mm2, as captured using a high-speed camera during a cough. Cartilage rings are retained in the trachea, as well as in the main and secondary bronchi (i.e., G1 and G2).
FIG. 2.
FIG. 2.
Cough waveform and alveolar wall kinematics: (a) the in vivo measured cough waveform vs the computationally implemented (CFD: computational fluid dynamics) waveform represented using 15 line segments, (b) the volume-flow profile of the cough, (c) the time-varying exhaled volume, and (d) the time-varying lung volumes at four cough depths. The alveolar volumes at the start and end of a cough are shown in (e) at four cough depths. TVR: tidal volume ratio.
FIG. 3.
FIG. 3.
Computational mesh and sensitivity studies: (a) multiscale computational mesh with fine body-fitted elements in the near-wall region throughout the airway and (b) mesh sensitivity study of the exhalation fraction of 1-μm droplets by varying the mesh size from 1.8 × 10⁶ to 11.2 × 10⁶, and particle count sensitivity study by varying the number of tracked particles from 5000 to 200 000 for a given mesh of 8.5 × 10⁶.
FIG. 4.
FIG. 4.
Cough airflows at T = 0.15 s in the respiratory tract: (a) streamlines, (b) velocity iso-surface, and (c) instantaneous coherent structures in terms of the Q-criterion.
FIG. 5.
FIG. 5.
Snapshots of 1-μm droplet positions at t = 0.15 s from the beginning of the cough at TVR = 0.32.
FIG. 6.
FIG. 6.
Snapshots of 1-μm droplet positions at TVR = 0.32 at varying instants from the beginning of the cough: (a) 0.05 s, (b) 0.075 s, (c) 0.100 s, (d) 0.125 s, and (e) 0.175 s.
FIG. 7.
FIG. 7.
Exhaled fractions of respiratory droplets (0.1–4 μm) from the pulmonary alveoli at different cough depths: (a) TVR = 0.13, (b) 0.20, (c) 0.32, and (d) 0.42.
FIG. 8.
FIG. 8.
Temporal evolution of the respiratory droplet exhalation fraction for different droplet sizes at two cough depths: (a) TVR = 0.20 and (b) TVR = 0.32.
FIG. 9.
FIG. 9.
Velocity distributions of the exhaled droplets at the mouth opening at (a) TVR = 0.13, (b) 0.20, (c) 0.32, and (d) 0.42.
FIG. 10.
FIG. 10.
Alveolar deposition fractions at different cough depths: (a) TVR = 0.13, (b) 0.20, (c) 0.32, and (d) 0.42.
FIG. 11.
FIG. 11.
Deposition fraction of 1-μm droplets from the alveoli in the lung branches G3–G18 at different cough depths: (a) TVR = 0.13, (b) 0.20, (c) 0.32, and (d) 0.42.
FIG. 12.
FIG. 12.
Deposition fractions of respiratory droplets (0.1–4 μm) from the pulmonary alveoli in different regions of the extrathoracic airway at different cough depths: (a) TVR = 0.13, (b) 0.20, (c) 0.32, and (d) 0.42. Note that different ranges in the y-coordinate.
FIG. 13.
FIG. 13.
Normalized deposition fractions of respiratory droplets (0.1–4 μm) by the number of droplets from the pulmonary alveoli: (a) TVR = 0.13, (b) 0.20, (c) 0.32, and (d) 0.42. Note that different ranges in the y-coordinate.

Similar articles

Cited by

References

    1. WHO, see https://covid19.who.int/ for “WHO Coronavirus Disease (COVID-19) Dashboard, 2020.”
    1. CDC, see https://covid.cdc.gov/covid-data-tracker/#cases_casesper100klast7days for “United States COVID-19 Cases and Deaths by State, 2020.”
    1. Elrashdy F., Redwan E. M., and Uversky V. N., “ Why COVID-19 transmission is more efficient and aggressive than viral transmission in previous coronavirus epidemics?,” Biomolecules 10, 1312 (2020).10.3390/biom10091312 - DOI - PMC - PubMed
    1. Abdelrahman Z., Li M., and Wang X., “ Comparative review of SARS-CoV-2, SARS-CoV, MERS-CoV, and influenza a respiratory viruses,” Front. Immunol. 11, 552909 (2020).10.3389/fimmu.2020.552909 - DOI - PMC - PubMed
    1. Mehta P., McAuley D. F., Brown M., Sanchez E., Tattersall R. S., and Manson J. J., “ COVID-19: Consider cytokine storm syndromes and immunosuppression,” Lancet 395, 1033–1034 (2020).10.1016/S0140-6736(20)30628-0 - DOI - PMC - PubMed

LinkOut - more resources