. 2021 Mar 4:15:625167.
doi: 10.3389/fnins.2021.625167. eCollection 2021.

RAFF-4, Magnetization Transfer and Diffusion Tensor MRI of Lysophosphatidylcholine Induced Demyelination and Remyelination in Rats

Affiliations

RAFF-4, Magnetization Transfer and Diffusion Tensor MRI of Lysophosphatidylcholine Induced Demyelination and Remyelination in Rats

Klara Holikova et al. Front Neurosci. .

Erratum in

Abstract

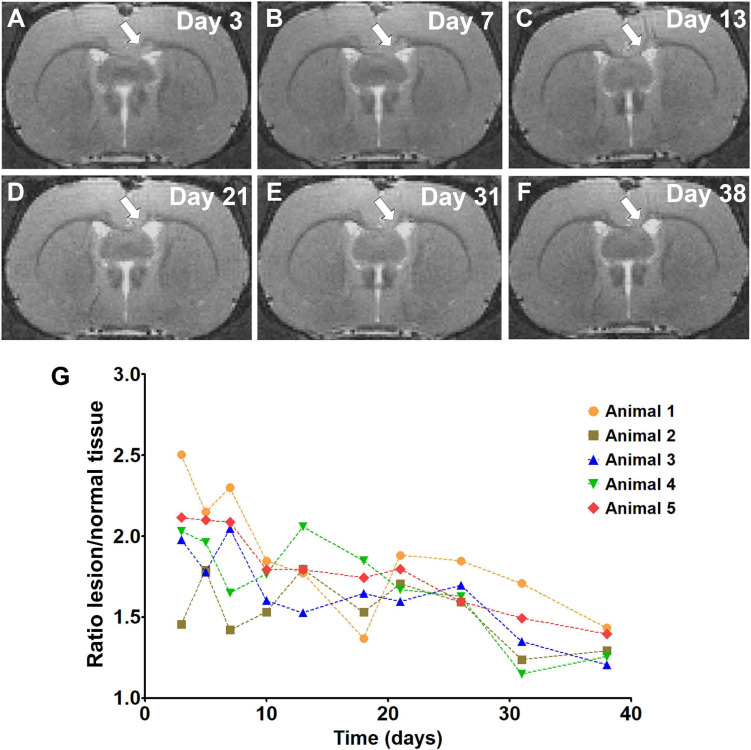
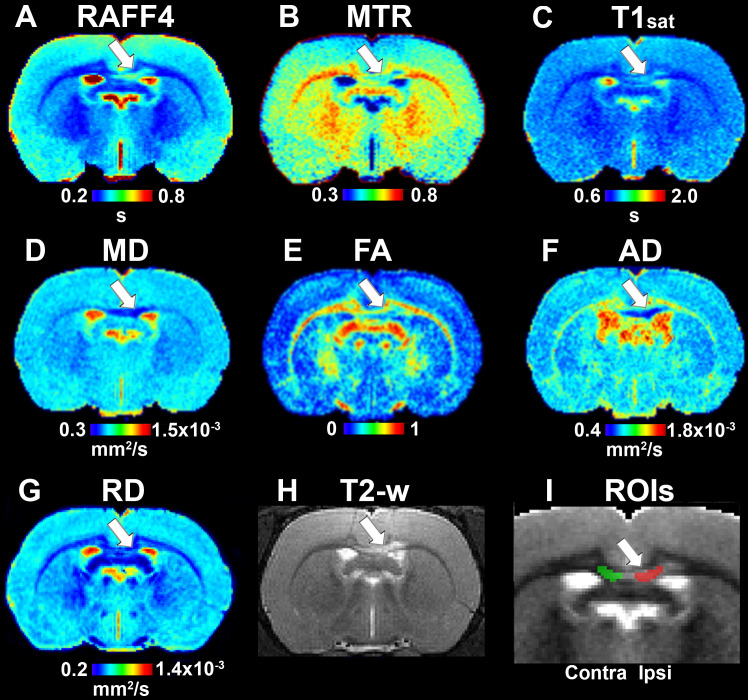
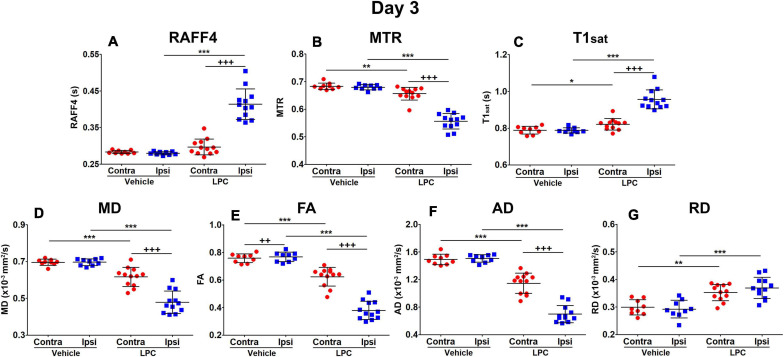
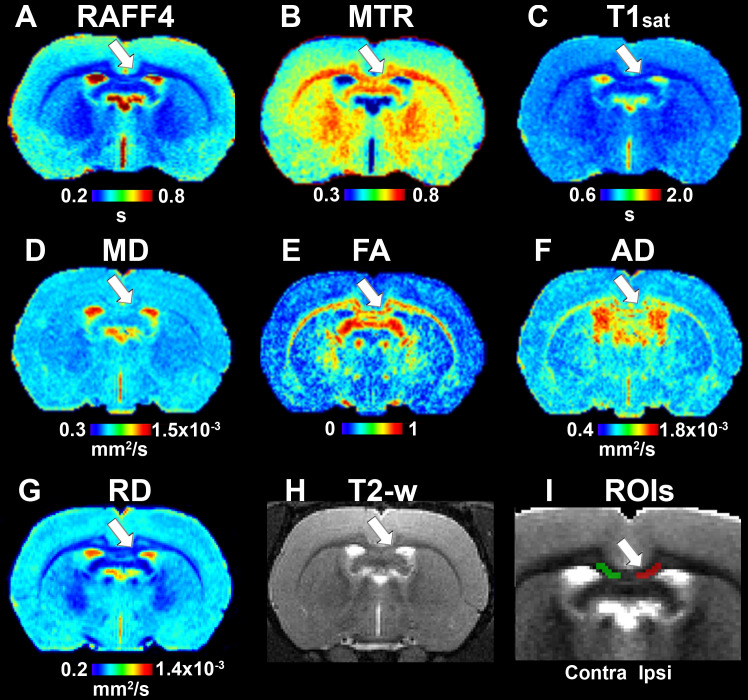
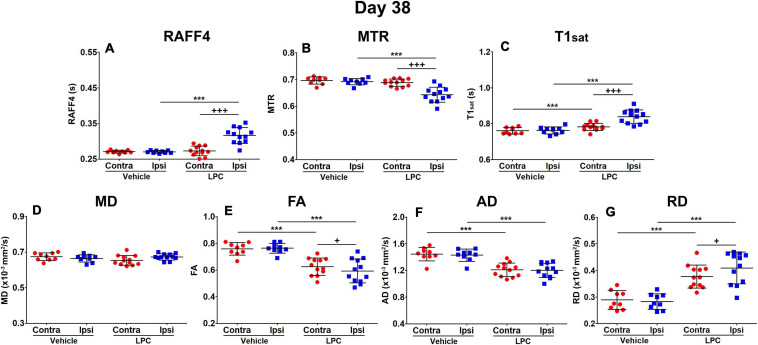
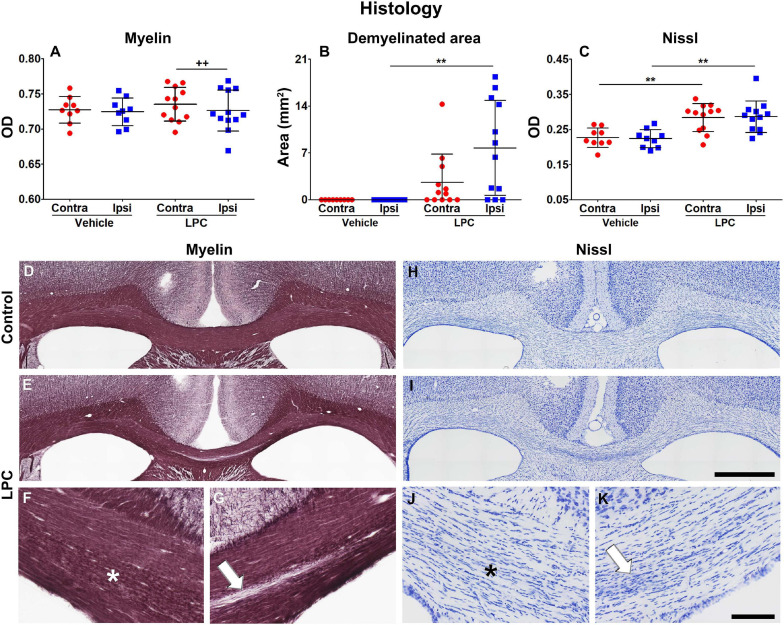
Remyelination is a naturally occurring response to demyelination and has a central role in the pathophysiology of multiple sclerosis and traumatic brain injury. Recently we demonstrated that a novel MRI technique entitled Relaxation Along a Fictitious Field (RAFF) in the rotating frame of rank n (RAFFn) achieved exceptional sensitivity in detecting the demyelination processes induced by lysophosphatidylcholine (LPC) in rat brain. In the present work, our aim was to test whether RAFF4, along with magnetization transfer (MT) and diffusion tensor imaging (DTI), would be capable of detecting the changes in the myelin content and microstructure caused by modifications of myelin sheets around axons or by gliosis during the remyelination phase after LPC-induced demyelination in the corpus callosum of rats. We collected MRI data with RAFF4, MT and DTI at 3 days after injection (demyelination stage) and at 38 days after injection (remyelination stage) of LPC (n = 12) or vehicle (n = 9). Cell density and myelin content were assessed by histology. All MRI metrics detected differences between LPC-injected and control groups of animals in the demyelination stage, on day 3. In the remyelination phase (day 38), RAFF4, MT parameters, fractional anisotropy, and axial diffusivity detected signs of a partial recovery consistent with the remyelination evident in histology. Radial diffusivity had undergone a further increase from day 3 to 38 and mean diffusivity revealed a complete recovery correlating with the histological assessment of cell density attributed to gliosis. The combination of RAFF4, MT and DTI has the potential to differentiate between normal, demyelinated and remyelinated axons and gliosis and thus it may be able to provide a more detailed assessment of white matter pathologies in several neurological diseases.

Keywords: MRI; demyelination; diffusion; myelin; remyelination; rotating frame relaxation.


Conflict of interest statement

The authors declare that the research was conducted in the absence of any commercial or financial relationships that could be construed as a potential conflict of interest.

Figures

FIGURE 1
FIGURE 1
T2 weighted images showing the lesion in the corpus callosum (white arrow) and its development from day 3 to day 38 (A–F). The graph represents the signal intensity ratio between lesioned and normal tissue on individual days (G).
FIGURE 2
FIGURE 2
Quantitative MRI maps in the demyelination phase, on day 3: RAFF4 (A), magnetization transfer ratio, MTR (B), T1sat (C), mean diffusivity, MD (D), fractional anisotropy, FA (E), axial diffusivity, AD (F), radial diffusivity, RD (G), T2w image with lesion (H) and representative example of ROIs for analyzing the lesion on a grayscale RAFF4 map (I). White arrow points to the lesion in the corpus callosum.
FIGURE 3
FIGURE 3
Region of interest analysis of MRI parameters in the demyelination phase, on day 3: RAFF4 (A), magnetization transfer ratio, MTR (B), T1sat (C), mean diffusivity MD (D), fractional anisotropy, FA (E) and axial and radial diffusivity, AD (F), and RD (G). Values obtained from the ipsilateral and contralateral sides of LPC injected (n = 12) rats and from the corresponding ROI in the vehicle injected (n = 9) rats. Mean ± SD, paired (+) or unpaired (*) t-test, FDR corrected p-values: *<0.05, ** or ++<0.01, *** or +++<0.001.
FIGURE 4
FIGURE 4
Quantitative MRI maps in the remyelination phase, on day 38. Relaxation time constant map of RAFF4 (A), magnetization transfer ratio, MTR (B), T1sat (C), mean diffusivity, MD (D), fractional anisotropy, FA (E), axial diffusivity, AD (F), radial diffusivity, RD (G), T2w image with the lesion (H) and a representative example of ROIs for analyzing lesion on a grayscale RAFF4 map (I). White arrow points to the lesion in the corpus callosum.
FIGURE 5
FIGURE 5
Region of interest analysis of MRI parameters in the remyelinization phase, on day 38: RAFF4 (A), magnetization transfer ratio, MTR (B), T1sat (C), mean diffusivity MD (D), fractional anisotropy, FA (E) and axial and radial diffusivity, AD (F) and RD (G). Values obtained from the ipsilateral and contralateral side of LPC injected (n = 12) rats and from the corresponding ROI in the vehicle injected (n = 9) rats. Mean ± SD, paired (+) or unpaired (*) t-test, FDR corrected p-values: + < 0.05, *** or +++<0.001.
FIGURE 6
FIGURE 6
Histologic assessment of the myelin and Nissl stainings at 38 days after vehicle or LPC injection. OD (A) and demyelinated area (B) analyses of the myelin-stained sections, and OD analysis of the Nissl-stained (C) sections. Values were obtained from the ipsi- and contralateral corpus callosum of vehicle- (n = 9) and LPC-injected (n = 12) rats. Results are shown as mean ± SD. The unpaired t-test compared the same hemispheres between vehicle- and LPC-injected rats (**p < 0.01), and the paired t-test ipsi- and contralateral hemispheres within the same animals (++p < 0.01). Photomicrographs of vehicle- and LPC-injected animals in myelin (D–G) and Nissl (H–K) stains of representative rats. The white arrow points to the ongoing demyelinated area and the presence of gliosis, and the asterisk indicates the area with ongoing myelin alterations accompanied by gliosis. Scale bar: 1 mm (D,E,H,I) and 200 μm (F,G,J,K).

References

    1. Armstrong R. C., Mierzwa A. J., Marion C. M., Sullivan G. M. (2016a). White matter involvement after TBI: clues to axon and myelin repair capacity. Exp. Neurol. 275 328–333. 10.1016/j.expneurol.2015.02.011 - DOI - PubMed
    1. Armstrong R. C., Mierzwa A. J., Sullivan G. M., Sanchez M. A. (2016b). Myelin and oligodendrocyte lineage cells in white matter pathology and plasticity after traumatic brain injury. Neuropharmacology 110 654–659. 10.1016/j.neuropharm.2015.04.029 - DOI - PubMed
    1. Benjamini Y., Hochberg Y. (1995). Controlling the false discovery rate: a practical and powerful approach to multiple testing. J. R. Stat. Soc. B 57 289–300. 10.1111/j.2517-6161.1995.tb02031.x - DOI
    1. Budde M. D., Janes L., Gold E., Turtzo L. C., Frank J. A. (2011). The contribution of gliosis to diffusion tensor anisotropy and tractography following traumatic brain injury: validation in the rat using Fourier analysis of stained tissue sections. Brain 134:2248. 10.1093/brain/awr161 - DOI - PMC - PubMed
    1. Chenevert T., Stegman L., Taylor J., Robertson P., Greenberg H., Rehemtulla A. (2000). Diffusion magnetic resonance imaging: an early surrogate marker of therapeutic efficacy in brain tumors. ı J. Natl. Cancer Inst. 92 2029–2036. 10.1093/jnci/92.24.2029 - DOI - PubMed

LinkOut - more resources