

Paraventricular Nucleus Infusion of Oligomeric Proantho Cyanidins Improves Renovascular Hypertension
- PMID: 33746706
- PMCID: PMC7969814
- DOI: 10.3389/fnins.2021.642015
Paraventricular Nucleus Infusion of Oligomeric Proantho Cyanidins Improves Renovascular Hypertension
Abstract
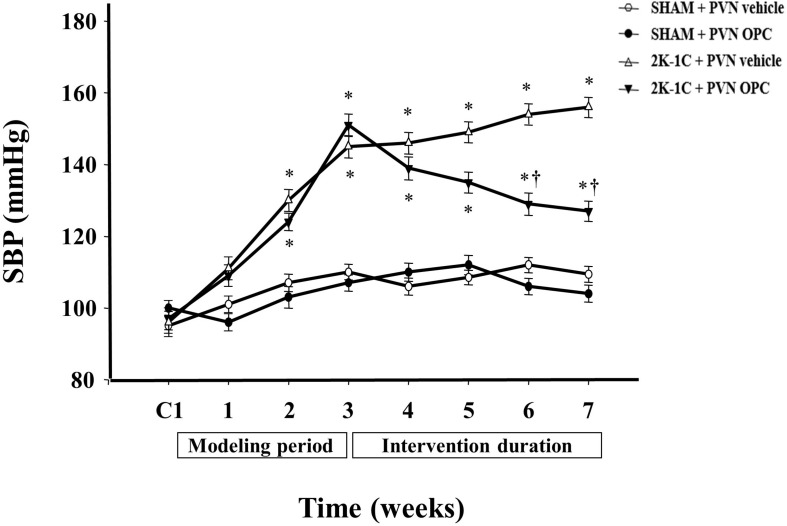
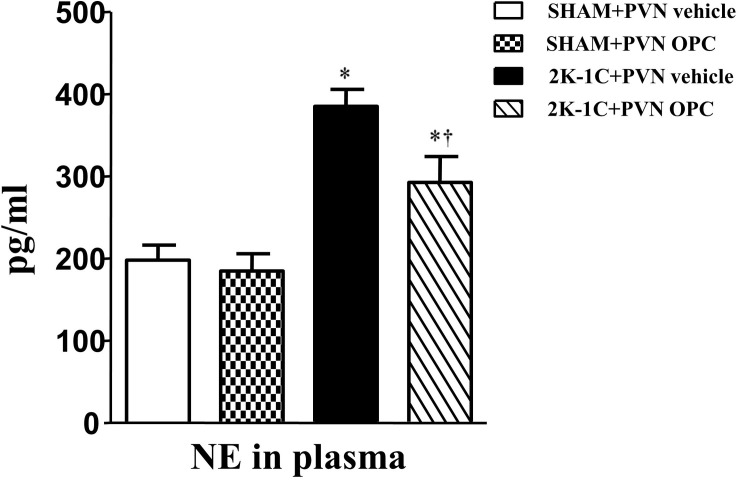
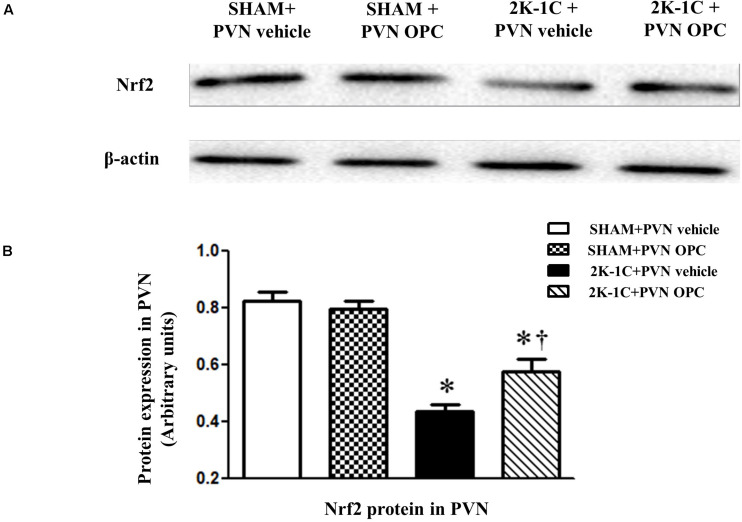
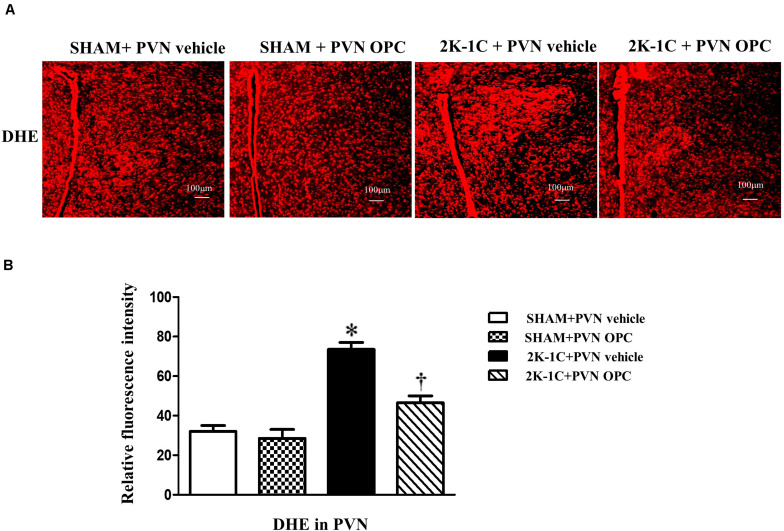
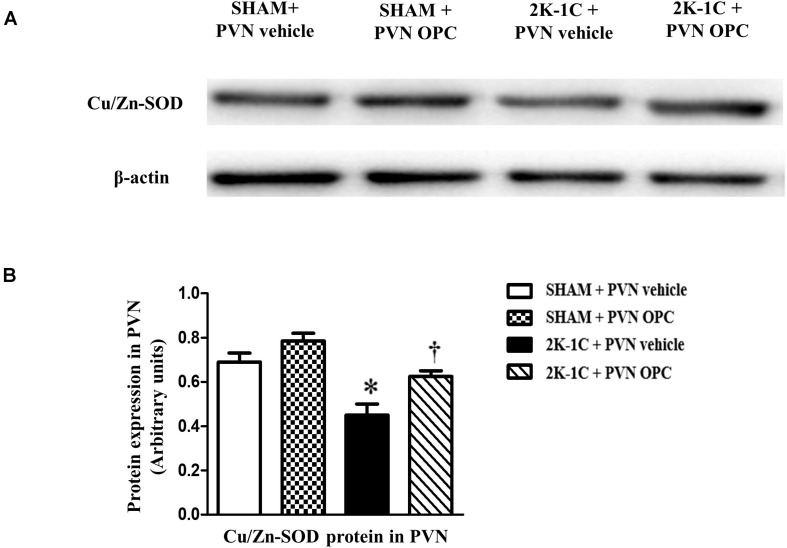
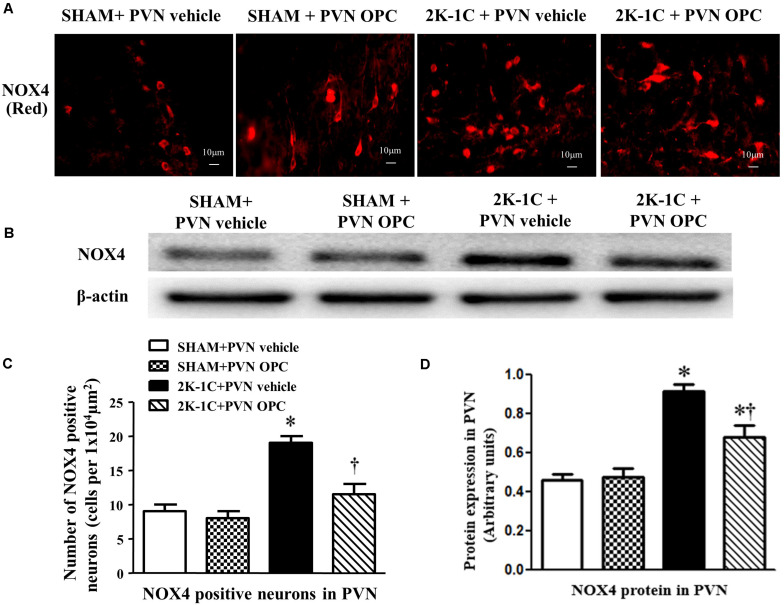
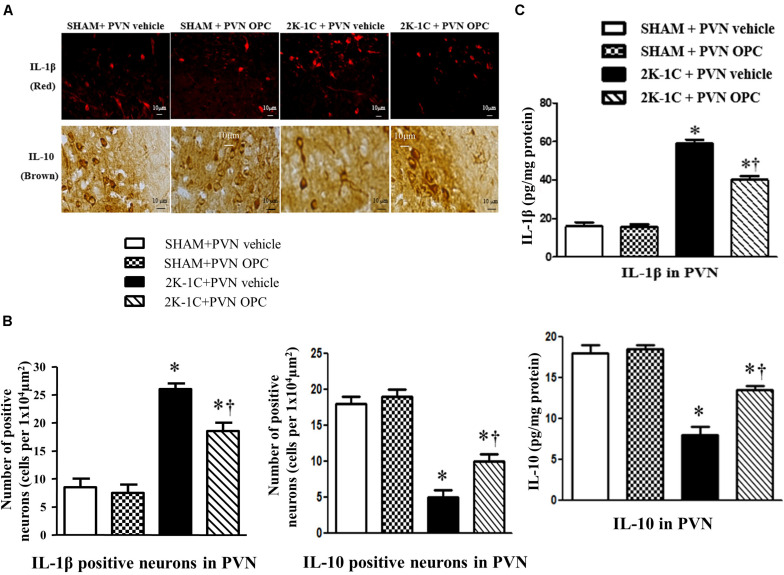
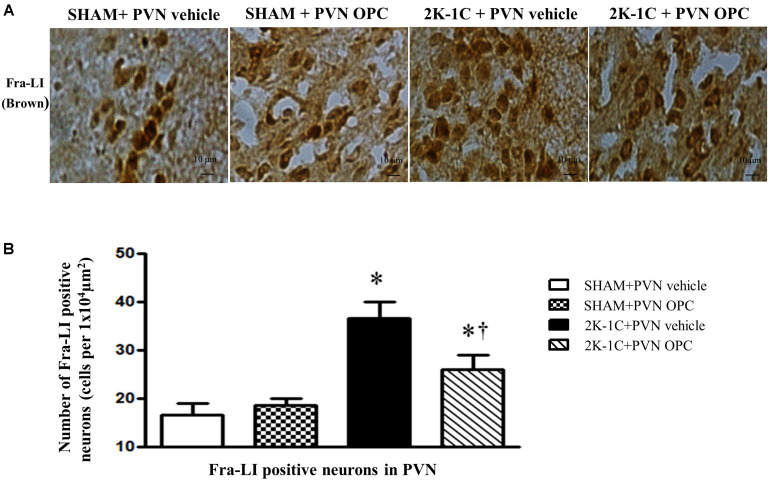
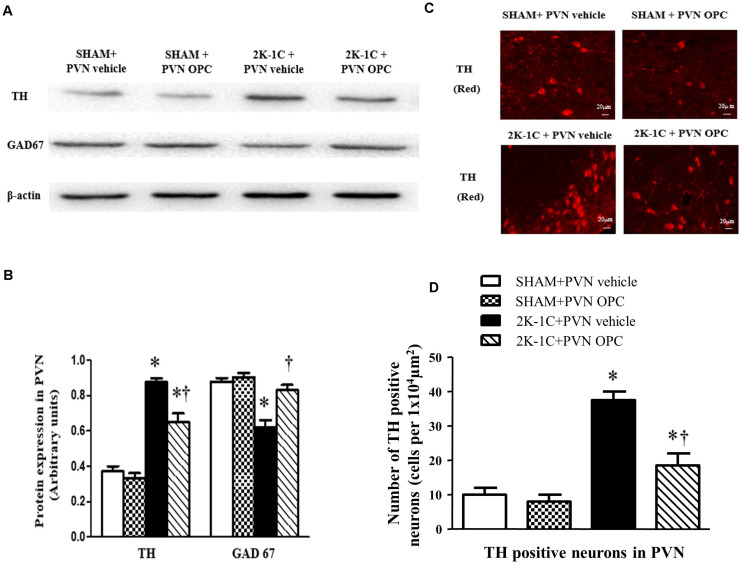
Oxidative stress plays an important role in the pathogenesis of hypertension. Oligomeric proantho cyanidins (OPC) is the main polyphenol presents in grape seed and is known for its potent antioxidant and anti-inflammatory properties. In the present study, we hypothesize that OPC can attenuate oxidative stress in the paraventricular nucleus of hypothalamus (PVN), ameliorate neurotransmitter imbalance, decrease the blood pressure and sympathetic activity in renovascular hypertensive rats. After induction of renovascular hypertension by the two-kidney one-clip (2K-1C) method, male Sprague-Dawley rats received chronic bilateral PVN infusion of OPC (20 μg/h) or vehicle via osmotic minipump for 4 weeks. We found that hypertension induced by 2K-1C was associated with the production of reactive oxygen species (ROS) in the PVN. Infusion of OPC in the PVN significantly reduced the systolic blood pressure and norepinephrine in plasma of 2K-1C rats. In addition, PVN infusion of OPC decreased the level of ROS and the expression of stress-related nicotinamide adenine dinucleotide phosphate (NADPH) oxidases subunit NOX4, increased the levels of nuclear factor E2-related factor 2 (Nrf2) and antioxidant enzyme, balanced the content of cytokines, increased expression of glutamic acid decarboxylase and decreased the expression of tyrosine hydroxylase in the PVN of 2K-1C rats. Our findings provided strong evidence that PVN infusion of OPC inhibited the progression of renovascular hypertension through its potent anti-oxidative and anti-inflammatory function in the PVN.
Keywords: hypertension; hypothalamic paraventricular nucleus; neurotransmitters; oligomeric proantho cyanidins; oxidative stress.
Copyright © 2021 Yu, Xin, Liu, Liu, Fu, Qi, Kang, Meng, Yi, Li, Sun and Kang.
Conflict of interest statement
The authors declare that the research was conducted in the absence of any commercial or financial relationships that could be construed as a potential conflict of interest.
Figures
Similar articles
-
Paraventricular Nucleus Infusion of Epigallocatechin-3-O-Gallate Improves Renovascular Hypertension.Cardiovasc Toxicol. 2016 Jul;16(3):276-85. doi: 10.1007/s12012-015-9335-x. Cardiovasc Toxicol. 2016. PMID: 26162770
-
Chronic infusion of lisinopril into hypothalamic paraventricular nucleus modulates cytokines and attenuates oxidative stress in rostral ventrolateral medulla in hypertension.Toxicol Appl Pharmacol. 2014 Sep 1;279(2):141-9. doi: 10.1016/j.taap.2014.06.004. Epub 2014 Jun 14. Toxicol Appl Pharmacol. 2014. PMID: 24937322
-
Chronic infusion of epigallocatechin-3-O-gallate into the hypothalamic paraventricular nucleus attenuates hypertension and sympathoexcitation by restoring neurotransmitters and cytokines.Toxicol Lett. 2016 Nov 16;262:105-113. doi: 10.1016/j.toxlet.2016.09.010. Epub 2016 Sep 19. Toxicol Lett. 2016. PMID: 27659729
-
Mechanisms of renal sympathetic activation in renovascular hypertension.Exp Physiol. 2015 Apr 20;100(5):496-501. doi: 10.1113/expphysiol.2014.079855. Exp Physiol. 2015. PMID: 25639235 Review.
-
The role of oxidative stress in renovascular hypertension.Clin Exp Pharmacol Physiol. 2011 Feb;38(2):144-52. doi: 10.1111/j.1440-1681.2010.05437.x. Clin Exp Pharmacol Physiol. 2011. PMID: 20678153 Review.
Cited by
-
Proanthocyanidins may be potential therapeutic agents for the treatment of carotid atherosclerosis: A review.J Int Med Res. 2023 Apr;51(4):3000605231167314. doi: 10.1177/03000605231167314. J Int Med Res. 2023. PMID: 37096349 Free PMC article. Review.
-
Luteolin Attenuates Hypertension via Inhibiting NF-κB-Mediated Inflammation and PI3K/Akt Signaling Pathway in the Hypothalamic Paraventricular Nucleus.Nutrients. 2023 Jan 18;15(3):502. doi: 10.3390/nu15030502. Nutrients. 2023. PMID: 36771206 Free PMC article.
-
Natural polyphenols as novel interventions for aging and age-related diseases: Exploring efficacy, mechanisms of action and implications for future research.Chin Herb Med. 2024 Sep 3;17(2):279-291. doi: 10.1016/j.chmed.2024.09.001. eCollection 2025 Apr. Chin Herb Med. 2024. PMID: 40256718 Free PMC article. Review.
-
Exercise Training Attenuates Hypertension via Suppressing ROS/MAPK/NF-κB/AT-1R Pathway in the Hypothalamic Paraventricular Nucleus.Nutrients. 2022 Sep 24;14(19):3968. doi: 10.3390/nu14193968. Nutrients. 2022. PMID: 36235619 Free PMC article.
-
A bio-functional cryogel with antioxidant activity for potential application in bone tissue repairing.Heliyon. 2024 Aug 28;10(17):e37055. doi: 10.1016/j.heliyon.2024.e37055. eCollection 2024 Sep 15. Heliyon. 2024. PMID: 39286229 Free PMC article.
References
-
- Bai J., Yu X. J., Liu K. L., Wang F. F., Jing G. X., Li H. B., et al. (2017). Central administration of tert-butylhydroquinone attenuates hypertension via regulating Nrf2 signaling in the hypothalamic paraventricular nucleus of hypertensive rats. Toxicol. Appl. Pharmacol. 333 100–109. 10.1016/j.taap.2017.08.012 - DOI - PubMed
LinkOut - more resources
Full Text Sources
Other Literature Sources