. 2021 Mar 4:14:628996.
doi: 10.3389/fnmol.2021.628996. eCollection 2021.

Lateral Habenula Glutamatergic Neurons Modulate Isoflurane Anesthesia in Mice

Affiliations

Lateral Habenula Glutamatergic Neurons Modulate Isoflurane Anesthesia in Mice

Chengxi Liu et al. Front Mol Neurosci. .

Abstract

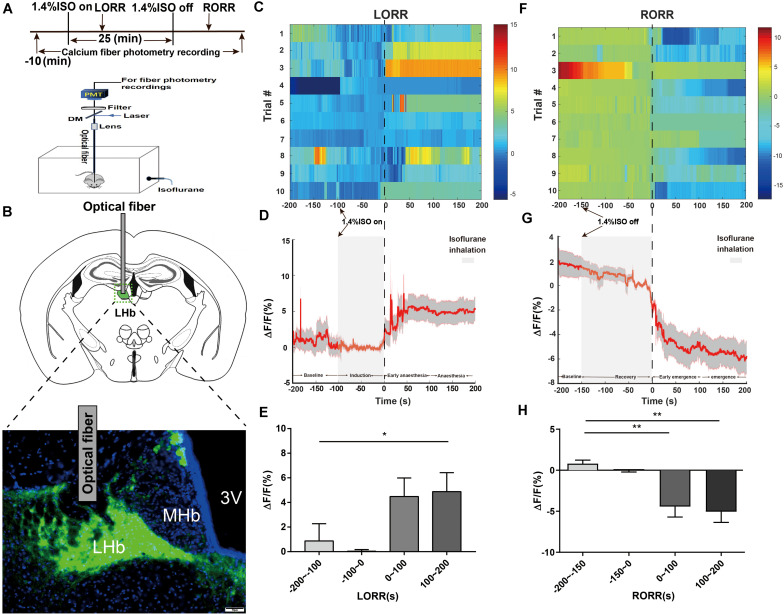
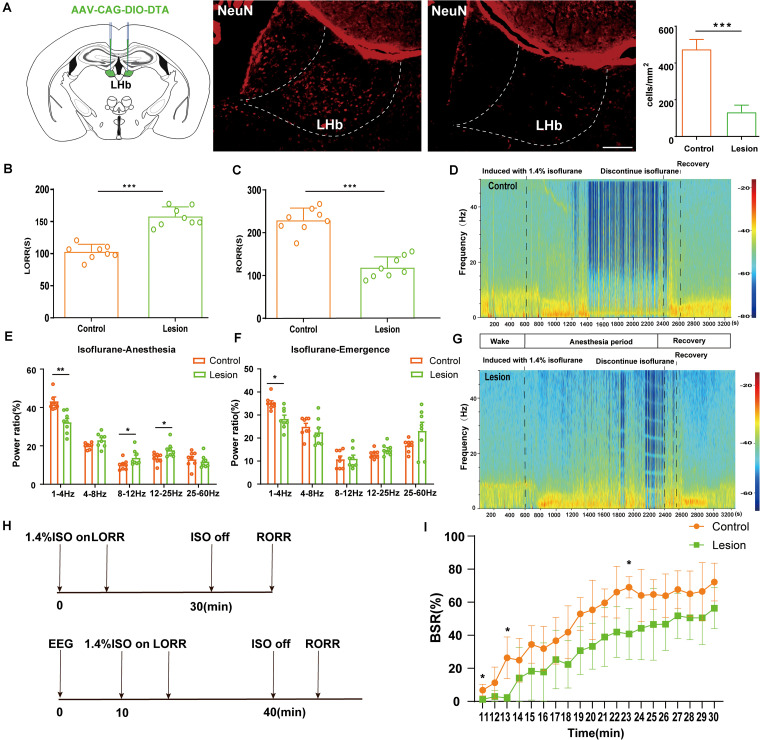
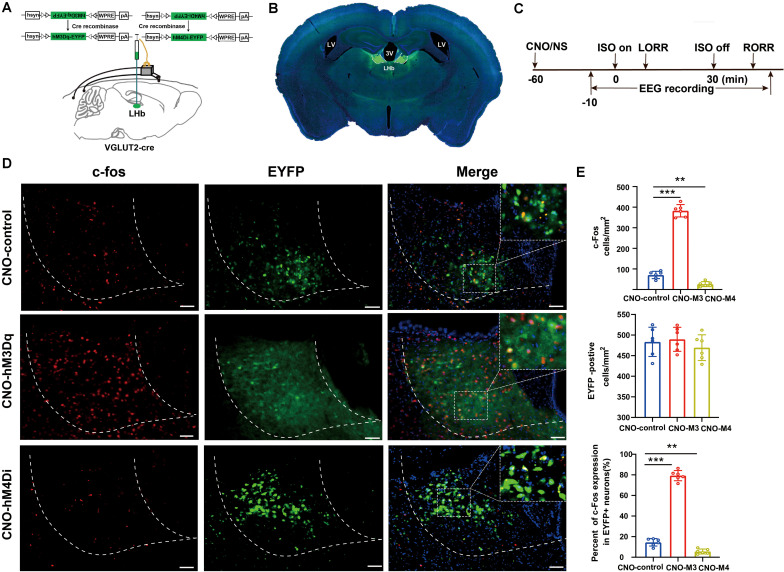
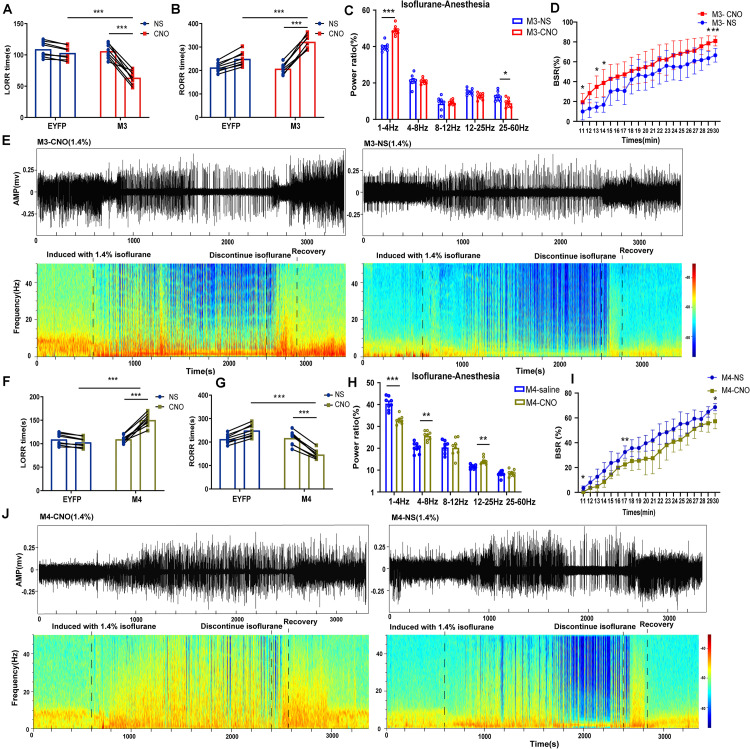
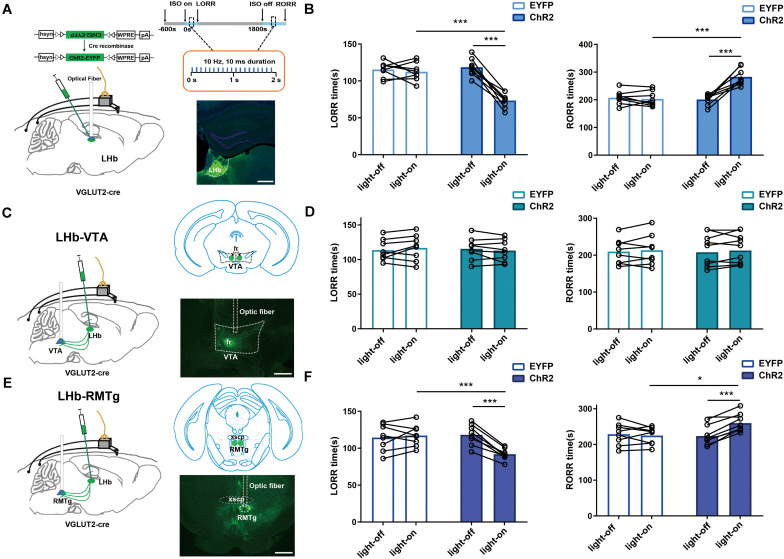
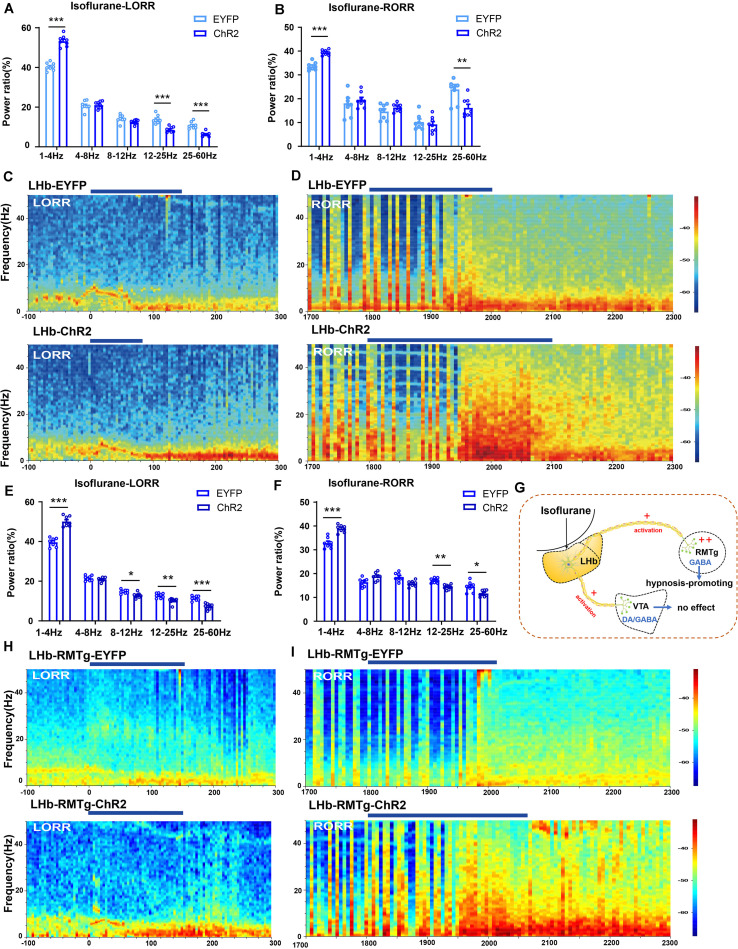
Since their introduction in the 1840s, one of the largest mysteries of modern anesthesia are how general anesthetics create the state of reversible loss of consciousness. Increasing researchers have shown that neural pathways that regulate endogenous sleep-wake systems are also involved in general anesthesia. Recently, the Lateral Habenula (LHb) was considered as a hot spot for both natural sleep-wake and propofol-induced sedation; however, the role of the LHb and related pathways in the isoflurane-induced unconsciousness has yet to be identified. Here, using real-time calcium fiber photometry recordings in vivo, we found that isoflurane reversibly increased the activity of LHb glutamatergic neurons. Then, we selectively ablated LHb glutamatergic neurons in Vglut2-cre mice, which caused a longer induction time and less recovery time along with a decrease in delta-band power in mice under isoflurane anesthesia. Furthermore, using a chemogenetic approach to specifically activate LHb glutamatergic neurons shortened the induction time and prolonged the recovery time in mice under isoflurane anesthesia with an increase in delta-band power. In contrast, chemogenetic inhibition of LHb glutamatergic neurons was very similar to the effects of selective lesions of LHb glutamatergic neurons. Finally, optogenetic activation of LHb glutamatergic neurons or the synaptic terminals of LHb glutamatergic neurons in the rostromedial tegmental nucleus (RMTg) produced a hypnosis-promoting effect in isoflurane anesthesia with an increase in slow wave activity. Our results suggest that LHb glutamatergic neurons and pathway are vital in modulating isoflurane anesthesia.

Keywords: glutamatergic; induction time; isoflurane; lateral habenula; nucleus; recovery time; rostromedial tegmental.


Conflict of interest statement

The authors declare that the research was conducted in the absence of any commercial or financial relationships that could be construed as a potential conflict of interest.

Figures

FIGURE 1
FIGURE 1
Phase-dependent calcium alterations in LHb glutamatergic neurons during isoflurane anesthesia. (A) Top: Timeline for quantifying the LORR and RORR with isoflurane. Bottom: Schematic diagram depicting fiber photometry recording during isoflurane anesthesia in freely moving mice. (B) Schematic of establishing calcium signal recording model into the LHb in Vglut2-Cre mice, and representative image of the LHb expressing GCaMP6s and optical fiber implanting sites (scale bar = 50 μm). (C) Fluorescence calcium signals aligned to isoflurane-induced loss of righting reflex [LORR were represented the moment of 0, each row plots one trial and a total of 10 trials are illustrated. Color scale at the right represents the value of ΔF/F(%)]. (D) Mean (red trace) ± SEM (gray shading) indicating the average calcium transients during isoflurane induced LORR (n = 10). (E) The fluorescence calcium signals increased after isoflurane-induced unconsciousness [The baseline (wake: –200 to –100 s) vs anesthesia period (100 to 200 s), P = 0.0475, n = 10, Dunnett’s multiple comparisons test after one-way ANOVA]. (F) Fluorescence calcium signals aligned to isoflurane-induced recovery of righting reflex [RORR were represented the moment of 0, each row plots one trial and a total of 10 trials are illustrated. Color scale at the right represents the value of ΔF/F (%)]. (G) Mean (red trace) ± SEM (gray shading) showing the transients of average calcium signals during isoflurane-induced RORR (n = 10). (H) The fluorescence calcium signals sharply decreased during the transition from isoflurane-induced anesthesia to arousal [The baseline (anesthesia: –200 to –150 s) vs early emergence period (0 to 100 s); P = 0.0055; The baseline: (anesthesia: –200 to –150s) vs emergence period (100 to 200 s), P = 0.0026; assessed by one-way ANOVA with Dunnett’s multiple comparisons test; n = 10, *P < 0.05, **P < 0.01].
FIGURE 2
FIGURE 2
Bilateral lesion of LHb glutamatergic neurons on LORR and RORR time of isoflurane anesthesia. (A) Schematic representation of bilateral AAV injections into the LHb. Image showing NeuN (neuron-specific nuclear protein) staining from a mouse with specific LHb lesion using AAV-CAG-DIO-DTA (scale bar, 100 μm). The lesion group animals were selectively ablated LHb glutamatergic neurons. (B) Induction time and (C) recovery time in the lesion and sham groups (LORR: control group vs lesion group, n = 8; P = 0.000001 by independent-samples t-test; RORR: control group vs lesion group, n = 8; P = 0.00001 by independent-samples t-test n = 8 per group). (D) Spectrograms of EEG power during the isoflurane anesthesia period in the control group. (E) In the isoflurane anesthesia period, the power ratios of the δ band (1–4 Hz), α band (8–12 Hz) and β (12–25 Hz) in the lesion group were significantly changed (δ band: lesion group vs control group; P = 0.002 by independent-samples t-test; α band: lesion group vs control group; P = 0.045 by independent-samples t-test; β band: lesion group vs control group; P = 0.020 by independent-samples t-test, n = 8 per group). (F) Lesion of LHb glutamatergic neurons displaying a significant decrease in the δ band (1–4 Hz) between the two groups (lesion group vs control group; P = 0.03 by independent-samples t-test). (G) Spectrograms of EEG power during the isoflurane anaesthesia period in the lesion group. (H) Protocol for behavioral and electroencephalogram (EEG) recording of induction and emergence times. (I) BSR at 20 min before cessation of isoflurane in M3-NS or M3-CNO. BSR is plotted at each minute (n = 8), using two-way analysis of variance (ANOVA) followed by post hoc Bonferroni’s multiple comparisons: F(1, 14) = 15.06, P = 0.0017 (n = 8 per group; mean ± SD; *P < 0.05, **P < 0.01, and ***P < 0.001).
FIGURE 3
FIGURE 3
Activation/inactivation of LHb glutamatergic neurons induced LHb c-Fos expression during isoflurane anesthesia. (A) Surgical manipulations and experimental schematic for chemogenetic stimulation of LHb glutamatergic neurons. (B) Representative images of chemogenetic virus expression in LHb (scale bar, 1 mm). (C) Timelines of isoflurane anesthesia-related behavioral and EEG tests measuring induction time (LORR) and emergence time (RORR). (D) Representative images of c-Fos expression (red) and EYFP (green) in control (EYFP), hM3Dq-CNO and hM4Di-CNO mice groups after treatment with CNO (scale bar, 100 μm). (E) CNO administration decreased c-Fos expression in mCherry + neurons by 74%. Quantification of CNO administration induced the number of c-fos-positive neurons, the number of EYFP-positive neurons, and the percent of c-Fos expressing in EYFP-positive neurons after CNO administration (CNO administration significantly increased c-Fos expression in EYFP + neurons, P < 0.001 by Bonferroni’s post hoc test after one-way ANOVA; CNO administration decreased c-Fos expression in EYFP + neurons, P = 0.002 by Bonferroni’s post hoc test after one-way ANOVA; n = 6 per group; mean ± SD; **P < 0.01 and ***P < 0.001).
FIGURE 4
FIGURE 4
Chemogenetic manipulation of LHb glutamatergic neurons changed induction and arousal from isoflurane. (A) Chemogenetic activation of LHb glutamatergic neurons shortened loss of righting reflex (LORR) time from 1.4% isoflurane anesthesia. (M3-NS vs M3-CNO, P = 0.000046, paired t-test; Control-CNO vs. hM3Dq-CNO, P = 0.000003, independent-simples t-test; n = 8 per group). (B) Chemogenetic activation of LHb glutamatergic neurons prolonged the recovery of righting reflex (RORR) time from 1.4% isoflurane anesthesia (M3-NS vs M3-CNO, P = 0.000002, paired t-test; EYFP-CNO vs M3-CNO, P = 0.000253, independent-simples t-test; n = 8per group). (C) The power distribution of EEG frequency bands in M3-NS or M3-CNO group under 1.4% isoflurane anesthesia; (δ band: P = 0.000044, paired t-test; α band: P = 0.011, paired t-test). (D) BSR at 20 min before cessation of isoflurane in M3-NS or M3-CNO. BSR is plotted at each minute (n = 8), using two-way analysis of variance (ANOVA) followed by post hoc Bonferroni’s multiple comparisons: F(1, 14) = 8.406, P = 0.0117. (E) Representative EEG waveforms and spectrograms EEG power of M3-CNO and M3-NS under 1.4% isoflurane anesthesia. (F) Chemogenetic inactivation of LHb glutamatergic neurons prolonged the induction time from 1.4% isoflurane anesthesia (M4-NS vs M4-CNO, P = 0.000052, paired t-test; EYFP-CNO vs M4-CNO, P = 0.000002, independent-simples t-test). (G) Chemogenetic inactivation of LHb glutamatergic neurons shortened the recovery time from 1.4% isoflurane anesthesia (M4-NS vs M4-CNO, P = 0.000014, paired t-test; EYFP-CNO vs M4-CNO, P = 0.000003, independent-simples t-test). (H) The power distribution of EEG frequency bands during chemogenetic inactivation of LHb glutamatergic neurons under 1.4% isoflurane anesthesia (M4-NS vs M4-CNO: δ band, P = 0.000312, paired t-test; θ band, P = 0.01, paired t-test; β band, P = 0.01, paired t-test). (I) BSR at 20 min before cessation of isoflurane in M4-NS or M4-CNO. BSR is plotted at each minute (n = 8), using two-way analysis of variance (ANOVA) followed by post hoc Bonferroni’s multiple comparisons: F(1, 14) = 11.66, P = 0.0042. (J) Representative EEG waveforms and spectrograms EEG power of M4-CNO and M4-NS under 1.4% isoflurane anesthesia (*P < 0.05; **P < 0.01; ***P < 0.001; n = 8 per group).
FIGURE 5
FIGURE 5
LHb glutamatergic neurons modulated isoflurane anesthesia through the LHb-RMTg pathway. (A) Left: Schematic of optogenetic stimulation of ChR2-expressing LHb glutamatergic neurons with EEG recordings; Right: Protocol for optogenetic activation during isoflurane anesthesia (Top). Image of ChR2-expressing LHb glutamatergic neurons (Bottom, scale bar, 400 μm). (B) Optical activation of LHb glutamatergic neurons shortened induction time (LORR: EYFP-light-on vs ChR2-light-on, P = 0.000008, independent-simples t-test; ChR2-light-on vs ChR2-light-off, P = 0.000043, paired t-test) and prolonged emergence time from 1.4% isoflurane anesthesia (RORR: EYFP-light-on vs ChR2-light-on, P = 0.000363, independent-simples t-test; ChR2-light-on vs ChR2-light-off, P = 0.000074, paired t-test). (C) Schematic of optogenetic stimulation of ChR2-expressing glutamatergic terminals in the ventral tegmental area (VTA) with EEG recordings (left); image of ChR2 expression in the VTA (right, scale bar, 400 μm). (D) Optical stimulation of glutamatergic terminals in the VTA had no impact on the induction and emergence time during isoflurane anesthesia. (E) Schematic of optogenetic stimulation of ChR2-expressing glutamatergic terminals in the rostromedial tegmental nucleus (RMTg) with EEG recordings (left); image of ChR2 expression in the RMTg (right, scale bar, 400 μm). (F) Optical activation of glutamatergic terminals in the RMTg accelerated the induction (LORR: EYFP-light-on vs ChR2-light-on, P = 0.000154, independent-simples t-test; ChR2-light-on vs ChR2-light-off, P = 0.000049, paired t-test) and slacked the emergence from 1.4% isoflurane anesthesia (RORR: EYFP-light-on vs ChR2-light-on, P = 0.0218, independent-simples t-test; ChR2-light-on vs ChR2-light-off, P = 0.0007, paired t-test; *P < 0.05; ***P < 0.001; n = 8 per group).
FIGURE 6
FIGURE 6
Optical activation of LHb glutamatergic neurons or the LHb-RMTg pathway affected the cortical EEG. (A) Optical activation of LHb glutamatergic neurons changed the cortical EEG during induction (EYFP-light-on vs ChR2-light-on, δ band: P = 0.0002, independent-simples t-test; β band: P = 0.00043, independent-simples t-test; γ band: P = 0.000161, independent-simples t-test). (B) Power percentage changes in cortical EEG during arousal from isoflurane with (EYFP-light-on vs ChR2-light-on, δ band: P = 0.000121, independent-simples t-test; γ band: P = 0.006, independent-simples t-test). (C,D) Representative EEG waveforms and spectrograms EEG power of LHb-EYFP and LHb-ChR2 group under 1.4% isoflurane anesthesia during isoflurane-induced process (C) and recovery process (D). (E) Optogenetic activation of the LHb-RMTg pathway altered the power distribution of EEG frequency bands during the isoflurane-induced process (EYFP-light-on vs ChR2-light-on, δ band: P = 0.00002, independent-simples t-test; α band: P = 0.05, independent-simples t-test; β band: P = 0.001, independent-simples t-test; γ band: P = 0.000022, independent-simples t-test). (F) Optogenetic activation of the LHb-RMTg pathway altered the power distribution of EEG frequency bands during recovery process (EYFP-light-on vs ChR2-light-on, δ band: P = 0.0000037, independent-simples t-test; β band: P = 0.0001, independent-simples t-test; γ band: P = 0.0183, independent-simples t-test). (G) One mechanism for LHb modulate isoflurane anesthesia in mice through RMTg neurons. (H,I) Representative EEG waveforms and spectrograms EEG power in the LHb-RMTg-EYFP and LHb-RMTg-ChR2 during isoflurane-induced process (H) and recovery process (I) (*P < 0.05; **P < 0.01; ***P < 0.001; n = 8 per group).

Similar articles

Cited by

References

    1. Aizawa H., Cui W., Tanaka K., Okamoto H. (2013a). Hyperactivation of the habenula as a link between depression and sleep disturbance. Front. Hum. Neurosci. 7:826. 10.3389/fnhum.2013.00826 - DOI - PMC - PubMed
    1. Aizawa H., Kobayashi M., Tanaka S., Fukai T., Okamoto H. (2012). Molecular characterization of the subnuclei in rat habenula. J. Comp. Neurol. 520 4051–4066. 10.1002/cne.23167 - DOI - PubMed
    1. Aizawa H., Yanagihara S., Kobayashi M., Niisato K., Takekawa T., Harukuni R., et al. (2013b). The synchronous activity of lateral habenular neurons is essential for regulating hippocampal theta oscillation. J. Neurosci. 33 8909–8921. 10.1523/jneurosci.4369-12.2013 - DOI - PMC - PubMed
    1. Brown P. L., Palacorolla H., Brady D., Riegger K., Elmer G. I., Shepard P. D. (2017). Habenula-Induced inhibition of midbrain dopamine neurons is diminished by lesions of the rostromedial tegmental nucleus. J. Neurosci. 37 217–225. 10.1523/jneurosci.1353-16.2017 - DOI - PMC - PubMed
    1. Chastrette N., Pfaff D. W., Gibbs R. B. (1991). Effects of daytime and nighttime stress on Fos-like immunoreactivity in the paraventricular nucleus of the hypothalamus, the habenula, and the posterior paraventricular nucleus of the thalamus. Brain Res. 563 339–344. 10.1016/0006-8993(91)91559-j - DOI - PubMed

LinkOut - more resources