. 2021 Mar 4:12:567001.
doi: 10.3389/fphar.2021.567001. eCollection 2021.

The Effects of Bilirubin and Lumirubin on Metabolic and Oxidative Stress Markers

Affiliations

The Effects of Bilirubin and Lumirubin on Metabolic and Oxidative Stress Markers

Aleš Dvořák et al. Front Pharmacol. .

Abstract

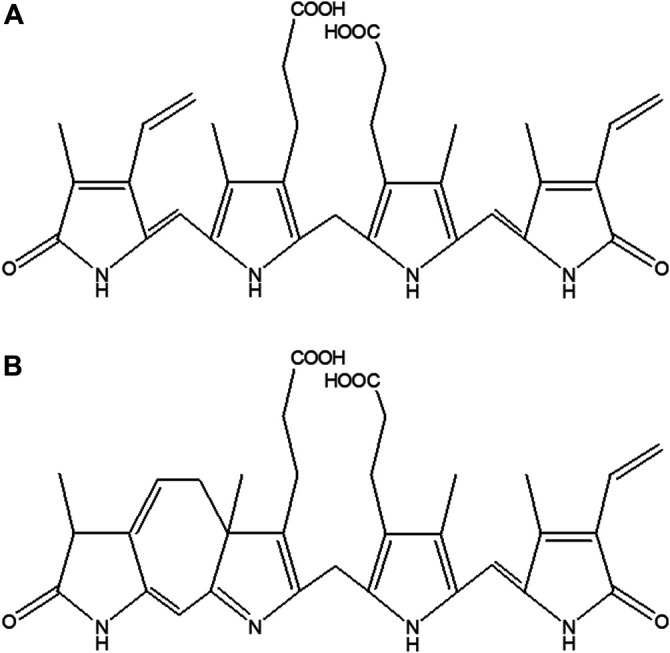
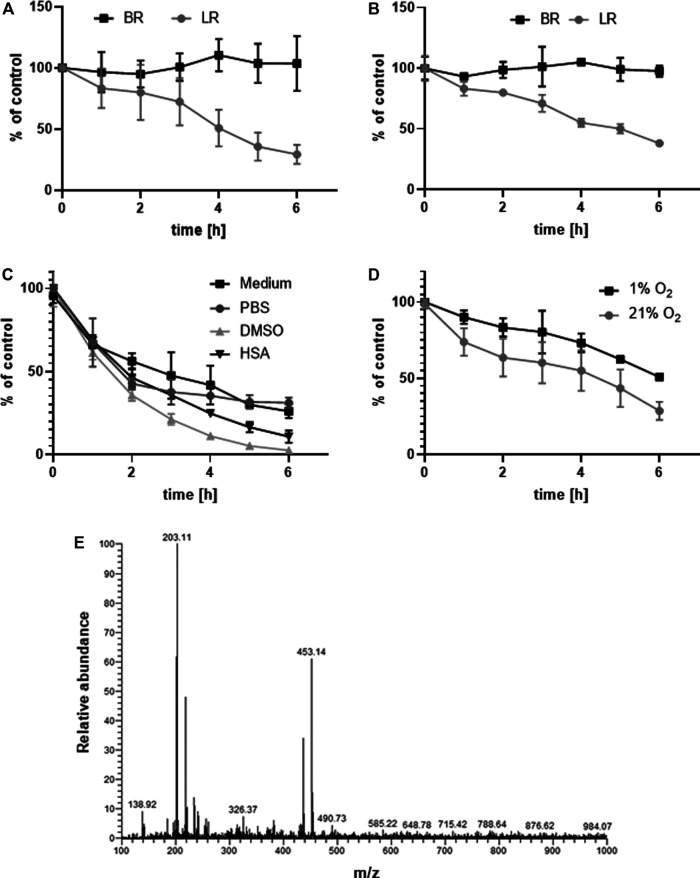
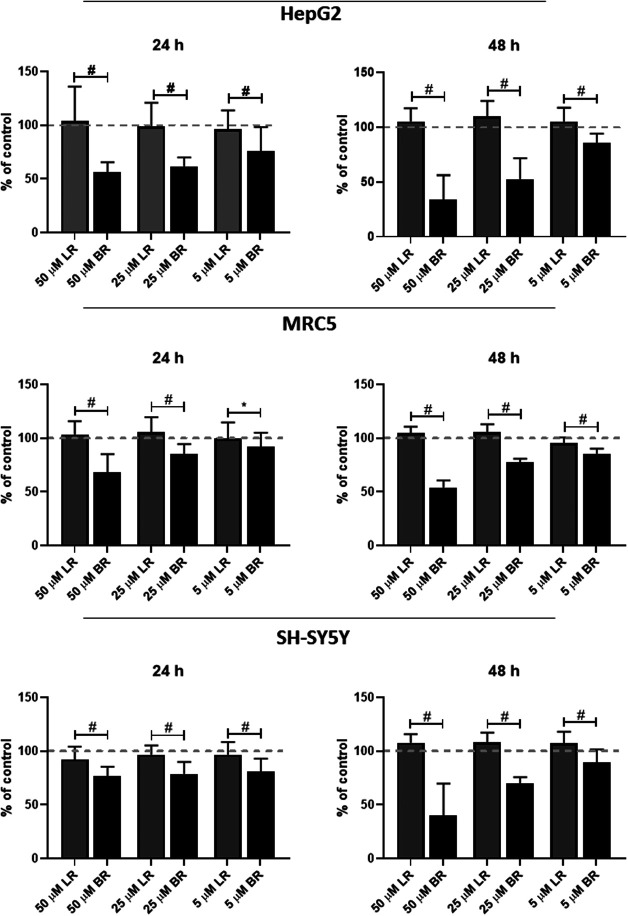
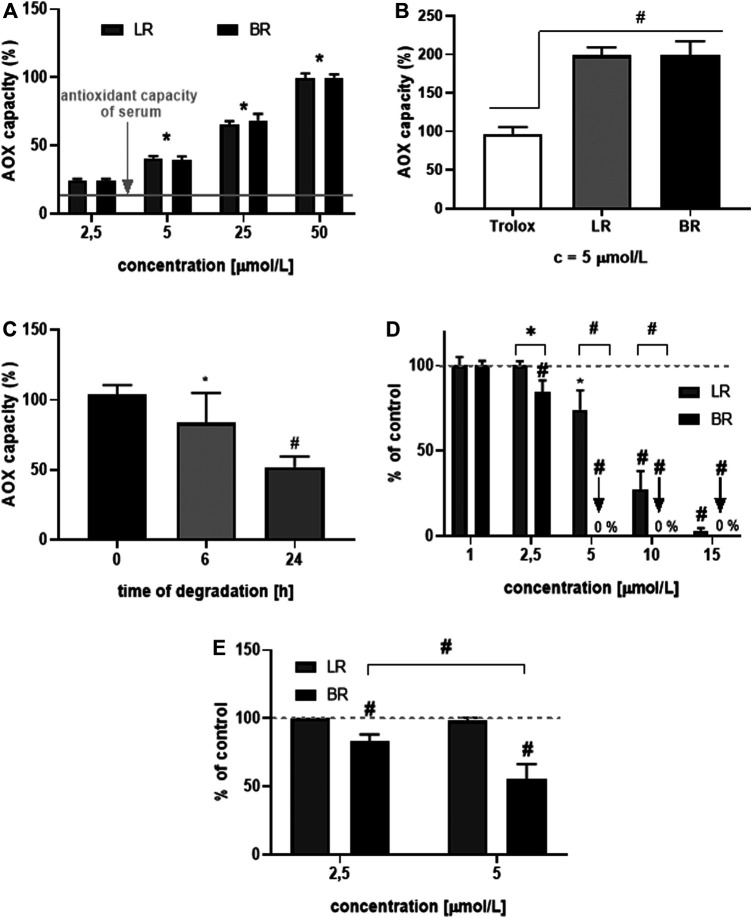
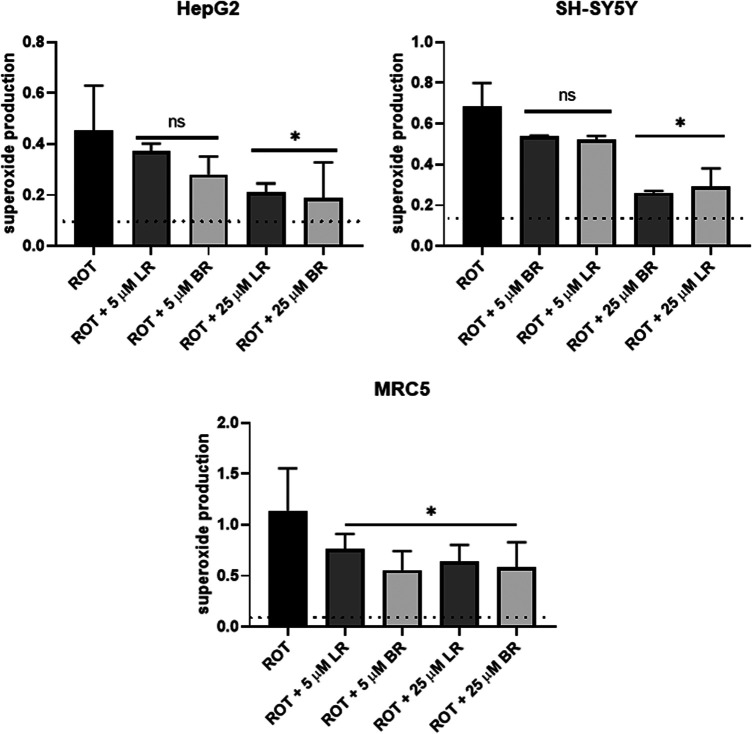
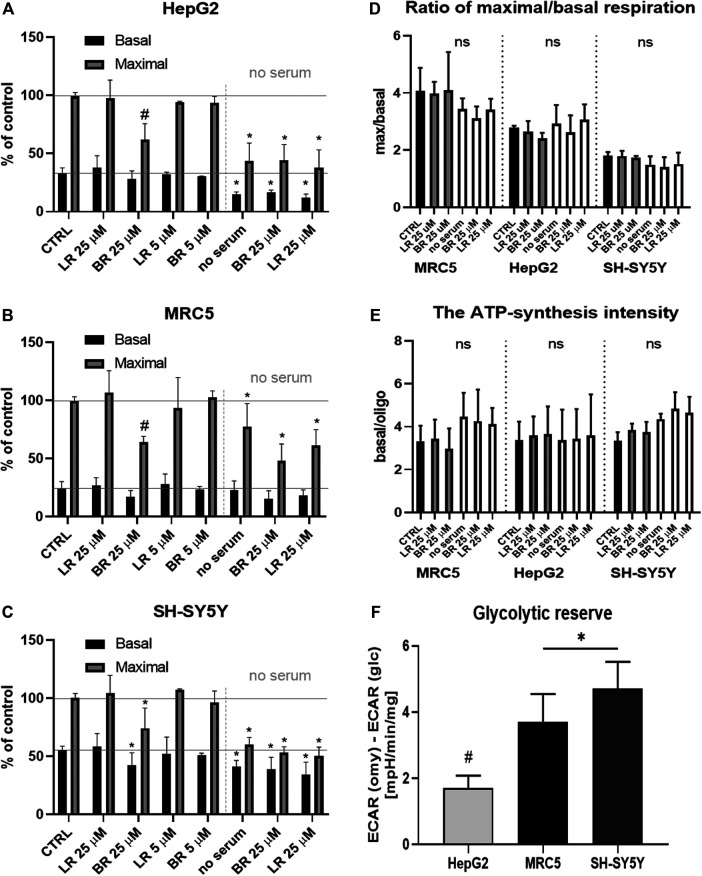
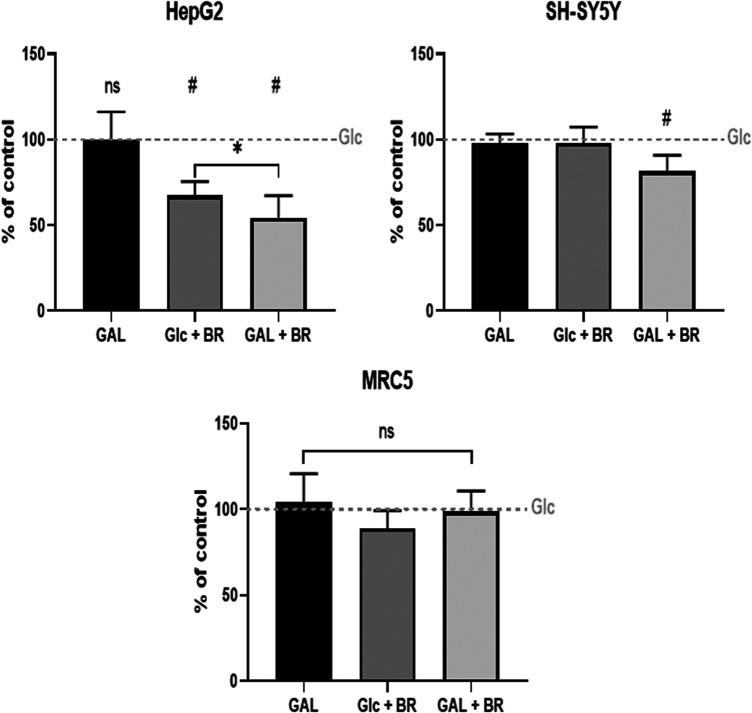
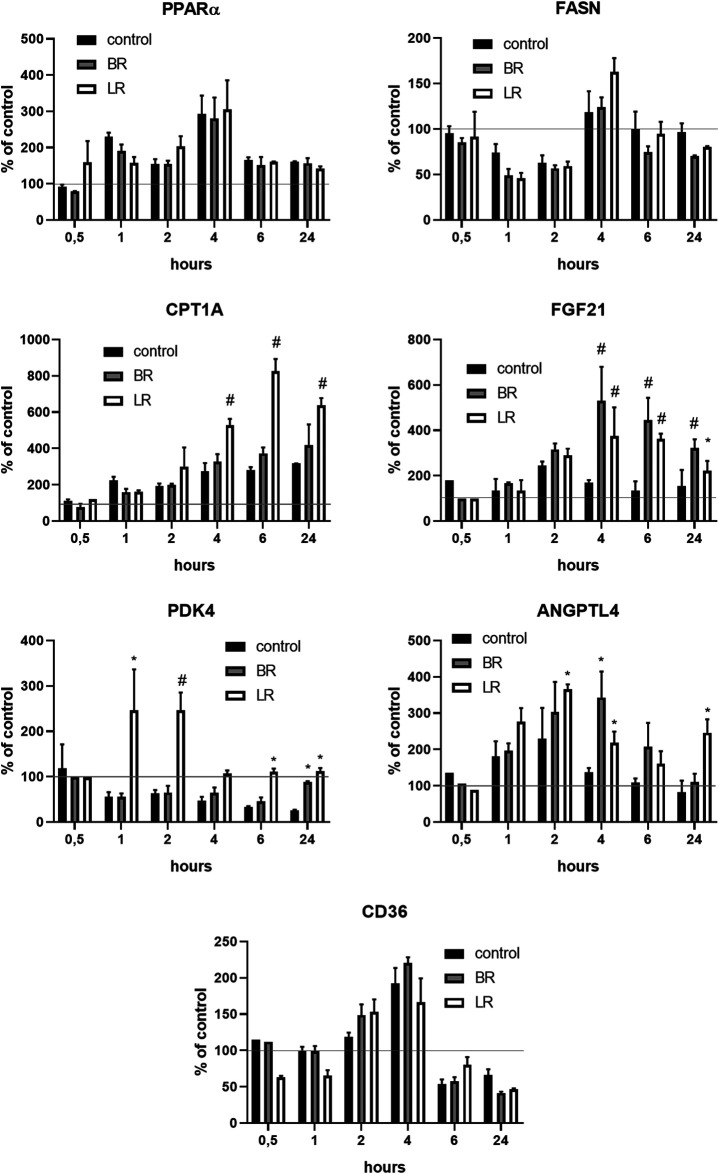
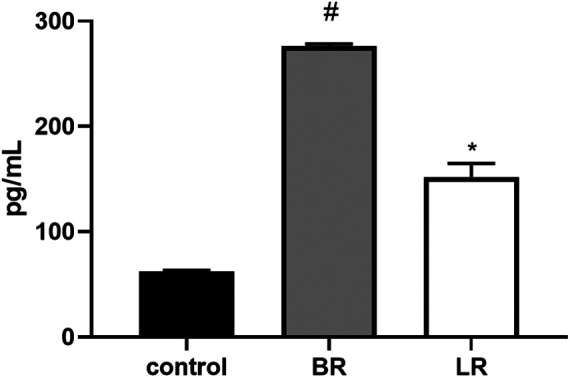
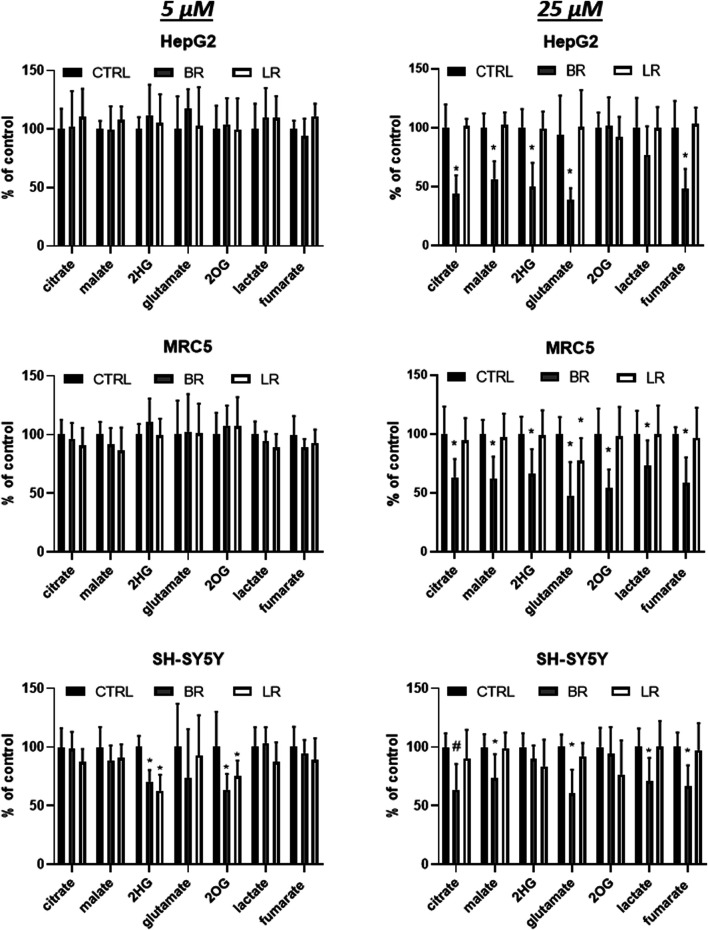
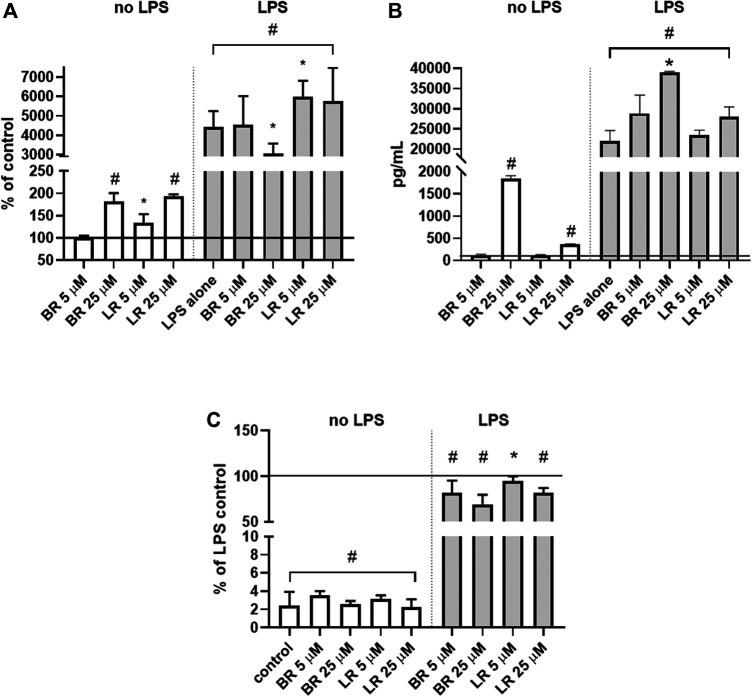
For severe unconjugated hyperbilirubinemia the gold standard treatment is phototherapy with blue-green light, producing more polar photo-oxidation products, believed to be non-toxic. The aim of the present study was to compare the effects of bilirubin (BR) and lumirubin (LR), the major BR photo-oxidation product, on metabolic and oxidative stress markers. The biological activities of these pigments were investigated on several human and murine cell lines, with the focus on mitochondrial respiration, substrate metabolism, reactive oxygen species production, and the overall effects on cell viability. Compared to BR, LR was found to be much less toxic, while still maintaining a similar antioxidant capacity in the serum as well as suppressing activity leading to mitochondrial superoxide production. Nevertheless, due to its lower lipophilicity, LR was less efficient in preventing lipoperoxidation. The cytotoxicity of BR was affected by the cellular glycolytic reserve, most compromised in human hepatoblastoma HepG2 cells. The observed effects were correlated with changes in the production of tricarboxylic acid cycle metabolites. Both BR and LR modulated expression of PPARα downstream effectors involved in lipid and glucose metabolism. Proinflammatory effects of BR, evidenced by increased expression of TNFα upon exposure to bacterial lipopolysaccharide, were observed in murine macrophage-like RAW 264.7 cells. Collectively, these data point to the biological effects of BR and its photo-oxidation products, which might have clinical relevance in phototherapy-treated hyperbilirubinemic neonates and adult patients.

Keywords: antioxidant; bilirubin; cell respiration; intracellular metabolite; lumirubin.


Conflict of interest statement

The authors declare that the research was conducted in the absence of any commercial or financial relationships that could be construed as a potential conflict of interest.

Figures

FIGURE 1
FIGURE 1
Structure of (A) BR, and (B) LR.
FIGURE 2
FIGURE 2
Stability of LR and BR. Stability of LR and BR (cLR/BR = 10 μmol/L) was determined during 6 h in: (A) MEM medium spiked with LR and BR (n = 9); (B) human serum spiked with LR and BR (n = 9); (C) different solubilization media spiked with LR (n = 9); (D) MEM medium spiked with LR under hypoxic and normoxic conditions (n = 9); (E) ionizable degradation products of LR screened after 24 h of normoxic incubation in PBS (n = 1). BR, bilirubin; LR, lumirubin.
FIGURE 3
FIGURE 3
The effect of LR and BR on cell viability. Viability of cells (MRC5, HepG2, SH-SY5Y cells) was measured after 24 (left column) and 48 h (right column) by MTT test after treatment with lumirubin (LR) and bilirubin (BR) in different concentrations (5, 25, and 50 μmol/L). #, p < 0.001; *, p < 0.05. n = 48 for each experiment.
FIGURE 4
FIGURE 4
Antioxidant potential of LR and BR in vitro. (A) antioxidant capacity (AOX) in human serum spiked with LR and BR (n = 15); (B) AOX of HSA spiked with Trolox, LR and BR (n = 15); (C) AOX of LR in HSA after its spontaneous degradation (initial LR concentration = 25 μmol/L) (n = 6); (D) lipoperoxidation (LPX) of brain tissue after addition of LR (dissolved in PBS) and BR (dissolved in DMSO) (n = 8); (E) LPX of brain tissue after addition of LR and BR dissolved in BSA (n = 8). *, p < 0.05; #, p < 0.001. LR, lumirubin; BR, bilirubin.
FIGURE 5
FIGURE 5
The effect of LR and BR on superoxide production. Superoxide production was determined by flow cytometry in live cells after overnight LR and BR treatment (5 and 25 μmol/L) from the detected slope. Rotenone (ROT) was used as a positive control of superoxide generation. Basal superoxide production (dashed lines) was detected in the cells without ROT treatment. *, p < 0.05; ns, not significant compared to ROT, n = 4 for each experiment CTRL, control cells without LR and BR treatment; BR, bilirubin; LR, lumirubin. Data expressed as the change in proportion of superoxide-producing cells upon various treatments.
FIGURE 6
FIGURE 6
The effect of LR and BR on mitochondrial respiration. (A–C) Mitochondrial respiration of cells (HepG2, MRC5, SH-SY5Y) treated for 24 h with different concentrations (5 and 25 μmol/L) of LR and BR. Basal (endogenous) and maximal respiration were measured under presence of serum as well as serum-free conditions (only 25 μmol/L concentrations of BR/LR); (D) Ratio of maximal to basal respiration. White columns represent serum-free conditions; (E) ATP-synthesis intensity. White columns represent serum-free conditions; (F) Glycolytic reserve of tested cells. ECAR, extracellular acidification rate. *, p < 0.05; #, p < 0.001, vs. control; ns, not significant. n = 4 for each experiment A-E, n = 8 for experiments F.
FIGURE 7
FIGURE 7
The effect of BR and LR on ATP production. Glc = glucose, 5 mmo/L; GAL = galactose, 5 mmol/L; BR = 25 μmol/L.
FIGURE 8
FIGURE 8
The effect of LR and BR on PPARα and its downstream effector gene expressions. The effect of LR and BR (25 μmol/L) on expression of PPARα and related genes involved in glucose and lipid metabolism was studied under serum-free conditions. The experiments were performed in 12-well plates; the medium was replaced by the fresh serum-free medium for 24 h, then BR, LR or solvent was added, and the cells were harvested after 0.5, 1, 2, 4, 6 and 24 h for gene expression analyses. FASN, gene coding for fatty acid synthase; CPT1, carnitine palmitoyltransferase 1; FGF21, fibroblast growth factor 21; PDK4, gene coding for mitochondrial pyruvate dehydrogenase lipoamide kinase isozyme 4; ANGPTL4, angiopoietin-like 4; CD36, cluster of differentiation 36, also known as platelet glycoprotein 4, fatty acid translocase, or scavenger receptor class B member 3. *, p < 0.05; #, p < 0.001, compared to control; N = 3.
FIGURE 9
FIGURE 9
The effect of LR and BR on FGF21 protein production. Concentrations of FGF21 were measured in culture media removed from the HepG2, incubated for 48 h in serum-free media with or without BR or LR. Due to increased toxicity of BR on HepG2 cells cultured in serum-free media, BR was used in lower concentrations (15 μmol/L), and the concentrations of FGF21 in media were related to g of the cell lysate protein. *, p < 0.05; #, p < 0.001, compared to control; n = 3.
FIGURE 10
FIGURE 10
The effect of LR and BR on production of intracellular metabolites of TCA cycle. Concentrations of metabolic intermediates were measured in cells (HepG2, MRC5, SH-SY5Y) treated for 24 h with LR and BR (5 and 25 μmol/L). *, p < 0.05; #, p < 0.001. 2HG, 2-hydroxyglutarate; 2OG, 2-oxoglutarate; CTRL, control cells. n = 9 for each experiment.
FIGURE 11
FIGURE 11
Anti-inflammatory effects of BR and LR in murine macrophage-like RAW 264.7 cells. (A) TNFα mRNA expression; (n = 6). (B) TNFα protein expression in culture media (n = 3). (C) NO production (n = 16). Murine macrophage-like RAW 264.7 cells exposed to LPS were treated for 24 h with different concentrations of LR and BR (LR/BR concentrations = 5 and 25 μmol/L). Horizontal line represents LPS control. *, p < 0.05; #, p < 0.001.

References

    1. Almeida M. A., Rezende L. (1981). The serum levels of unbound bilirubin that induce changes in some brain mitochondrial reactions in newborn guinea-pigs. Experientia 37, 807–809. 10.1007/BF01985651 - DOI - PubMed
    1. Arnold C., Pedroza C., Tyson J. E. (2014). Phototherapy in ELBW newborns: does it work? Is it safe? The evidence from randomized clinical trials. Semin. Perinatol. 38, 452–464. 10.1053/j.semperi.2014.08.008 - DOI - PubMed
    1. Auger N., Laverdiere C., Ayoub A., Lo E., Luu T. M. (2019). Neonatal phototherapy and future risk of childhood cancer. Int. J. Cancer 145, 2061–2069. 10.1002/ijc.32158 - DOI - PubMed
    1. Barone E., Trombino S., Cassano R., Sgambato A., De Paola B., Di Stasio E., et al. (2009). Characterization of the S-denitrosylating activity of bilirubin. J. Cell Mol. Med. 13, 2365–2375. 10.1111/j.1582-4934.2009.00680.x - DOI - PMC - PubMed
    1. Brand M. D., Nicholls D. G. (2011). Assessing mitochondrial dysfunction in cells. Biochem. J. 435, 297–312. 10.1042/BJ20110162 - DOI - PMC - PubMed

LinkOut - more resources