

Ectodysplasin A Is Increased in Non-Alcoholic Fatty Liver Disease, But Is Not Associated With Type 2 Diabetes
- PMID: 33746906
- PMCID: PMC7970300
- DOI: 10.3389/fendo.2021.642432
Ectodysplasin A Is Increased in Non-Alcoholic Fatty Liver Disease, But Is Not Associated With Type 2 Diabetes
Abstract
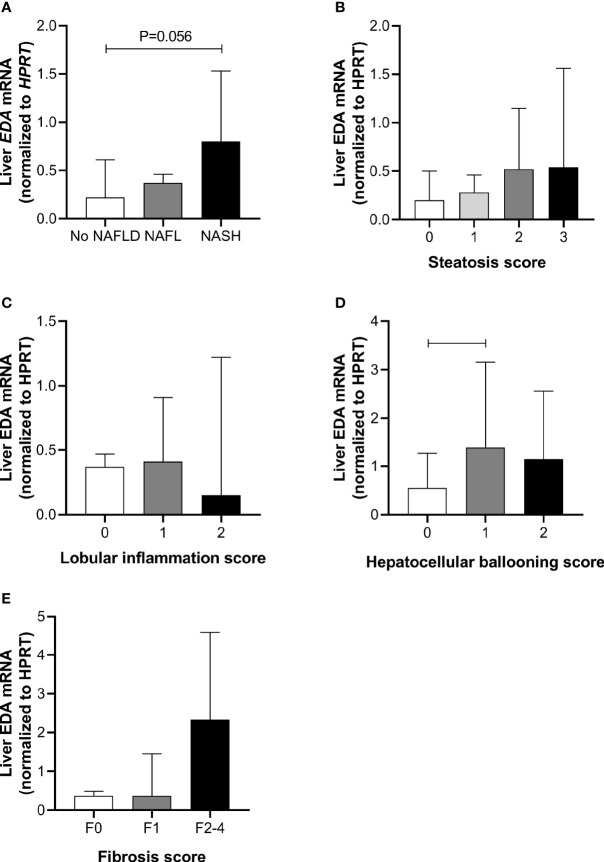
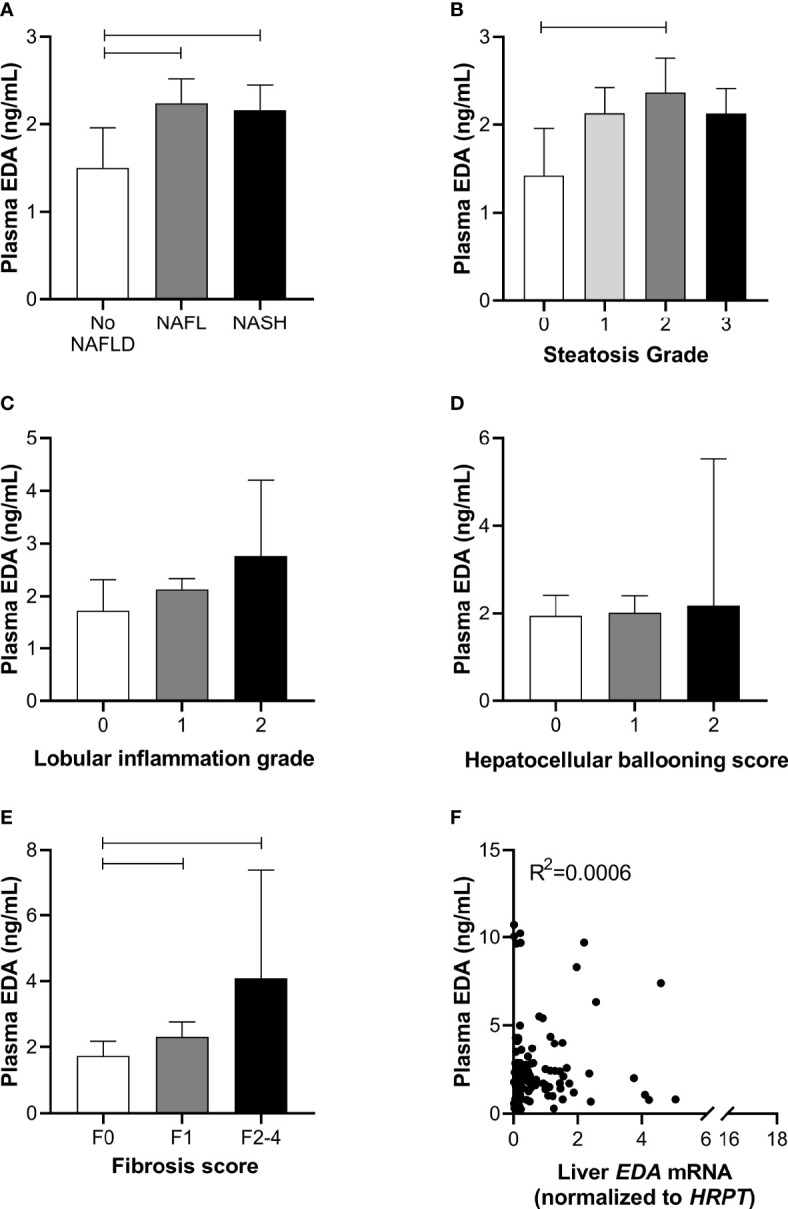
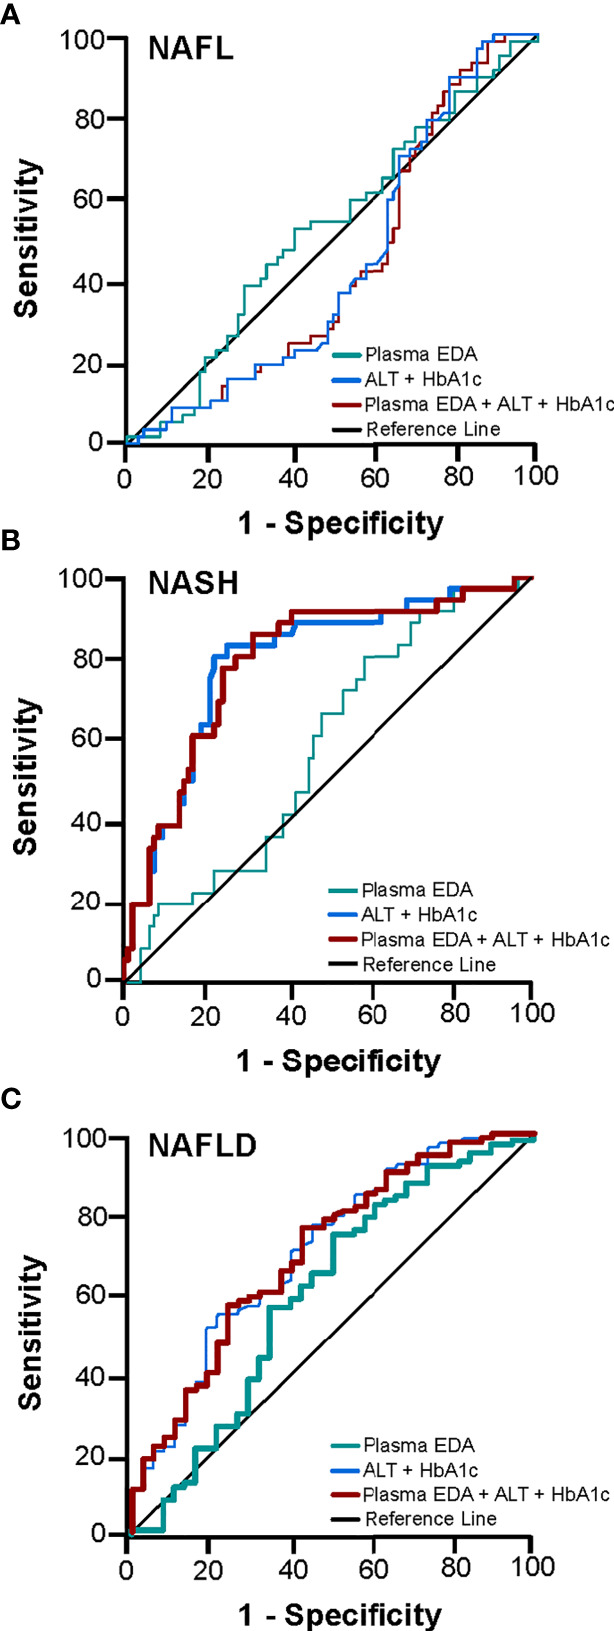
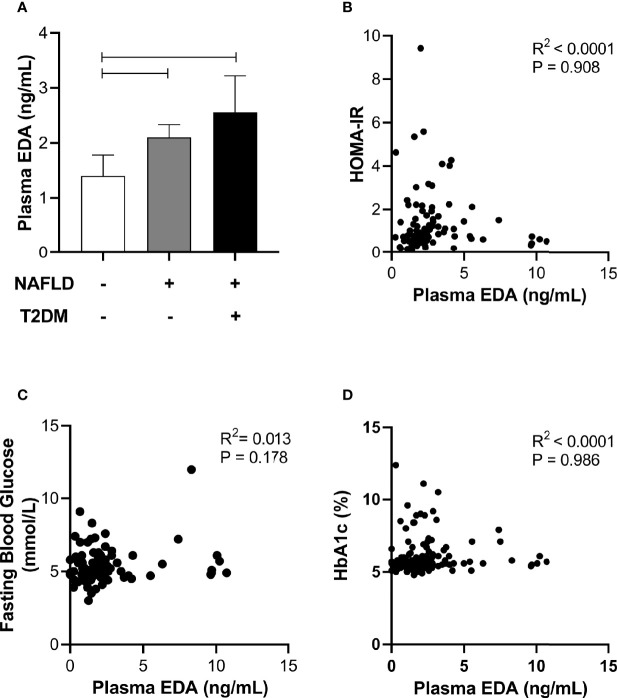
Ectodysplasin A (EDA) was recently identified as a liver-secreted protein that is increased in the liver and plasma of obese mice and causes skeletal muscle insulin resistance. We assessed if liver and plasma EDA is associated with worsening non-alcoholic fatty liver disease (NAFLD) in obese patients and evaluated plasma EDA as a biomarker for NAFLD. Using a cross-sectional study in a public hospital, patients with a body mass index >30 kg/m2 (n=152) underwent liver biopsy for histopathology assessment and fasting liver EDA mRNA. Fasting plasma EDA levels were also assessed. Non-alcoholic fatty liver (NAFL) was defined as >5% hepatic steatosis and nonalcoholic steatohepatitis (NASH) as NAFLD activity score ≥3. Patients were divided into three groups: No NAFLD (n=45); NAFL (n=65); and NASH (n=42). Liver EDA mRNA was increased in patients with NASH compared with No NAFLD (P=0.05), but not NAFL. Plasma EDA levels were increased in NAFL and NASH compared with No NAFLD (P=0.03). Plasma EDA was related to worsening steatosis (P=0.02) and fibrosis (P=0.04), but not inflammation or hepatocellular ballooning. ROC analysis indicates that plasma EDA is not a reliable biomarker for NAFL or NASH. Plasma EDA was not increased in patients with type 2 diabetes and did not correlate with insulin resistance. Together, we show that plasma EDA is increased in NAFL and NASH, is related to worsening steatosis and fibrosis but is not a reliable biomarker for NASH. Circulating EDA is not associated with insulin resistance in human obesity.
Clinical trial registration: https://www.anzctr.org.au/Trial/Registration/TrialReview.aspx?ACTRN=12615000875505, identifier ACTRN12615000875505.
Keywords: ectodysplasin A; hepatokine; insulin resistance; non-alcoholic fatty liver disease; type 2 diabetes (T2DM).
Copyright © 2021 Bayliss, Ooi, De Nardo, Shah, Montgomery, McLean, Kemp, Roberts, Brown, Burton and Watt.
Conflict of interest statement
MW has received consultancy fees from Gilead Science, Inc. WB has received grants from Johnson and Johnson, Medtronic, GORE, Applied Medical, and Novo Nordisk, and personal fees from GORE, Novo Nordisk, and Merck Sharpe and Dohme for lectures and advisory boards. All were outside the submitted work. The remaining authors declare that the research was conducted in the absence of any commercial or financial relationships that could be construed as a potential conflict of interest.
Figures
References
-
- Younossi ZM, Stepanova M, Afendy M, Fang Y, Younossi Y, Mir H, et al. Changes in the prevalence of the most common causes of chronic liver diseases in the United States from 1988 to 2008. Clin Gastroenterol Hepatol Off Clin Pract J Am Gastroenterol Assoc (2011) 9(6):524–30.e1; quiz e60. 10.1016/j.cgh.2011.03.020 - DOI - PubMed
-
- Ooi GJ, Burton PR, Bayliss J, Raajendiran A, Earnest A, Laurie C, et al. Effect of Body Mass Index, Metabolic Health and Adipose Tissue Inflammation on the Severity of Non-alcoholic Fatty Liver Disease in Bariatric Surgical Patients: a Prospective Study. Obes Surg (2019) 29(1):99–108. 10.1007/s11695-018-3479-2 - DOI - PubMed
-
- Ryysy L, Hakkinen AM, Goto T, Vehkavaara S, Westerbacka J, Halavaara J, et al. Hepatic fat content and insulin action on free fatty acids and glucose metabolism rather than insulin absorption are associated with insulin requirements during insulin therapy in type 2 diabetic patients. Diabetes (2000) 49(5):749–58. 10.2337/diabetes.49.5.749 - DOI - PubMed
Publication types
MeSH terms
Substances
LinkOut - more resources
Full Text Sources
Other Literature Sources
Medical