. 2021 May;21(5):342.
doi: 10.3892/ol.2021.12603. Epub 2021 Mar 2.

EZH2 and SMYD3 expression in papillary thyroid cancer

Affiliations

EZH2 and SMYD3 expression in papillary thyroid cancer

Nadia Sawicka-Gutaj et al. Oncol Lett. 2021 May.

Abstract

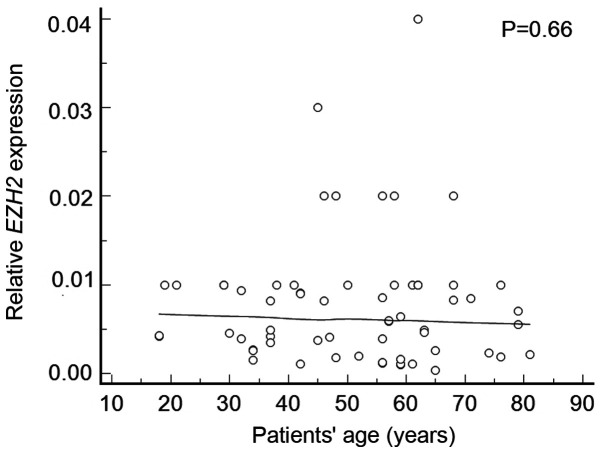
Recent studies have revealed the significant role of SMYD3 and EZH2 genes in the development and aggressiveness of numerous types of malignant tumor. Therefore, the present study aimed to investigate the expression of SMYD3 and EZH2 in papillary thyroid cancer, and to determine the correlation between the expression of these genes and clinical characteristics. Resected thyroid tissue samples from 62 patients with papillary thyroid cancer were investigated. Thyroid tissue derived from the healthy regions of removed nodular goiters from 30 patients served as the control group. Reverse transcription-quantitative PCR analysis was employed to detect relative mRNA expression levels. Primer sequences and TaqMan® hydrolysis probe positions for EZH2 and SMYD3 were determined using the Roche Universal ProbeLibrary Assay Design Center version 2.50. EZH2 expression was detected in all thyroid cancer samples and in 83.3% of benign lesions. Notably, EZH2 was revealed to be upregulated in thyroid cancer tissues compared with control tissues (P=0.0002). EZH2 expression was positively correlated with tumor stage (P<0.0001; r=0.504), and multiple comparison analysis revealed that the highest expression of EZH2 was detected in samples staged pT4 (P=0.0001). SMYD3 expression was detected in all thyroid cancer samples and in 96.7% of healthy thyroid tissues; notably, the expression levels were similar in both groups. In addition, there was no correlation between SMYD3 expression and the aggressiveness of papillary thyroid cancer. In conclusion, overexpression of the EZH2 gene may be associated with the development of papillary thyroid cancer and EZH2 may be a potential therapeutic target in papillary thyroid cancer.

Keywords: EZH2; SMYD3; overexpression; papillary thyroid cancer; progression; reverse transcription-quantitative PCR; tumor stage.


Conflict of interest statement

The authors declare that they have no competing interests.

Figures

Figure 1.
Figure 1.
Amplicons of analyzed genes (A) EZH2 and (B) SMYD3 with the primers, TaqMan® Probes and introns positions. Trade secrets protect hypoxanthine-guanine phosphoribosyltransferase (reference) probe assays. Black boxes represent the primers position, the dark-gray box with the number represent probe positions and their Roche Universal ProbeLibrary numbers. The numbers in the brackets represent introns and their lengths. Numbers at the beginning and end represent amplicon positioning relative to the basic mRNA sequence.
Figure 2.
Figure 2.
Comparison of relative EZH2 gene expression in thyroid cancers and healthy controls.
Figure 3.
Figure 3.
Correlation between EZH2 expression and tumor staging.
Figure 4.
Figure 4.
Comparison of relative EZH2 gene expression in tumors staged pT1, pT2, pT3 or pT4. Values from the lower to the upper quartile are represented by the central box, while the middle line shows the median. The thin vertical lines extending up or down from the boxes to the horizontal lines extend to a multiple of 1.5× the distance of the upper and lower quartile, respectively. Outliers are any values beyond the whiskers. *P≤0.05.
Figure 5.
Figure 5.
Comparison between relative EZH2 expression in patients with lymph nodes involvement and without.
Figure 6.
Figure 6.
Correlation between relative EZH2 gene expression and patients' age.
Figure 7.
Figure 7.
Comparison of SMYD3 gene expression between thyroid cancers and controls.
Figure 8.
Figure 8.
Comparison of relative SMYD3 gene expression in tumors staged pT1, pT2, pT3 or pT4. Values from the lower to the upper quartile are represented by the central box, while the middle line shows the median. The thin vertical lines extending up or down from the boxes to the horizontal lines extend to a multiple of 1.5× the distance of the upper and lower quartile, respectively. Outliers are any values beyond the whiskers.
Figure 9.
Figure 9.
Comparison between relative SMYD3 expression in patients with lymph nodes involvement and without.

References

    1. Zou JN, Wang SZ, Yang JS, Luo XG, Xie JH, Xi T. Knockdown of SMYD3 by RNA interference down-regulates c-Met expression and inhibits cells migration and invasion induced by HGF. Cancer Lett. 2009;280:78–85. doi: 10.1016/j.canlet.2009.02.015. - DOI - PubMed
    1. Kouzarides T. Chromatin modifications and their function. Cell. 2007;128:693–705. doi: 10.1016/j.cell.2007.02.005. - DOI - PubMed
    1. Giakountis A, Moulos P, Sarris ME, Hatzis P, Talianidis I. Smyd3-associated regulatory pathways in cancer. Semin Cancer Biol. 2017;42:70–80. doi: 10.1016/j.semcancer.2016.08.008. - DOI - PubMed
    1. Varier RA, Timmers HT. Histone lysine methylation and demethylation pathways in cancer. Biochim Biophys Acta. 2011;1815:75–89. - PubMed
    1. Spellmon N, Holcomb J, Trescott L, Sirinupong N, Yang Z. Structure and function of SET and MYND domain-containing proteins. Int J Mol Sci. 2015;16:1406–1428. doi: 10.3390/ijms16011406. - DOI - PMC - PubMed