. 2021 Jan 31;8(6):2004010.
doi: 10.1002/advs.202004010. eCollection 2021 Mar.

Magneto-Based Synergetic Therapy for Implant-Associated Infections via Biofilm Disruption and Innate Immunity Regulation

Affiliations

Magneto-Based Synergetic Therapy for Implant-Associated Infections via Biofilm Disruption and Innate Immunity Regulation

Jiaxing Wang et al. Adv Sci (Weinh). .

Abstract

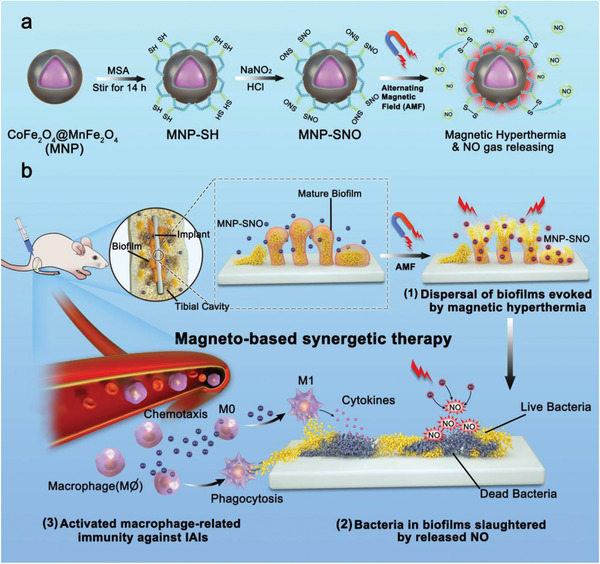
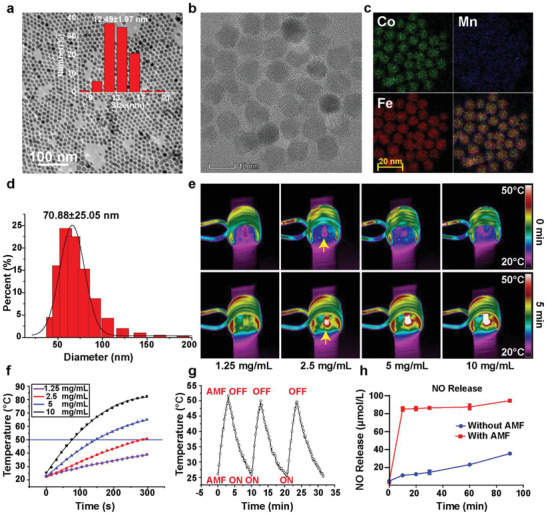
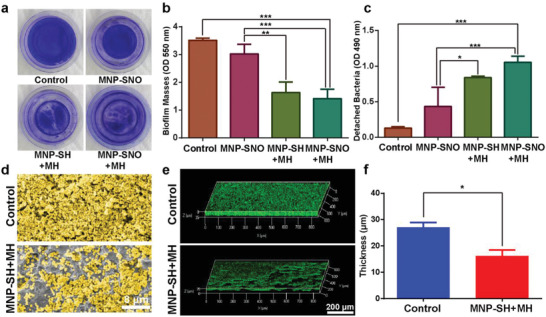
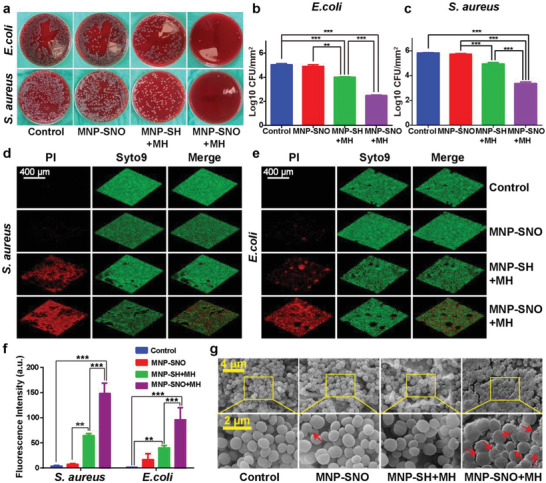
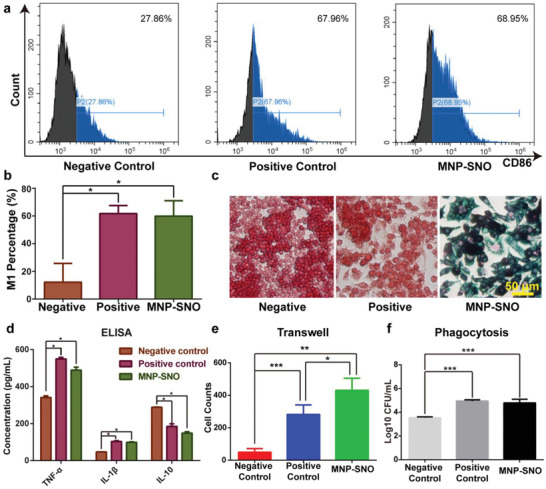
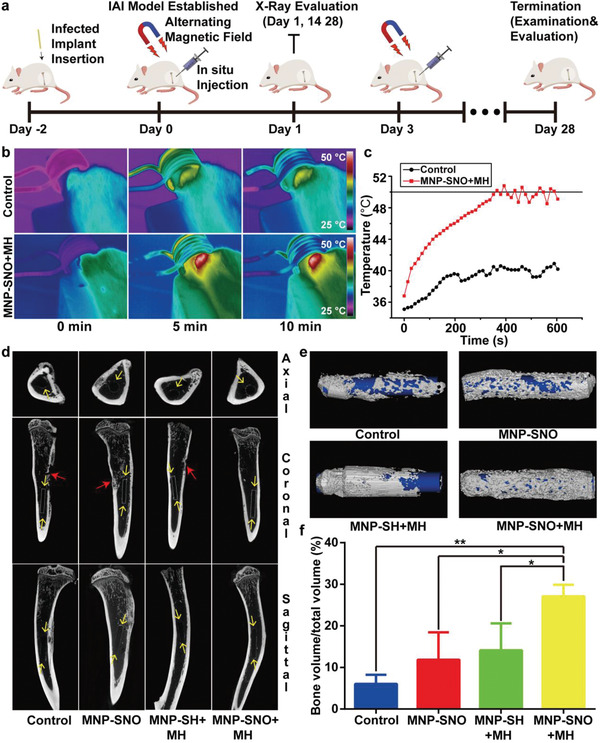
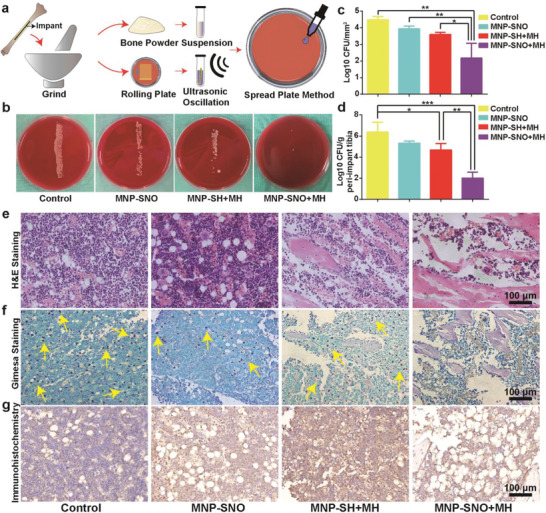
Implant-associated infections (IAIs) are a common cause of orthopedic surgery failure due to microbial biofilm-induced antibiotic-resistance and innate immune inactivation. Thus, the destruction of microbial biofilm plays a key role in reducing IAIs. Herein, first, a magneto-based synergetic therapy (MST) is proposed and demonstrated against IAIs based on biofilm destruction. Under an alternating magnetic field (AMF), CoFe2O4@MnFe2O4 nanoparticles (MNPs), with a rather strong magnetic hyperthermal capacity, can generate sufficient thermal effect to cause dense biofilm dispersal. Loosened biofilms provide channels through which nitrosothiol-coated MNPs (MNP-SNOs) can penetrate. Subsequently, thermosensitive nitrosothiols rapidly release nitric oxide (NO) inside biofilms, thus efficiently killing sessile bacteria under the magnetothermal effect of MNPs. More importantly, MNP-SNOs can trigger macrophage-related immunity to prevent the relapse of IAIs by exposing the infected foci to a consistent innate immunomodulatory effect. The notable anti-infection effect of this nanoplatform is also confirmed in a rat IAI model. This work presents the promising potential of combining magnetothermal therapy with immunotherapy, for the effective and durable control and elimination of IAIs.

Keywords: immunotherapy; implant‐associated infections; magnetic nanoparticles; magneto‐based synergetic therapy; nitric oxide.


Conflict of interest statement

The authors declare no conflict of interest.

Figures

Scheme 1
Scheme 1
Schematic illustration of the synthesis of MNP‐SNOs and its in vivo magneto‐based synergetic therapy. a) Schematics illustrating the ligand exchange and nitrosation procedures of magnetic nanoparticles (CoFe2O4@MnFe2O4), and the concurrent magnetic hyperthermia/NO gas production under the applied alternating magnetic field (AMF). b) Schematics illustrating a rat tibia with infected implant under the treatments by MNP‐SNOs under AMF. 1) The mature and compact biofilms are fragmentized under magnetic hyperthermia by MNP‐SNOs, and 2) the abundant NO released from MNP‐SNOs in a hyperthermal environment is lethal to sessile bacteria inside biofilms. The MNP‐SNOs also act as chemokines and immunoregulators to direct macrophages to the infection focus and evoke M1 polarization of macrophages. 3) The surviving bacteria are mostly killed by phagocytosis and cytokine secretion of M1 macrophages.
Figure 1
Figure 1
Characterization and property of MNP‐SNOs. a) Low‐resolution TEM image of CoFe2O4@MnFe2O4 nanoparticles (scale bar: 50 nm) and b) the enlarged image (scale bar: 10 nm). c) EDS mapping images of the MNPs. d) Particle size distribution curve of MNP‐SNOs suspended in water by DLS technique. e) Thermal images of MNP‐SNO solutions at varied concentrations under 1.35 kA m−1 AMF and f) the corresponding temperature–time curves. The yellow arrows in (e) point the background‐color area of MNP‐SNO (2.5 mg mL−1) before and after AMF application. g) Cyclic temperature–time curve of MNP‐SNO solution under AMF. h) NO gas release profiles of MNP‐SNOs with or without the magnetic hyperthermia stimulation.
Figure 2
Figure 2
Biofilm disruption by magnetic hyperthermia. a) Macroscopic biofilm images of control (treated with saline), MNP‐SNO, MNP‐SH + MH (treated with 1.35 kA m−1 AMF for 10 min), and MNP‐SNO + MH (treated with 1.35 kA m−1 AMF and NO release for 10 min) groups; the bacteria were stained with crystal violet. b) Absorbance of biofilm masses at wavelength of 550 nm (n = 3, ** P < 0.01 and *** P < 0.001 using one‐way analysis of variance (ANOVA)). c) Absorbance of detached bacteria from biofilms at wavelength of 490 nm (n = 3, * P < 0.05 and *** P < 0.001 using one‐way ANOVA). d) SEM images of biofilms from control and MNP‐SH + MH groups (scale bar: 8 µm). e) 3D‐reconstructed biofilms from the fluorescence images in Z‐stack in control and MNP‐SH + MH groups (scale bar: 200 µm). f) Quantification of 3D‐reconstructed biofilm thicknesses of control and MNP‐SH + MH groups as analyzed by ImageJ (n = 3, * P < 0.05 using the Student's t‐test).
Figure 3
Figure 3
In vitro antibacterial assay of MH and NO therapies. a) Typical photos of E. coli and S. aureus biofilms treated with saline (control), MNP‐SNO, MNP‐SH + MH, and MNP‐SNO + MH groups (dilution rate: 1:10 000 for E. coli; 1:100 000 for S. aureus). Counting results of b) E. coli and c) S. aureus in four groups by a spread plate method (SPM) (n = 3, ** P < 0.01 and *** P < 0.001 using one‐way ANOVA). 3D‐reconstructions of the fluorescence labeled biofilms of d) S. aureus and e) E. coli, including PI signal (dead bacteria), Syto9 signal (all bacteria), and merged pictures (scale bar: 400 µm). f) Fluorescence intensity of red stained biofilms (dead bacteria) in four groups as analyzed by ImageJ (n = 3, ** P < 0.01 and *** P < 0.001 using one‐way ANOVA, Tukey's multiple comparisons test). g) High‐resolution SEM images of S. aureus biofilms attached on PEEK disks treated in different groups; the red arrows point out the distorted bacteria (scale bar: 4 and 2 µm).
Figure 4
Figure 4
In vitro immunomodulation assay of magnetic nanoparticles. a) Flow cytometry results of RAW264.7 (CD86 is the marker for M1) from negative control (treated with 20 µL PBS for 24 h), positive control (treated with 10 µg L−1 LPS for 24 h), and MNP‐SNO (treated with 2.5 mg mL−1 MNP‐SNO for 24 h) groups, and b) the quantitative analysis of M1 macrophage percentage in three groups (n = 3, * P < 0.05 using one‐way ANOVA). c) Perl's blue staining images of RAW264.7 cells cocultured with PBS, LPS, or MNP‐SNO. The nuclei of macrophages were stained in red, and the iron element in cells was stained with Perl's blue (scale bar: 50 µm). d) ELISA results of cytokines (TNF‐α, IL‐1β, and IL‐10) secreted by RAW264.7 in different groups (n = 3, * P < 0.05 using one‐way ANOVA). e) Cell counts of the migrated RAW264.7 cultured on transwells (n = 3, * P < 0.05, ** P < 0.01, and *** P < 0.001 using one‐way ANOVA, Tukey's multiple comparisons test). f) Counted results of phagocytized S. aureus by RAW264.7 treated in different conditions (n = 3, *** P < 0.001 using one‐way ANOVA).
Figure 5
Figure 5
In vivo treatments and radiological evaluation. a) Scheme of deep IAI model establishment and subsequent treatment, examination, and evaluation at different time points. b) Thermal images of the control (injected with saline) and MNP‐SNO + MH groups under AMF for 10 min in vivo, and c) the corresponding temperature–time curve. d) Micro‐CT images of the tibias from four groups (control, MNP‐SNO, MNP‐SH + MH, and MNP‐SNO + MH). The red arrows indicate the infected dead bones, and the yellow arrows point the implant and new bones. e) 3D reconstructions of new bones and implants in different groups. The white masses indicate the new bone, and the blue rods represent implants. f) Quantitative analysis of bone mass in four groups (n = 3, * P < 0.05 and ** P < 0.01 using one‐way ANOVA, Tukey's multiple comparisons test).
Figure 6
Figure 6
In vivo anti‐infection and immunoregulation evaluations. a) The processing scheme of tibias and implants from IAI rats. b) The bacterial colonies of roll‐over cultures from explanted PEEK rods when the in vivo experiment was terminated. c,d) Quantitatively analyzed SPM results of biofilms detached from implants and resident bacteria in surrounding tissues in different treated groups (control group: treated with saline). H&E and Giemsa staining images of tibias from different groups showing e) the degree of inflammation infiltration and f) the amounts of pathogens. Yellow arrows in (f) point the stained bacteria or their cluster (scale bar: 100 µm). g) Immunohistochemical images of tibias stained with iNOS antibody, with the stained areas being in brown (n = 3, * P < 0.05, ** P < 0.01, and *** P < 0.001 using one‐way ANOVA).

References

    1. Zimmerli W., Trampuz A., Ochsner P. E., N. Engl. J. Med. 2004, 351, 1645. - PubMed
    1. Joo H., Otto M., Chem. Biol. 2012, 19, 1503. - PMC - PubMed
    1. Thurlow L. R., Hanke M. L., Fritz T., Angle A., Aldrich A., Williams S. H., Engebretsen I. L., Bayles K. W., Horswill A. R., Kielian T., J. Immunol. 2011, 186, 6585. - PMC - PubMed
    1. Costerton J. W., Science 1999, 284, 1318. - PubMed
    1. Arciola C. R., Campoccia D., Montanaro L., Nat. Rev. Microbiol. 2018, 16, 397. - PubMed

LinkOut - more resources