

Characterization of Tumor Microenvironment in Lung Adenocarcinoma Identifies Immune Signatures to Predict Clinical Outcomes and Therapeutic Responses
- PMID: 33747907
- PMCID: PMC7973234
- DOI: 10.3389/fonc.2021.581030
Characterization of Tumor Microenvironment in Lung Adenocarcinoma Identifies Immune Signatures to Predict Clinical Outcomes and Therapeutic Responses
Abstract
Background and objective: Increasing evidence has elucidated the clinicopathological significance of individual TME component in predicting outcomes and immunotherapeutic efficacy in lung adenocarcinoma (LUAD). Therefore, we aimed to investigate whether comprehensive TME-based signatures could predict patient survival and therapeutic responses in LUAD, and to assess the associations among TME signatures, single nucleotide variations and clinicopathological characteristics.
Methods: In this study, we comprehensively estimated the TME infiltration patterns of 493 LUAD patients and systematically correlated the TME phenotypes with genomic characteristics and clinicopathological features of LUADs using two proposed computational algorithms. A TMEscore was then developed based on the TME signature genes, and its prognostic value was validated in different datasets. Bioinformatics analysis was used to evaluate the efficacy of the TMEscore in predicting responses to immunotherapy and chemotherapy.
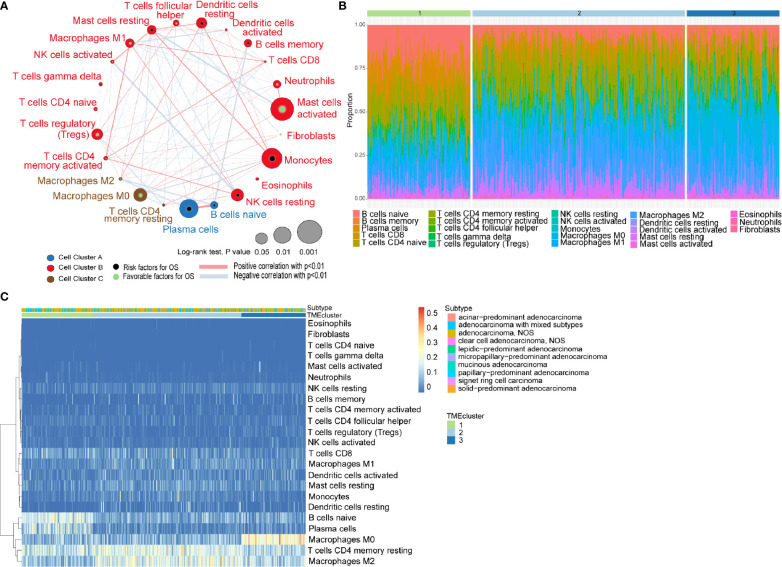
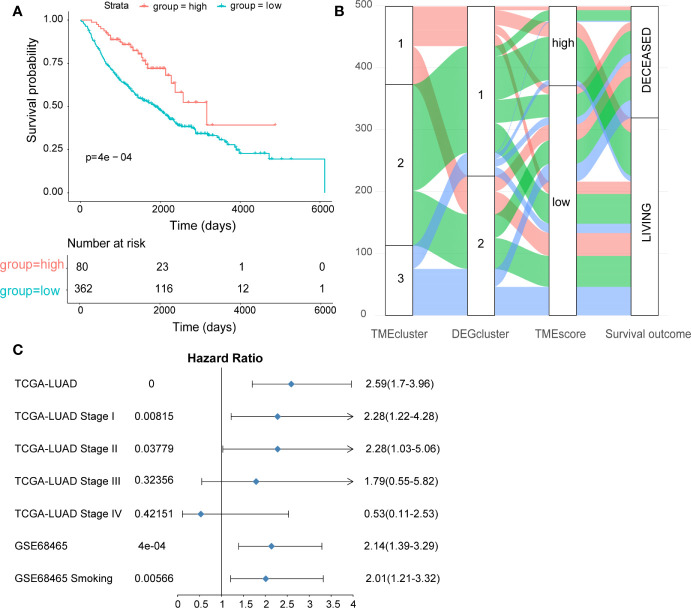
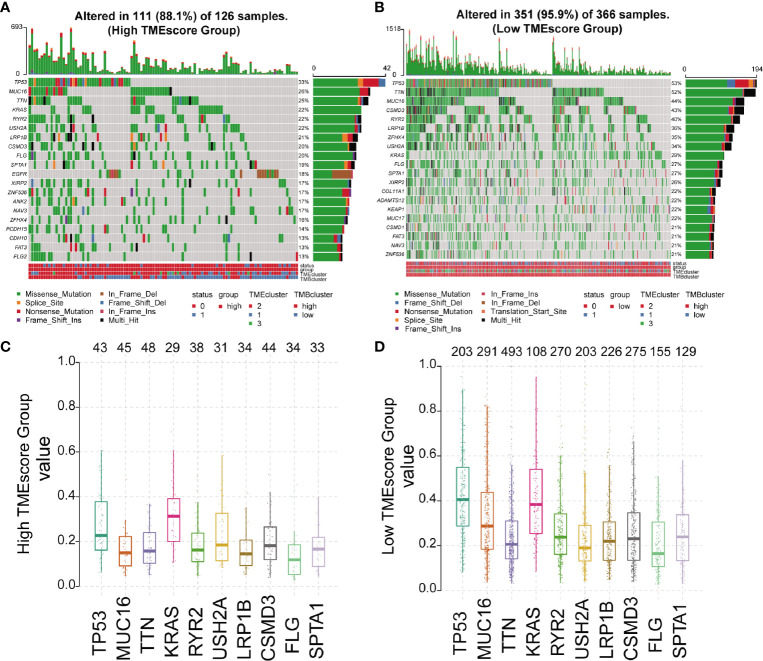
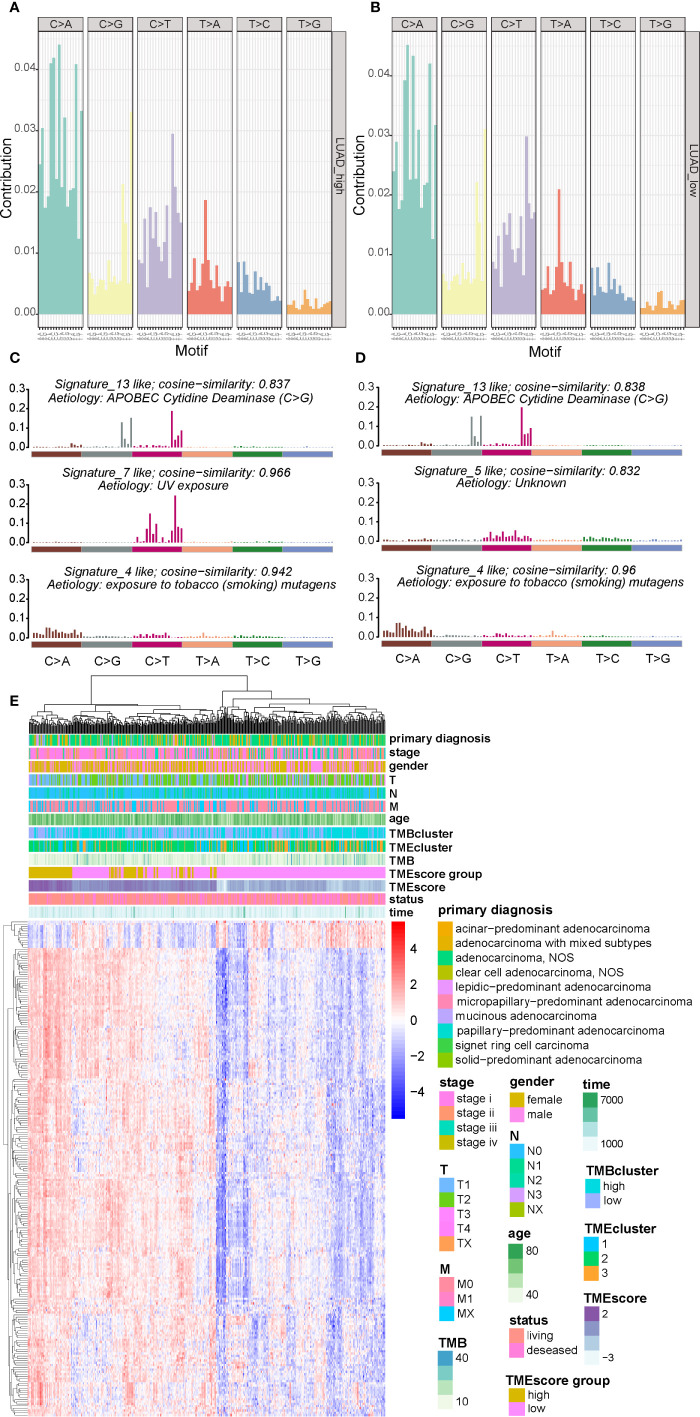
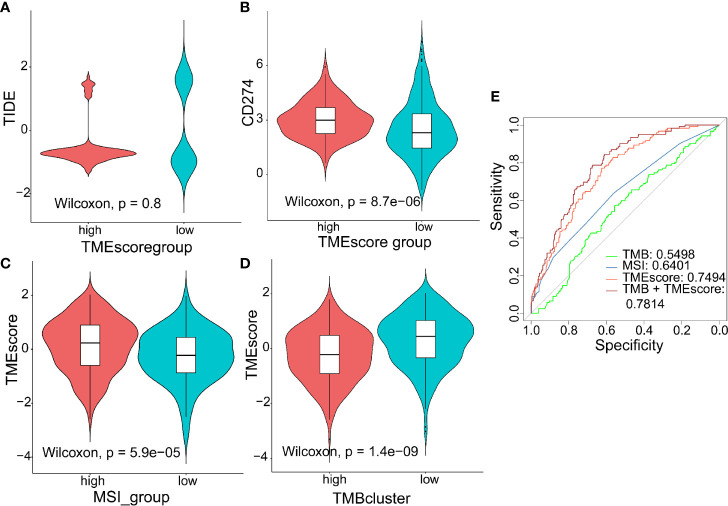
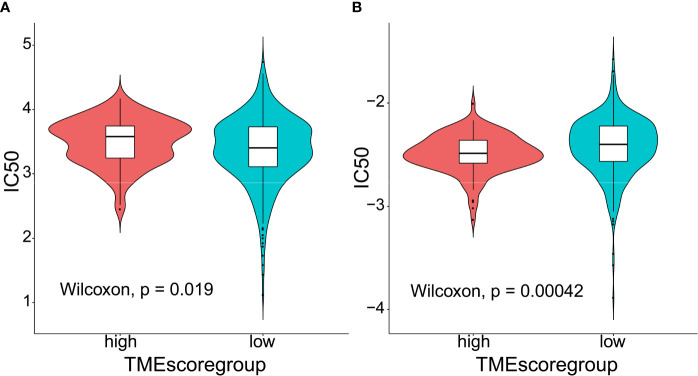
Results: Three TME subtypes were identified with no prognostic significance exhibited. Among them, naïve B cells accounted for the majority in TMEcluster1, while M2 TAMs and M0 TAMs took the largest proportion in TMEcluster2 and TMEcluster3, respectively. A total of 3395 DEGs among the three TME clusters were determined, among which 217 TME signature genes were identified. Interestingly, these signature genes were mainly involved in T cell activation, lymphocyte proliferation and mononuclear cell proliferation. With somatic variations and tumor mutation burden (TMB) of the LUAD samples characterized, a genomic landscape of the LUADs was thereby established to visualize the relationships among the TMEscore, mutation spectra and clinicopathological profiles. In addition, the TMEscore was identified as not only a prognosticator for long-term survival in different datasets, but also a predictive biomarker for the responses to immune checkpoint blockade (ICB) and chemotherapeutic agents. Furthermore, the TMEscore exhibited greater accuracy than other conventional biomarkers including TMB and microsatellite instability in predicting immunotherapeutic response (p < 0.001).
Conclusion: In conclusion, our present study depicted a comprehensive landscape of the TME signatures in LUADs. Meanwhile, the TMEscore was proved to be a promising predictor of patient survival and therapeutic responses in LUADs, which might be helpful to the future administration of personalized adjuvant therapy.
Keywords: lung adenocarcinoma; signature; survival; therapeutic response; tumor microenvironment.
Copyright © 2021 Chen, Wang, Zhang, Ding, Wang, Xue, Wang, Mao, Chen and Chen.
Conflict of interest statement
The authors declare that the research was conducted in the absence of any commercial or financial relationships that could be construed as a potential conflict of interest.
Figures
Similar articles
-
Tumor microenvironment characterization in colorectal cancer to identify prognostic and immunotherapy genes signature.BMC Cancer. 2023 Aug 18;23(1):773. doi: 10.1186/s12885-023-11277-4. BMC Cancer. 2023. PMID: 37596528 Free PMC article.
-
Characterization of the Immune Cell Infiltration Landscape Uncovers Prognostic and Immunogenic Characteristics in Lung Adenocarcinoma.Front Genet. 2022 May 23;13:902577. doi: 10.3389/fgene.2022.902577. eCollection 2022. Front Genet. 2022. PMID: 35677561 Free PMC article.
-
Comprehensive Genomic Characterization of Tumor Microenvironment and Relevant Signature in Clear Cell Renal Cell Carcinoma.Front Oncol. 2022 May 16;12:749119. doi: 10.3389/fonc.2022.749119. eCollection 2022. Front Oncol. 2022. PMID: 35651807 Free PMC article.
-
Tumor Microenvironment Evaluation for Gastrointestinal Cancer in the Era of Immunotherapy and Machine Learning.Front Immunol. 2022 May 4;13:819807. doi: 10.3389/fimmu.2022.819807. eCollection 2022. Front Immunol. 2022. PMID: 35603201 Free PMC article. Review.
-
Quantifying and interpreting biologically meaningful spatial signatures within tumor microenvironments.NPJ Precis Oncol. 2025 Mar 11;9(1):68. doi: 10.1038/s41698-025-00857-1. NPJ Precis Oncol. 2025. PMID: 40069556 Free PMC article. Review.
Cited by
-
An Effective Hypoxia-Related Long Non-Coding RNA Assessment Model for Prognosis of Lung Adenocarcinoma.Front Genet. 2022 Mar 16;13:768971. doi: 10.3389/fgene.2022.768971. eCollection 2022. Front Genet. 2022. PMID: 35368654 Free PMC article.
-
Cuproptosis associated genes affect prognosis and tumor microenvironment infiltration characterization in lung adenocarcinoma.Am J Cancer Res. 2022 Oct 15;12(10):4545-4565. eCollection 2022. Am J Cancer Res. 2022. PMID: 36381320 Free PMC article.
-
Advances in the Lung Cancer Immunotherapy Approaches.Vaccines (Basel). 2022 Nov 19;10(11):1963. doi: 10.3390/vaccines10111963. Vaccines (Basel). 2022. PMID: 36423060 Free PMC article. Review.
-
Lipid metabolism characterization in gastric cancer identifies signatures to predict prognostic and therapeutic responses.Front Genet. 2022 Nov 3;13:959170. doi: 10.3389/fgene.2022.959170. eCollection 2022. Front Genet. 2022. PMID: 36406121 Free PMC article.
-
Non-small cell lung cancer and the tumor microenvironment: making headway from targeted therapies to advanced immunotherapy.Front Immunol. 2025 Feb 10;16:1515748. doi: 10.3389/fimmu.2025.1515748. eCollection 2025. Front Immunol. 2025. PMID: 39995659 Free PMC article. Review.
References
-
- Warth A, Muley T, Meister M, Stenzinger A, Thomas M, Schirmacher P, et al. . The Novel Histologic International Association for the Study of Lung Cancer/American Thoracic Society/European Respiratory Society Classification System of Lung Adenocarcinoma Is a Stage-Independent Predictor of Survival. J Clin Oncol (2012) 30:1438–46. 10.1200/JCO.2011.37.2185 - DOI - PubMed
LinkOut - more resources
Full Text Sources
Other Literature Sources