

Identification of Five Glycolysis-Related Gene Signature and Risk Score Model for Colorectal Cancer
- PMID: 33747908
- PMCID: PMC7969881
- DOI: 10.3389/fonc.2021.588811
Identification of Five Glycolysis-Related Gene Signature and Risk Score Model for Colorectal Cancer
Abstract
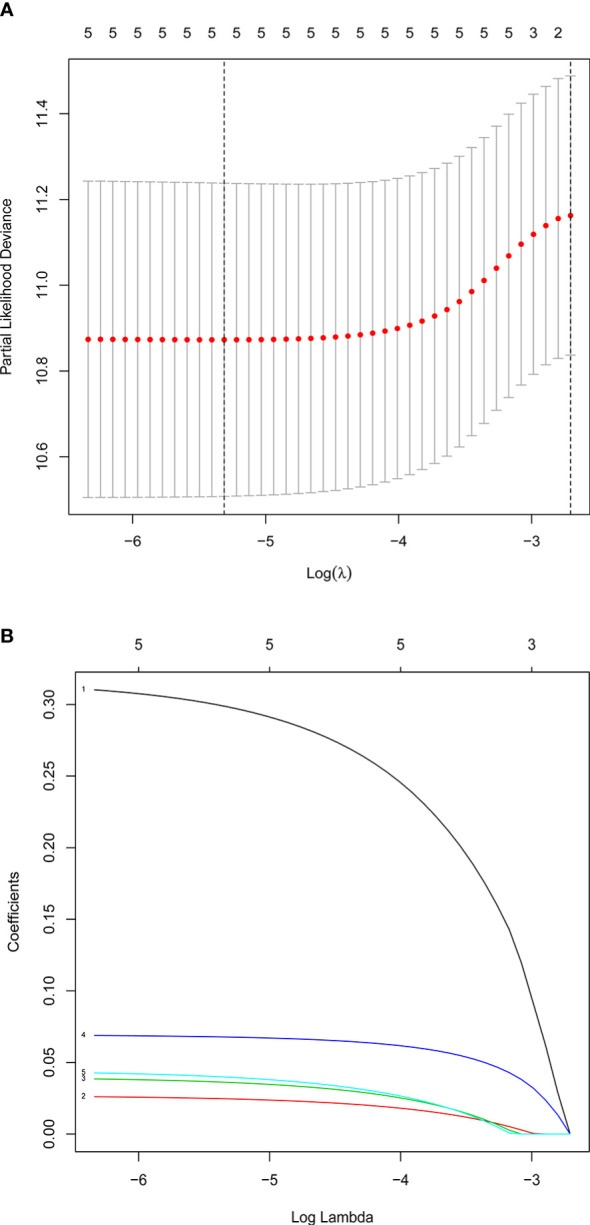
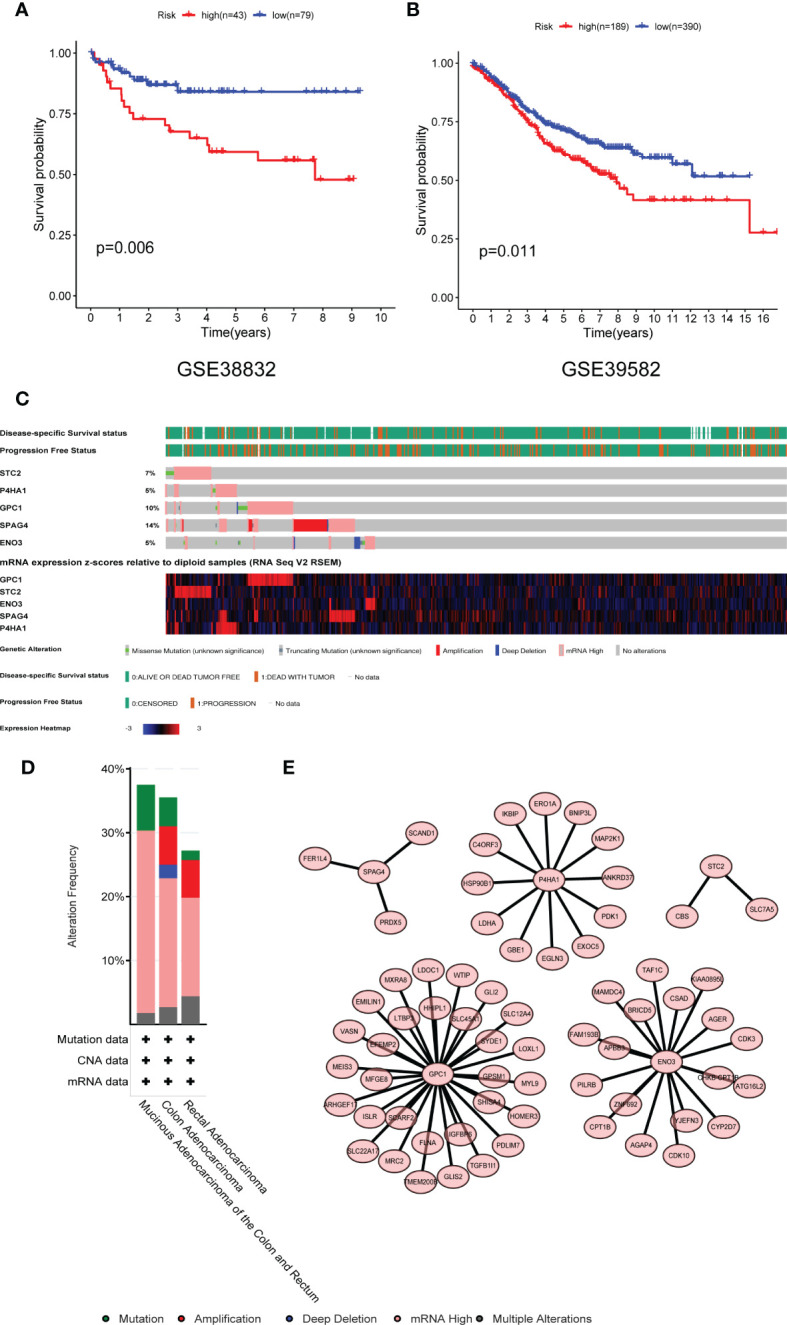
Metabolic changes, especially in glucose metabolism, are widely established during the occurrence and development of tumors and regarded as biological markers of pan-cancer. The well-known 'Warburg effect' demonstrates that cancer cells prefer aerobic glycolysis even if there is sufficient ambient oxygen. Accumulating evidence suggests that aerobic glycolysis plays a pivotal role in colorectal cancer (CRC) development. However, few studies have examined the relationship of glycolytic gene clusters with prognosis of CRC patients. Here, our aim is to build a glycolysis-associated gene signature as a biomarker for colorectal cancer. The mRNA sequencing and corresponding clinical data were downloaded from TCGA and GEO databases. Gene set enrichment analysis (GSEA) was performed, indicating that four gene clusters were significantly enriched, which revealed the inextricable relationship of CRC with glycolysis. By comparing gene expression of cancer and adjacent samples, 236 genes were identified. Univariate, multivariate, and LASSO Cox regression analyses screened out five prognostic-related genes (ENO3, GPC1, P4HA1, SPAG4, and STC2). Kaplan-Meier curves and receiver operating characteristic curves (ROC, AUC = 0.766) showed that the risk model could become an effective prognostic indicator (P < 0.001). Multivariate Cox analysis also revealed that this risk model is independent of age and TNM stages. We further validated this risk model in external cohorts (GES38832 and GSE39582), showing these five glycolytic genes could emerge as reliable predictors for CRC patients' outcomes. Lastly, based on five genes and risk score, we construct a nomogram model assessed by C-index (0.7905) and calibration plot. In conclusion, we highlighted the clinical significance of glycolysis in CRC and constructed a glycolysis-related prognostic model, providing a promising target for glycolysis regulation in CRC.
Keywords: ENO3; GPC1; P4HA1; SPAG4; STC2; colorectal cancer; glycolytic gene; prognosis analysis.
Copyright © 2021 Zhu, Wang, Bai, Wang, Hao, Zhang and Li.
Conflict of interest statement
The authors declare that the research was conducted in the absence of any commercial or financial relationships that could be construed as a potential conflict of interest.
Figures


Similar articles
-
Identification of a novel glycolysis-related gene signature for predicting the survival of patients with colon adenocarcinoma.Scand J Gastroenterol. 2022 Feb;57(2):214-221. doi: 10.1080/00365521.2021.1989026. Epub 2021 Oct 13. Scand J Gastroenterol. 2022. PMID: 34644216
-
Comprehensive Analysis of Gene Expression Profiles Identifies a P4HA1-Related Gene Panel as a Prognostic Model in Colorectal Cancer Patients.Cancer Biother Radiopharm. 2021 Oct;36(8):693-704. doi: 10.1089/cbr.2021.0242. Epub 2021 Sep 13. Cancer Biother Radiopharm. 2021. PMID: 34520234
-
Prognostic value of a novel glycolysis-related gene expression signature for gastrointestinal cancer in the Asian population.Cancer Cell Int. 2021 Mar 4;21(1):154. doi: 10.1186/s12935-021-01857-4. Cancer Cell Int. 2021. PMID: 33663535 Free PMC article.
-
ENO3 promotes colorectal cancer progression by enhancing cell glycolysis.Med Oncol. 2022 Apr 28;39(5):80. doi: 10.1007/s12032-022-01676-1. Med Oncol. 2022. PMID: 35477821
-
A glycolysis-related two-gene risk model that can effectively predict the prognosis of patients with rectal cancer.Hum Genomics. 2022 Feb 2;16(1):5. doi: 10.1186/s40246-022-00377-0. Hum Genomics. 2022. PMID: 35109912 Free PMC article.
Cited by
-
Beyond ENO1, emerging roles and targeting strategies of other enolases in cancers.Mol Ther Oncolytics. 2023 Nov 10;31:100750. doi: 10.1016/j.omto.2023.100750. eCollection 2023 Dec 19. Mol Ther Oncolytics. 2023. PMID: 38075246 Free PMC article. Review.
-
Identification and Validation of a Hypoxia and Glycolysis Prognostic Signatures in Lung Adenocarcinoma.J Cancer. 2024 Jan 21;15(6):1568-1582. doi: 10.7150/jca.91504. eCollection 2024. J Cancer. 2024. PMID: 38370379 Free PMC article.
-
Identification and verification of a glycolysis-related gene signature for gastric cancer.Ann Transl Med. 2022 Sep;10(18):1010. doi: 10.21037/atm-22-3980. Ann Transl Med. 2022. PMID: 36267782 Free PMC article.
-
A novel signature model based on mitochondrial-related genes for predicting survival of colon adenocarcinoma.BMC Med Inform Decis Mak. 2022 Oct 22;22(1):277. doi: 10.1186/s12911-022-02020-3. BMC Med Inform Decis Mak. 2022. PMID: 36273131 Free PMC article.
-
Development and Validation of an 8-Gene Signature to Improve Survival Prediction of Colorectal Cancer.Front Oncol. 2022 May 10;12:863094. doi: 10.3389/fonc.2022.863094. eCollection 2022. Front Oncol. 2022. PMID: 35619909 Free PMC article.
References
LinkOut - more resources
Full Text Sources
Other Literature Sources
Miscellaneous